


Australia - Economy and demography

The Australian economy is one of the largest in the world. It is an amazing country. Although raw materials are the main export products, it is one of the most developed countries in the world. At the same time, from mid-1991 to the end of 2019, the country avoided recession. Only the COVID-19 pandemic broke the streak.
The opinion about one of the most developed countries is confirmed by the HDI index (Human Development Index). The index assesses countries in terms of: expected quality of life, quality of education, and national income per person. In 2019, Australia was in 6th place, ahead of countries such as Sweden (8), Singapore (9) and the United States of America (16). Poland ranks only 32nd.
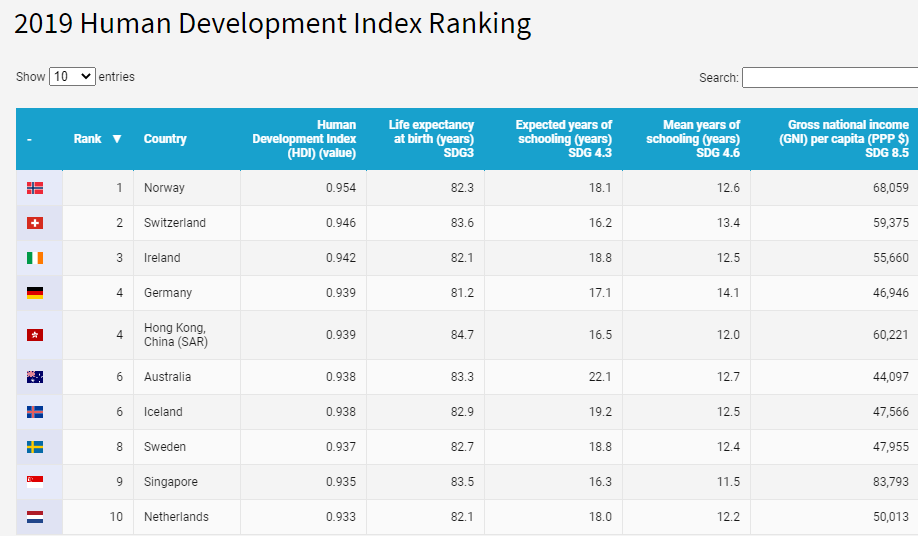
Source: UN Developmet Program
Australia ranks very well in the ranking Corruption Perceptions Index (Corruption Perception Index) by Transparency International. Australia in 2019 obtained a result of 77 points, which placed the country in 12th place. Behind Germany (9) or Denmark (1), but before the USA (23), France (23) and Japan (20).
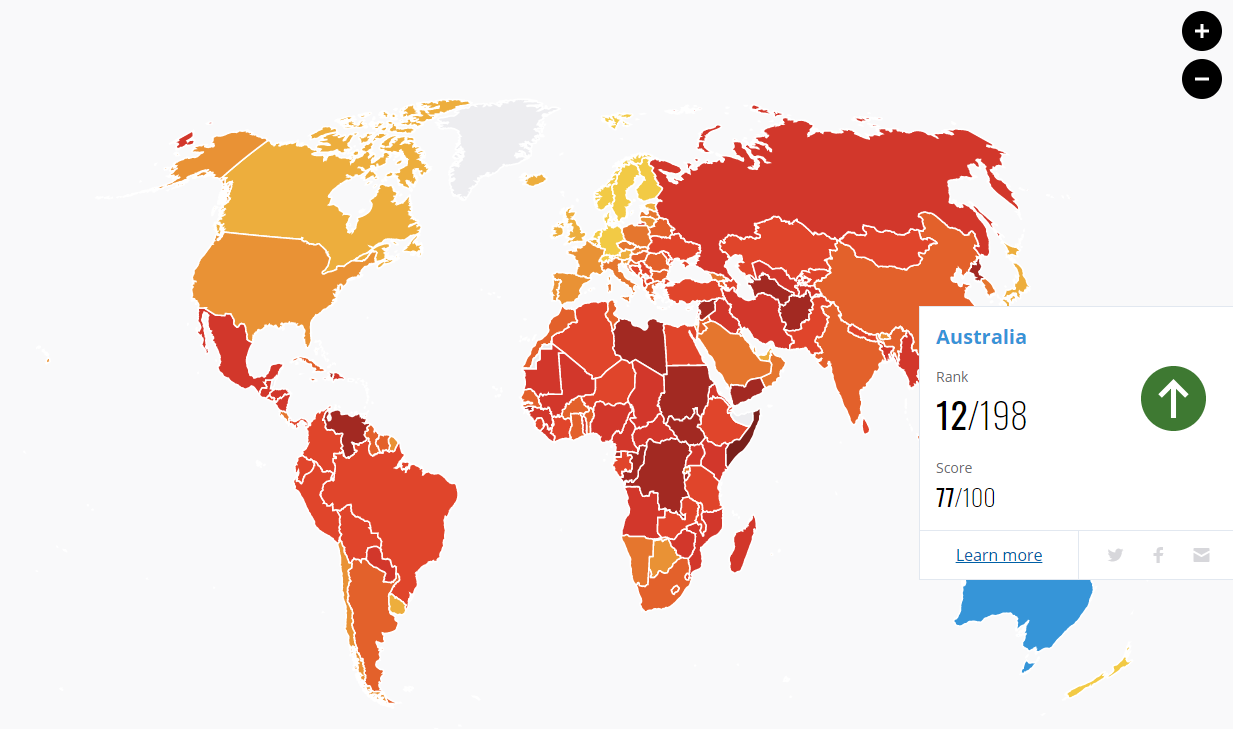
Source: transparecy.org
In the case of the competitiveness index Global Competitiveness Index Australia is already weaker. It takes "only" 16th position. Its weaknesses are infrastructure (29th place) and ICT adaptation (29th place).
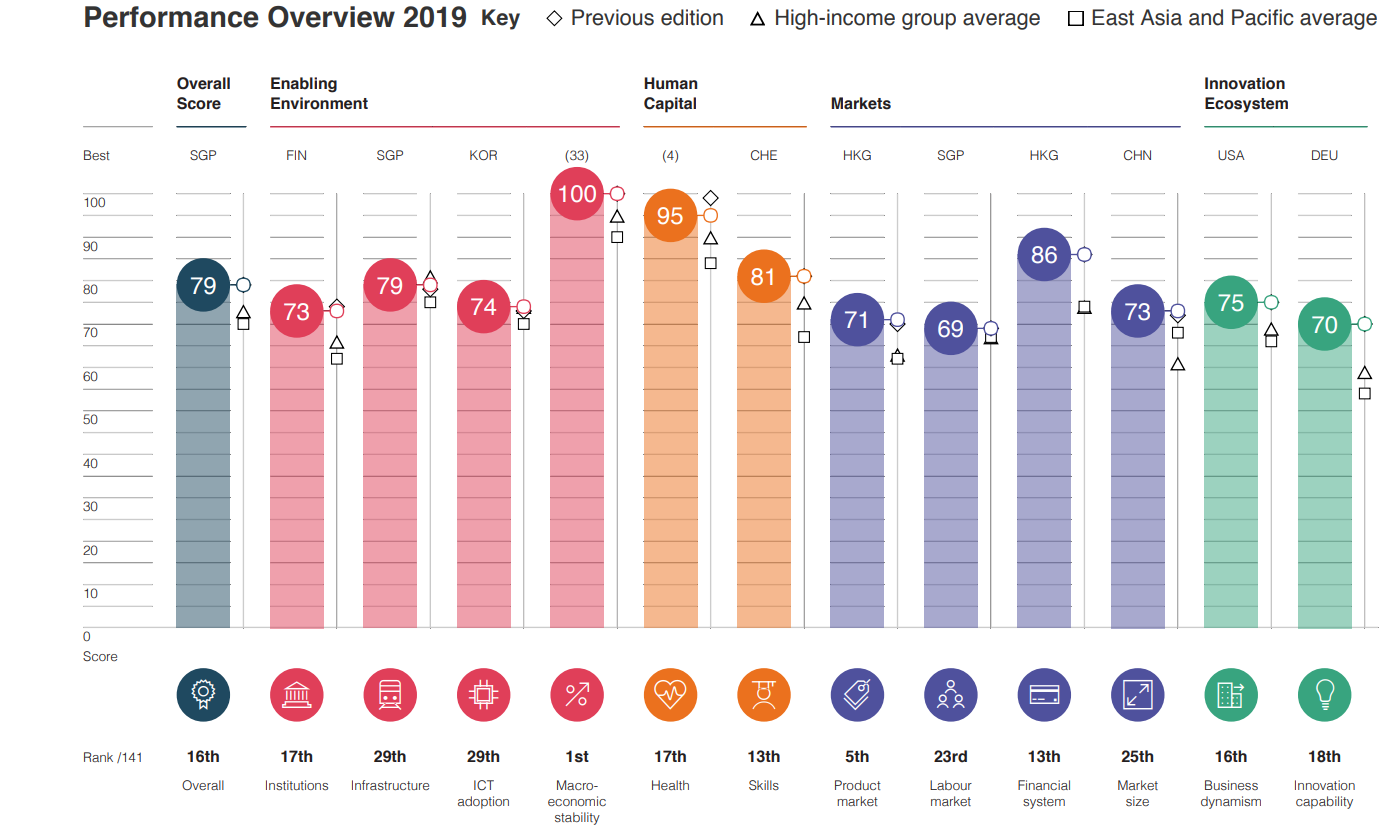
Source: Global Competitiveness Index 2019
The overall competitiveness index ranks Australia behind the United States (2), South Korea (13) and Japan (6). Lower than Australia, however, there are, among others Norway (17), New Zealand (19) and Israel (20).
Australian dollar (AUD)
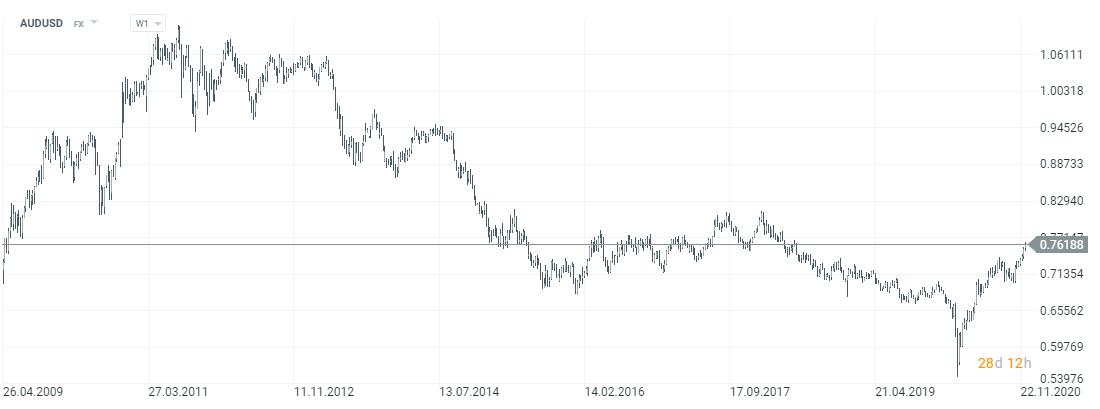
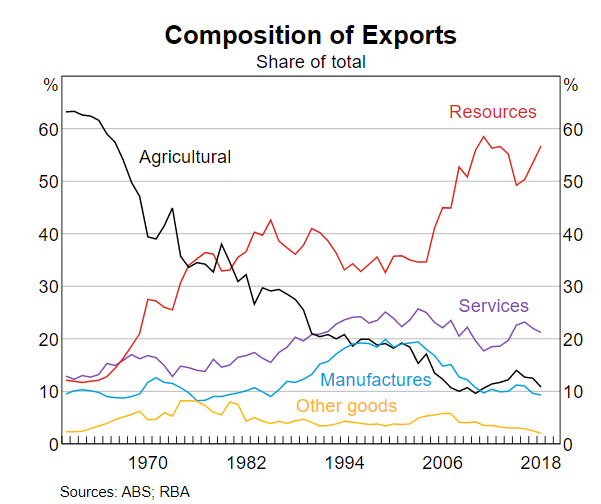
The Australian dollar is one of the major commodity currencies. This is not surprising considering the structure of exports. More than half of Australia's exports are raw materials. The exported goods include coal, copper, nickel, iron ore, gold. One cannot forget about the hydrocarbons (natural gas).
Interest rates - monetary policy
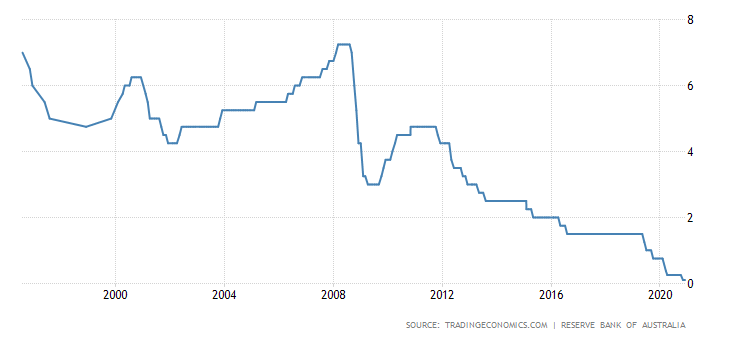
Like most countries in the world Reserve Bank of Australia conducts a loose monetary policy. This is confirmed by the interest rate, which currently stands at 0,1%. In 2012, it was over 4%.
Real estate market
The policy of low interest rates supports the real estate market which, despite the slowdown, is one of the strongest in the world. The price peak was established in 2017. The current low interest rates stimulate the demand, which is supported by the demographic situation (growing population) anyway.

The rise in property prices means that fewer and fewer Australians can afford housing. According to the Australian Institute of Health and Welfare, just over 50% of those born between 1982-1986 owned their own property in 2016. This cohort of 30-34 year olds had the lowest real estate ownership rate in history. In 1981, the generation of the then 30-34 year olds (born 1947-1951) had a 68% ownership rate.

Source: aihw.gov.au
Economic development over the years
Australia has one of the largest economies in the world. According to data from the World Bank, in 2019 the Australian economy was the fourteenth in the world in terms of GDP ($ 1 billion). This meant less than 393% of the global GDP. In terms of purchasing power parity, Australia ranks 1,6th (between Saudi Arabia (18) and Thailand (17)).
Australia's economic growth has been very strong over the past 28 years. Between 1991 and 2019, GDP growth in purchasing power parity increased by 5,42% annually. The world grew at a similar pace, which allowed Australia to keep about 1% of global GDP. Below is a compilation of the World Bank.
|
GDP (PPP) |
1991 |
2005 |
2010 |
2019 |
|
Australia |
$ 307 billion |
$ 664 billion |
$ 866 billion |
$ 1 billion |
|
World |
$ 30 billion |
$ 66 billion |
$ 89 billion |
$ 135 billion |
|
% share of world GDP |
0,99% |
1,00% |
0,97% |
0,99% |
Australia is one of the most developed economies in the world. Below is a compilation of the World Bank:
|
GDP (PPP) per person |
1991 |
2005 |
2010 |
2019 |
|
Australia |
17 784 $ |
32 575 $ |
39 301 $ |
$ 53 |
|
USA |
$ 24 |
$ 44 |
$ 48 |
$ 65 |
|
World |
$ 5 |
$ 10 |
$ 12 |
$ 17 |
|
% US |
73,05% |
73,84% |
81,09% |
81,88% |
Australia's economy is primarily service-focused. More than two-thirds of GDP comes from services. In turn, industry is responsible for around 25% of the Gross Domestic Product.
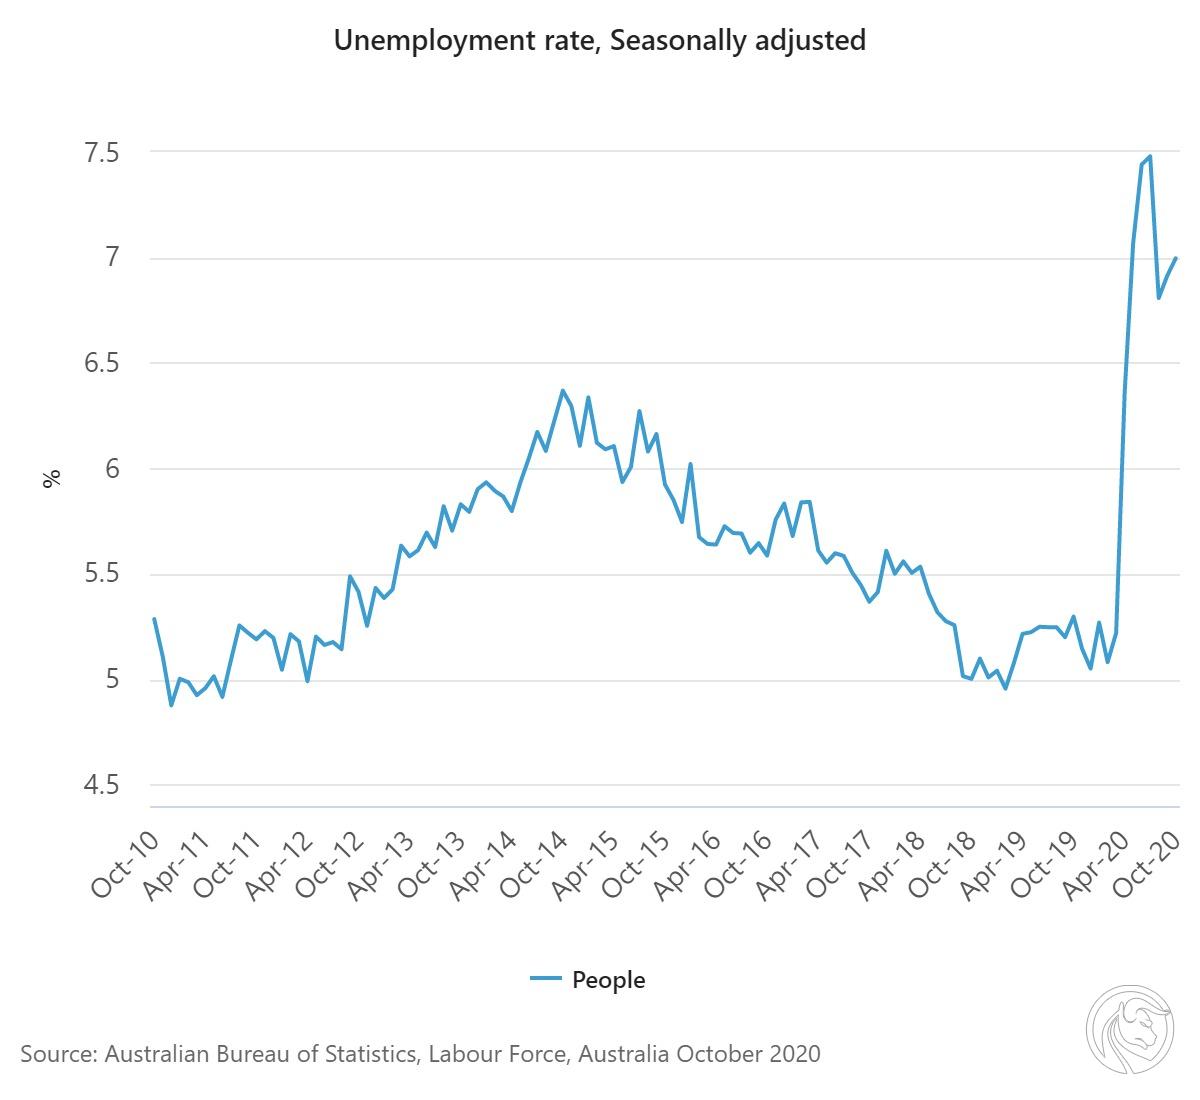
Over the last 10 years, the unemployment rate ranged between 5% -6,5%. The most recent increase to 7,5% was due to the impact of COVID-19 on the economy.
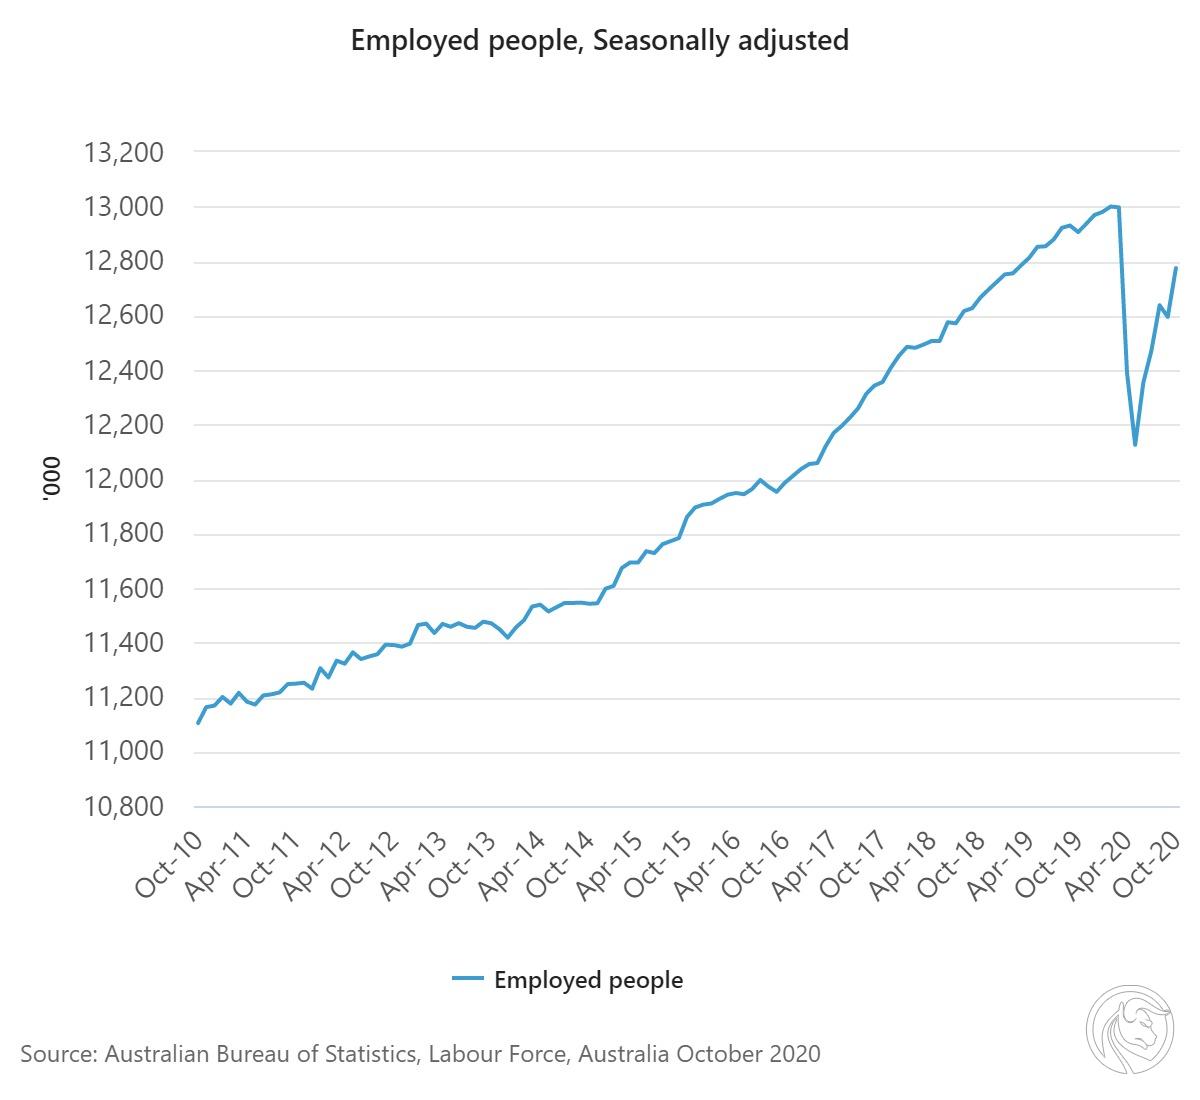
However, it should be noted that between October 2010 and October 2019, the number of people employed increased from 11,1 million to 12,9 million. This meant that the economy was able to create jobs for a growing population.
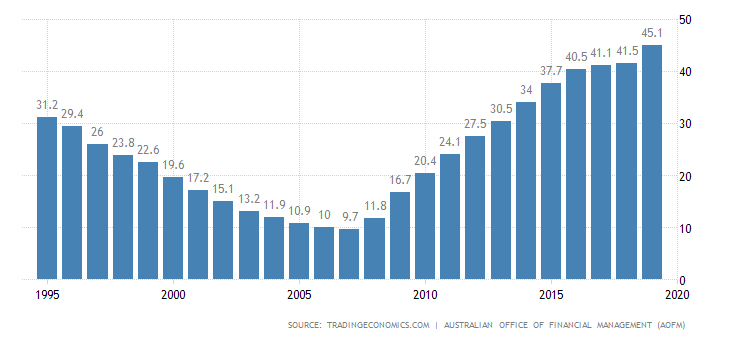
Good economic situation and conservative fiscal policy of the government led to keeping the debt to GDP at a low level.
Due to the stable macroeconomic situation and low indebtedness, Australia enjoys high credit ratings. Australia is one of the few countries that can boast an AAA rating among the three largest rating agencies (Moody's, S&P, Fitch).
Economic forecasts 2050
According to a 2017 PwC report, the Australian economy will drop from 19th to 28th place in terms of GDP after purchasing power parity. Australia is to be overtaken by Bangladesh or Vietnam.
Banking sector
The Australian banking sector is dominated by the "big four" which include: Commonwealth Bank, Westpac, ANZ Bank, and the National Australia Bank. According to data prepared by the ABA (Australian Banking Association), the "big four" had about 75% of the assets accumulated by all banks operating in Australia (there are 98 of them in total). Below is a chart showing the share of "Big 4" in the assets of Australian banks:

Source: own study based on ABA data
World Trade
Contrary to appearances, the Australian economy is not mainly export-oriented. The share of exports is below the world average. However, this is a level much higher than the US economy. Below is a comparison of selected countries:
|
Exports of goods and services as% of GDP |
1991 |
2005 |
2010 |
2019 |
|
Australia |
16,06% |
18,26% |
19,81% |
24,13% |
|
Germany |
23,67% |
38,06% |
42,56% |
46,97% |
|
USA |
9,66% |
10,01% |
12,32% |
11,72% |
|
China |
14,49% |
33,83% |
27,18% |
18,42% |
|
Poland |
N/A |
34,61% |
40,05% |
55,75% |
|
World |
19,20% |
28,59% |
28,92% |
30,62% |
Source: World Bank
A good definition of a position on a trade map is the trade openness index, which determines the relationship between trade turnover (exports and imports) and a country's GDP. The higher the index, the greater the role of international trade in the country's economy. In the case of Australia, it is clear that it is an economy less dependent on trade than the average economy.
|
Trade as% of GDP |
1991 |
2005 |
2010 |
2019 |
|
Australia |
32,26% |
39,27% |
40,65% |
45,68% |
|
Germany |
47,82% |
70,92% |
79,87% |
88,09% |
|
USA |
19,79% |
25,56% |
28,06% |
26,39% |
|
China |
25,95% |
62,21% |
50,72% |
35,69% |
|
Poland |
N/A |
70,28% |
82,11% |
106,24% |
|
World |
38,53% |
56,09% |
57,03% |
60,40% |
Source: World Bank
Australia is not a trading tycoon. According to data from the world bank, Australia was in 19th place in terms of exports with a value of $ 342,6 billion. It was not much more than Polish exports ($ 329,8 billion). It is worth remembering that Australian GDP exceeds Polish GDP by 135% (according to the World Bank).

Source: World Bank - Trade Balance
Australian trade continues to be concentrated in East Asia. According to data prepared by the Department of Foreign Affairs and Trade (DFAT), about 75,8% of exports go to East Asia, while imports from East Asia account for 52,9% of total imports.
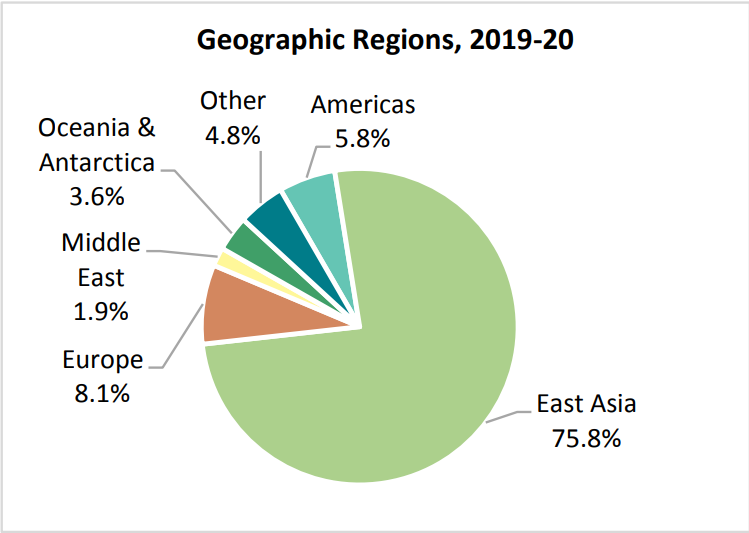
Source: DFAT
Low-processed products dominate in exports. According to data collected by DFAT, minerals and fuels dominated in the case of basic goods. Services and processed products account for only 27,2% of exports.
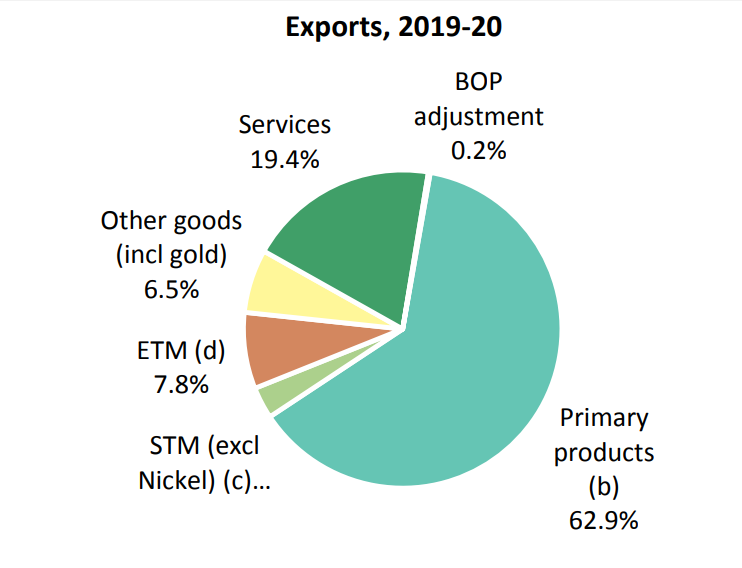
Source: DFAT
Where does Australian export go - main partners
Asian countries are the largest recipients of Australian goods. The largest share of exports goes to China (AUD 151,5 billion). Other directions of trade are Japan (AUD 53,8 billion) and South Korea (AUD 25,8 billion). There are only two countries in the top ten that are not in Asia. These are the United States and the United Kingdom.
|
Place |
End |
Turnover value (AUD billion) |
|
1 |
China |
151,5 |
|
2 |
Japan |
53,8 |
|
3 |
South Korea |
25,8 |
|
4 |
USA |
17,9 |
|
5 |
Great Britain |
15,8 |
|
6 |
Singapore |
12,3 |
|
7 |
Tajwan |
11,9 |
|
8 |
Indie |
10,9 |
|
9 |
Nowa Zelandia |
10,1 |
|
10 |
Malezja |
8,1 |
Source: DFAT
Where Australia imports from - main partners
More than half of the imports come from the countries of East Asia. This is due to from the geographical proximity of Asian markets. Australia imports the most products and services from China (AUD 81,1 billion). In the top ten, only 3 countries are not from Asia. These are the United States, Germany and the United Kingdom.
|
Place |
End |
Turnover value (AUD billion) |
|
1 |
China |
81,1 |
|
2 |
USA |
37,5 |
|
3 |
Japan |
19,3 |
|
4 |
Tajlandia |
14,6 |
|
5 |
Germany |
13,7 |
|
6 |
South Korea |
10,7 |
|
7 |
Malezja |
10,1 |
|
8 |
Singapore |
9,2 |
|
9 |
Nowa Zelandia |
7,5 |
|
10 |
Great Britain |
7,0 |
Source: DFAT

Source: DFAT
Imports are dominated by processed products and services (74,9%). Basic and low-processed products account for only 18,2% of imports.
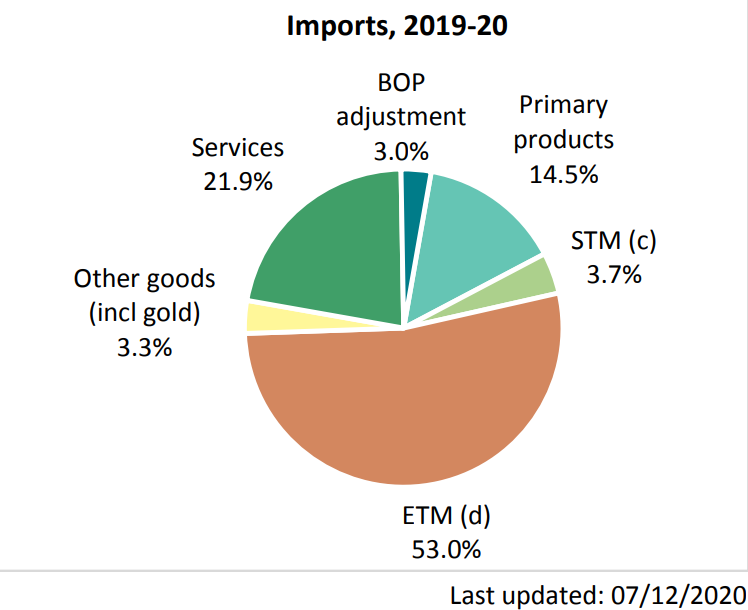
Source: DFAT
Demography - a healthy demographic structure
According to data from the United Nations, Australia will have an estimated population of 2020 million in 25,5. This means that the country, despite its huge area, is very sparsely populated. The population size is comparable to that of South Korea or Taiwan.
According to the United Nations, Australia's population will increase to 30 million over the next 32,8 years. Below is a comparison with Germany and Poland.
|
Country / Region |
2020 |
2050 |
CARG% |
|
Australia |
25,5 |
32,8 |
+ 0,84 % |
|
Germany |
83,8 |
80,1 |
-0,15% |
|
Poland |
37,8 |
33,3 |
-0,42% |
|
World |
7 794,8 |
9 735,0 |
+ 0,74 % |
Source: UN World Population Prospects 2019
The demographic structure in Australia is very healthy. Over the next 30 years, demographic changes will not be negative.
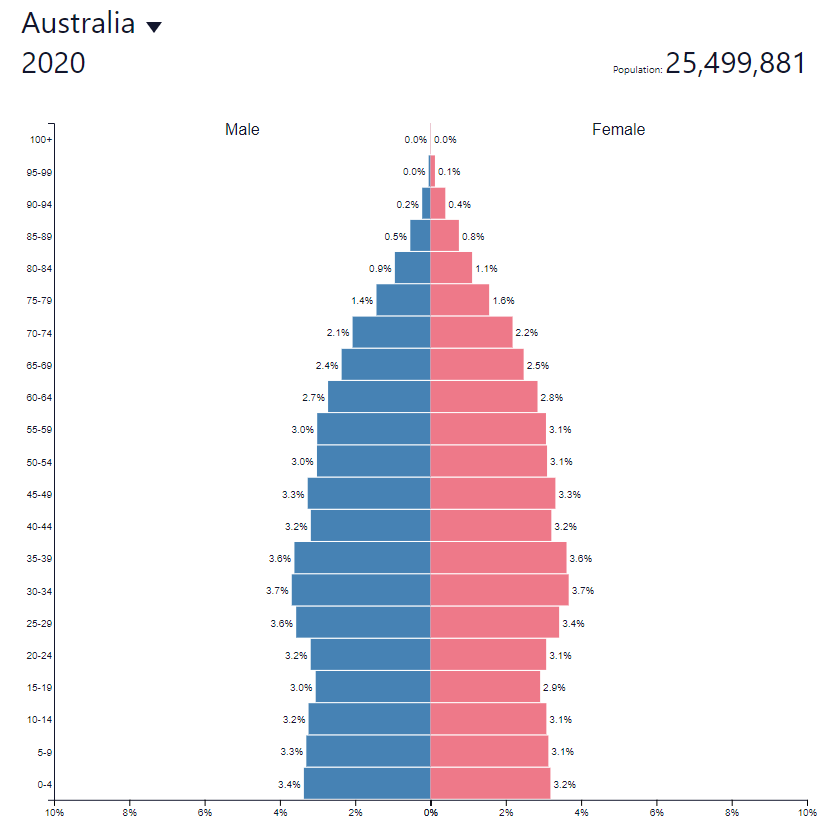
This means that no significant increase in the demographic burden is to be expected. The old dependency ratio is 24%. It is an indicator that divides the number of people aged over 64 by the number of people of working age (15-64). According to OECD, the ratio in Japan is over 45%.
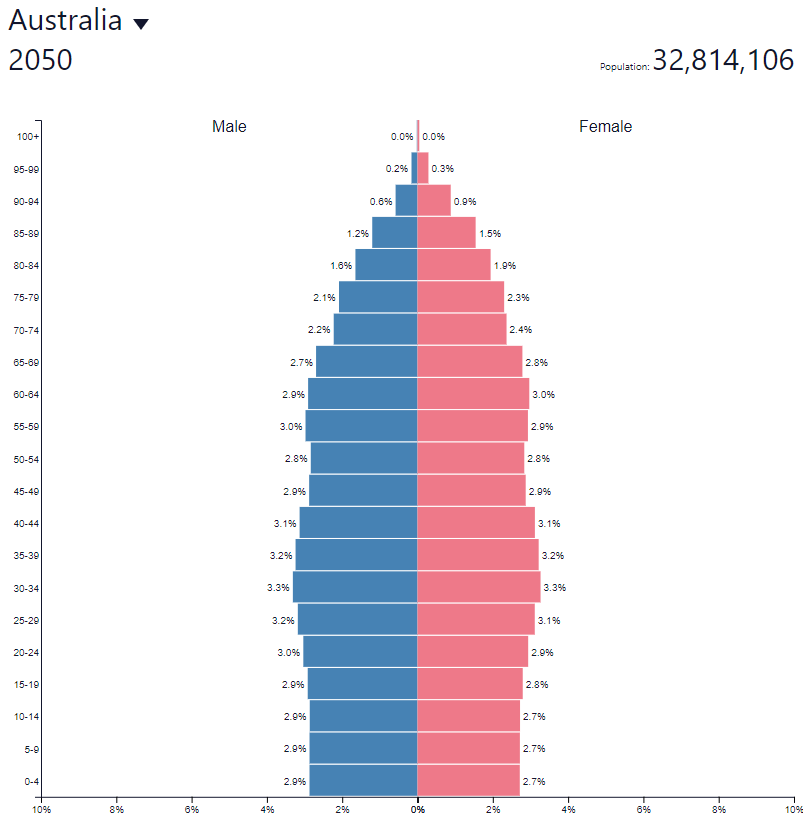
The reason for the increase in the population is the large immigration to Australia which keeps the age pyramid at a healthy level.
Summation
Australia is considered a resource economy. However, this is a simplification. The mining industry accounts for less than 10% of Australia's GDP. At the same time, Australia is not very dependent on exports. The trade-to-GDP ratio is below the global average. Of course, it is one of the 19 largest exporters in the world. The main recipients of the products are Asian countries. Australia mainly sells raw materials and low-processed products. As one of the few developed countries, its demographic structure will not deteriorate in the next 30 years. This is due to the friendly immigration policy. Australia will certainly benefit from its geographic location. The proximity of dynamically developing Asia will support the development of the Australian economy.


Leave a Response