The situation on the stock exchanges is becoming more and more interesting. USA on the verge of recession?

The American stock exchange entered the fourth quarter of 2019 in terrible moods. First, on Tuesday, investors were moved by the ISM index for US industry, which in September unexpectedly fell to 47,8 points. (forecast: 50,1 points), which was its lowest reading in a decade and the announcement of a recession in this sector. Then, on Wednesday, players got scared of a customs war between the US and the European Union after the World Trade Organization (WTO) declared EU subsidies to Airbus illegal, which opens President Trump's way to imposing retaliatory measures on European goods.
Bears gain an advantage
The fear resulted in a decline in the S & P500 index by 1,23 percent. on Tuesday and by 1,79 percent. on Wednesday, which meant not only a strong retreat below the July peak, but also a general deterioration of the situation on the chart and the appearance of several other supply signals that may suggest further declines.
The fact that stock bulls are in a difficult situation can be clearly seen on the chart of the US500 instrument on the platform Tickmill, i.e. a contract of difference based on the S & P500 index.
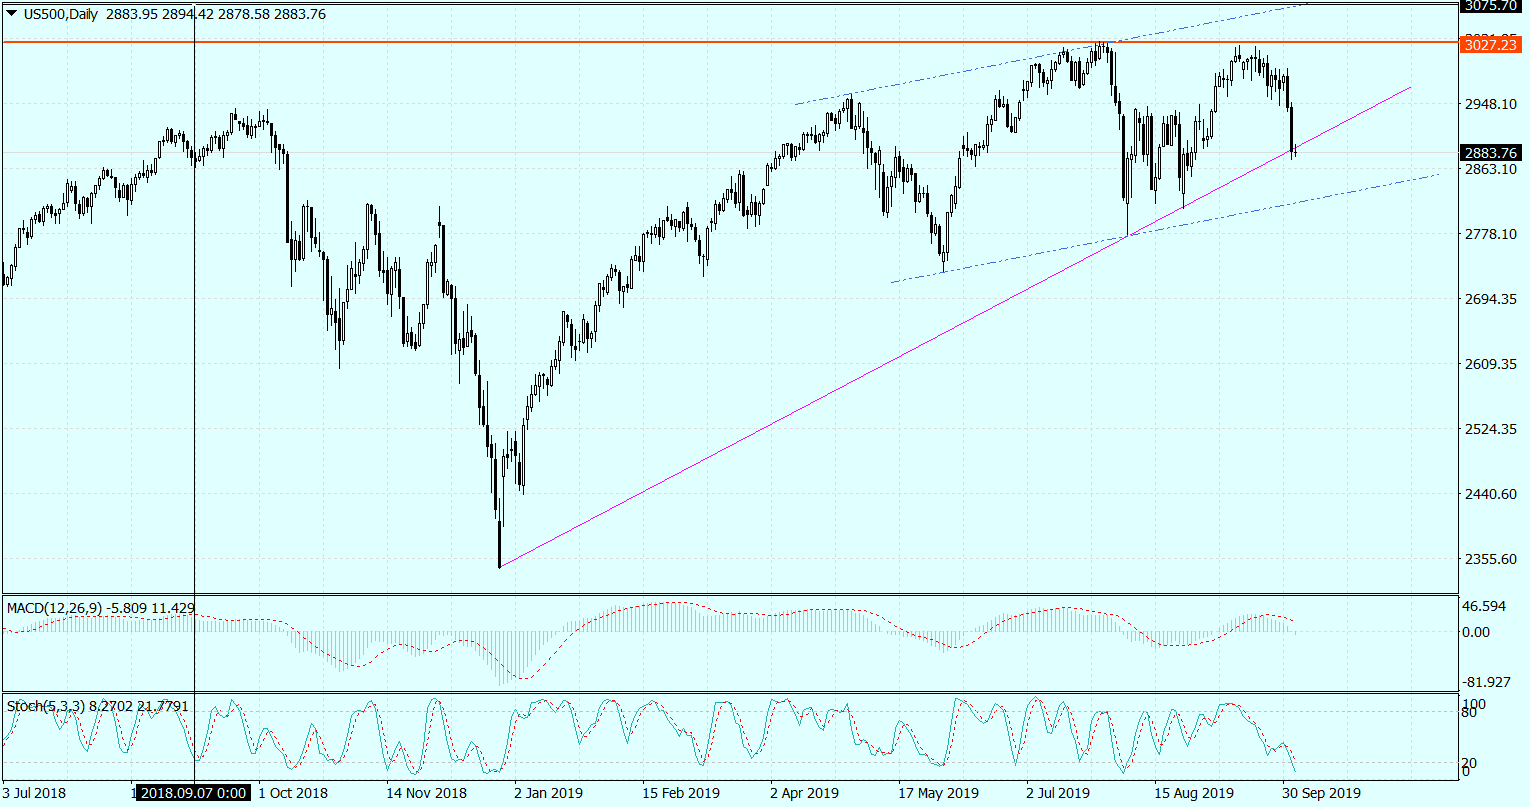
S&P 500 chart [US500], D1 interval. Source: MetaTrader 4 Tickmill UK
The last two days of declines suggest that the market has already put a proverbial cross at the July peak and is now preparing to attack the August minima (2777,15). Earlier, he only has to deal with the level of 2818, which is the lower limit of the growth channel.
The situation is similar on DE30 (CFD on the German DAX) or on the index of e.g. the Italian stock exchange, where the charts of both these instruments also returned below important resistances, which is accompanied by deterioration of the situation on the indicators and suggests further declines . In a word, it gets more and more interesting on the stock exchange.
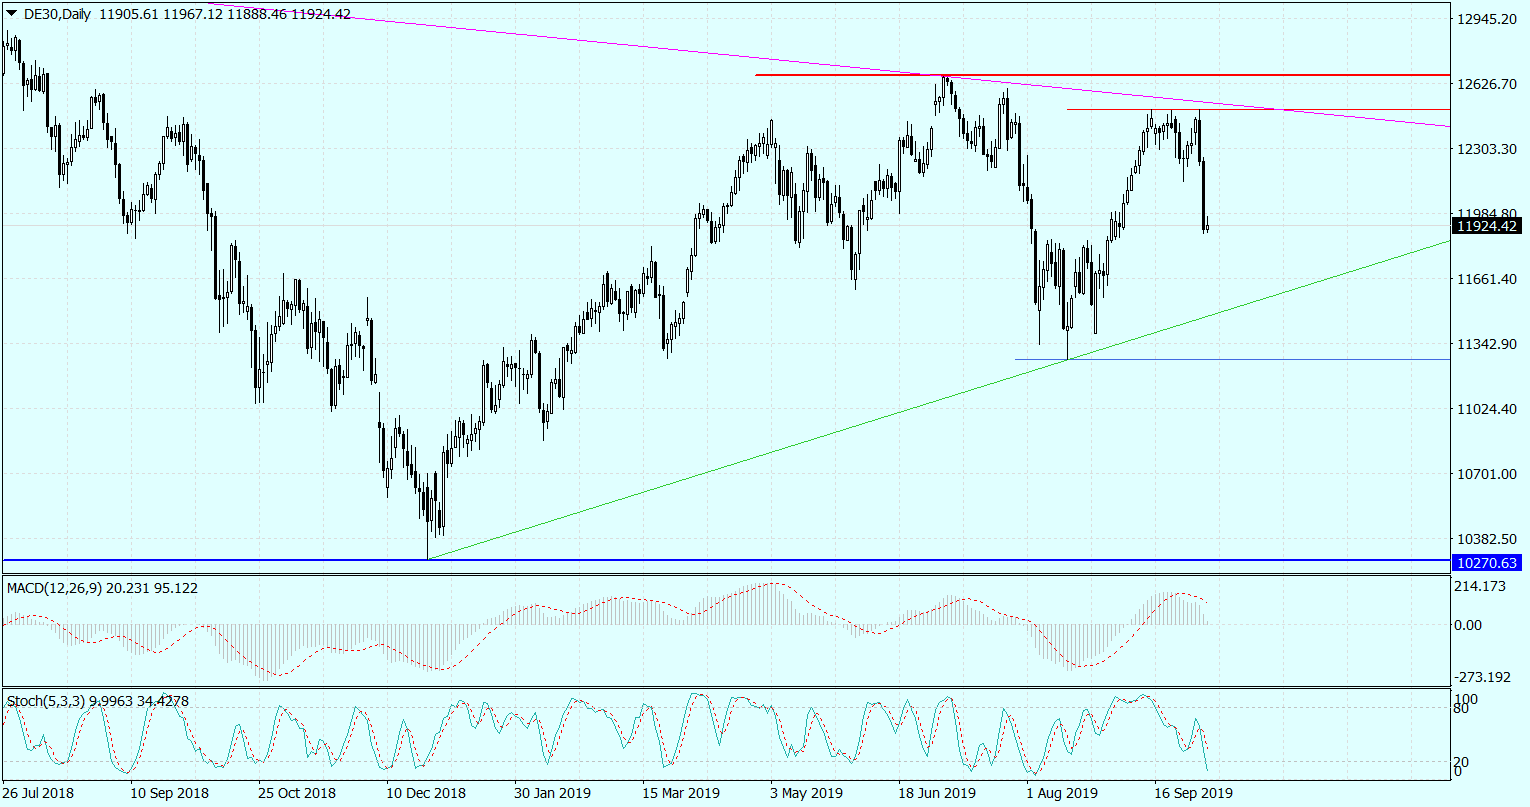
DAX 30 chart [DE30], D1 interval. Source: MetaTrader 4 Tickmill UK
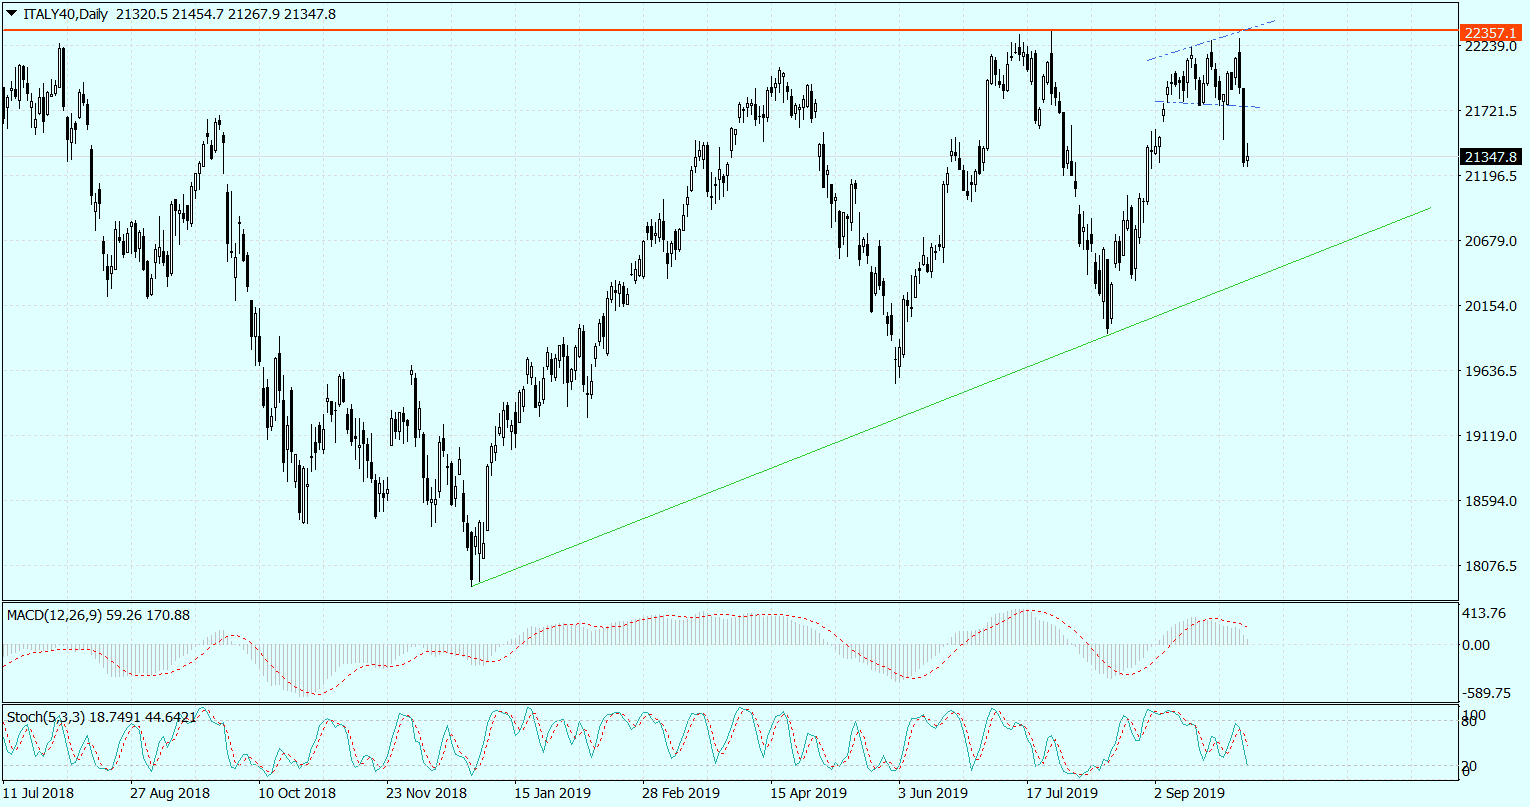
MIB 40 chart [ITALY40], D1 interval. Source: MetaTrader 4 Tickmill UK