


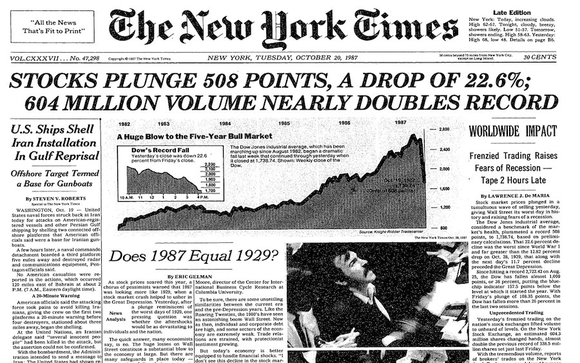
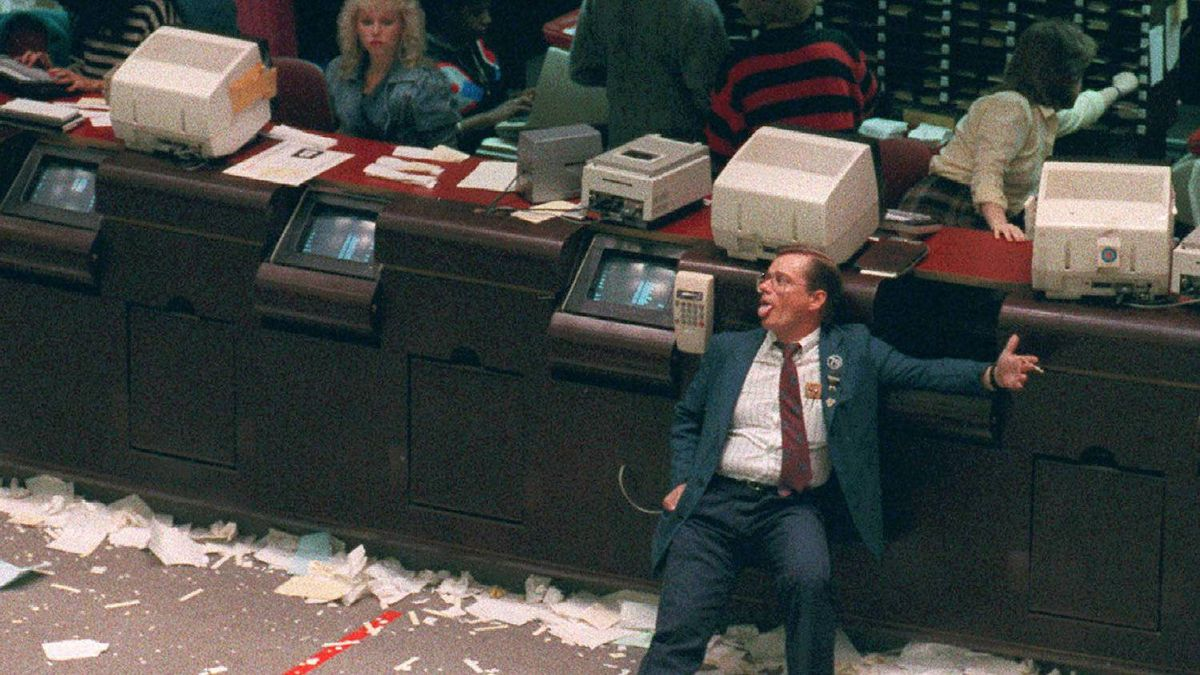
Black Monday, or what the panic on the stock market looked like in 1987

October 19, i.e. Cearly Monday was the most traumatic experience for the "bulls" in the 19s. It was the day when the biggest drops in the history of many stock exchanges (including the United States, Hong-Kong) took place. On Monday, October 1987, XNUMX, the course Dow Jones Industrial Average 30 index (DJIA) fell by 508 points, i.e. O 22,6%. The crash caused many analysts to fear the sustainability of economic growth. The 1987 crash affected every of the 23 major stock exchanges in the world. In dollar terms, the eight markets fell between 8% and 20%. From the Malaysia Stock Exchange, Mexico and New Zealand lost between 30% and 39%. Also, three stock exchanges fell by more than 40% (Hong Kong, Australia, Singapore). Of the developed stock exchanges, Vienna was the least affected (-11,4%). On the other side was Hong Kong (-45,8%). The most panicked journalists and analysts even mentioned a repetition of Great Depression (1929). In today's text, we will present the great boom of the 80s, which ended in 1987. We will try to find an answer to what was the main reason for such great drops that took place on October 19.
Prelude to the bull market - crisis 1982
The beginning of the 80s was very difficult for the American economy. In March 1980, inflation was 14,8%. To remedy the problem of inflation in August 1979 he was appointed chairman Federal Reserve Bank established Paul Volckerwhich was considered a "hawk". Raising interest rates helped reduce inflation. The interest rate has been raised to over 20%. Monetary tightening helped to contain inflation, but also caused an economic slowdown. This, in turn, caused increase of unemployment. The peak of the economic slowdown took place at the turn of November and December 1982. The national unemployment rate exceeded 10,8%. It was the highest unemployment rate since the Great Depression. The following states were particularly hard hit: Michigan (16,4%), West Virginia (20,1%) and Alabama (15,3%). In the spring of 1983, as many as 30 states reported double-digit unemployment.
The crisis of 1982 also caused problems in the banking sector. In 1983, 50 banks went bankrupt as a result of a difficult financial situation. In turn, the FDIC (Federal Deposit Insurance Corporation) reported that 540 banks "May have problems". The banking sector problems passed in 1984 with the rescue of Continental Illinois Bank ad Trust Company, which had $ 45 billion in assets. In 1981, it was the 7th largest bank in the United States. By comparison, the largest Bank of America back then had $ 118 billion in assets.
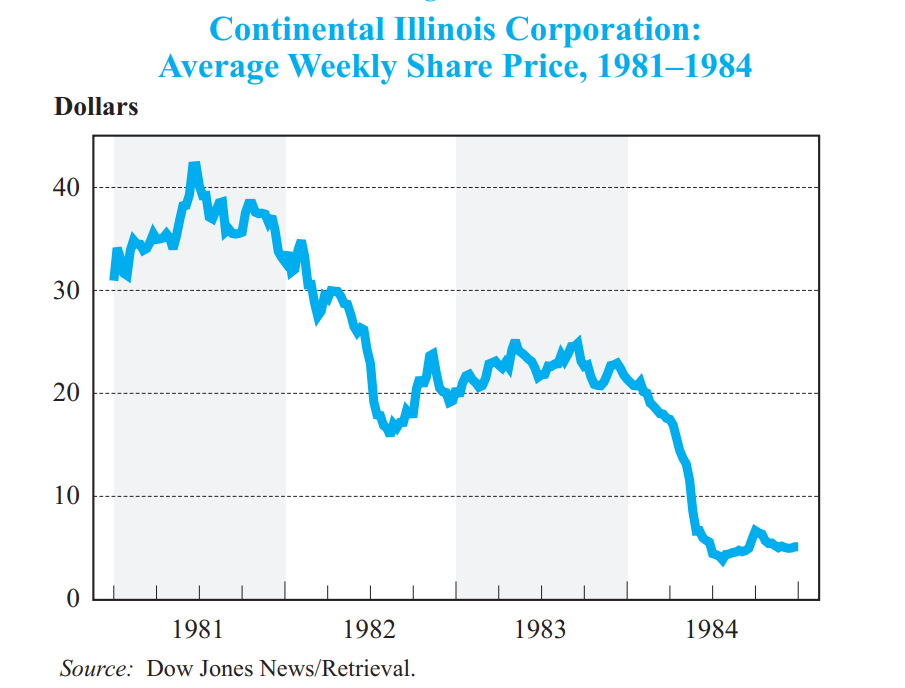
Source: FDIC.gov
During the first months of 1984, rumors prevailed that the bank's financial condition was very poor. On May 9, 1984, Reuters asked for a comment from the bank regarding rumors that it was on its way to bankruptcy. The bank run weakened the bank's liquidity. As a result, on May 11, Continental had to ask for a $ 3,6 billion loan from the Fed. However, it was only a temporary solution. The FDIC came to the rescue, borrowing $ 2 billion together with its partners. At the same time, the FDIC has guaranteed deposits of up to $ 100. A buyer was sought, but it failed. Finally, after two months, a plan to buy $ 000 billion of bad loans from the bank was introduced. As you can see, the TBTF (to big to fail) mechanism was known even before the 4,5-2007 crisis.
However, the problem was not only related to the banking sector. Credit and savings unions also had problems. The bad credit problem made many credit unions' balance sheets terrible. Bad loans resulted from the economic downturn and high interest rates. There were two solutions: declaration of bankruptcy or forced mergersthat were buying time. Between 1980 and 1983, 118 credit unions with assets totaling $ 43 billion collapsed. Over 700 cash registers have been taken over by the competition. The crisis at the cash desks lasted until 1989, that is until the introduction of the Recovery and Enforcement Act 1989.
Hossa 1982-1986
However, the weak macroeconomic environment did not stop the stock markets, which are very common "Are ahead of the economy". So at a time when the US economy was recovering from the crisis, the US stock market was booming. What did it result from? The US began to control the rate of inflation, which allowed it to begin a cycle of interest rate cuts. As a result, investors expected the cost of credit to decline, which would encourage companies to invest and increase employment. Unemployment will start to decrease, which will improve the economic situation of households. Investors therefore assumed an increase in retail sales, which will translate into improved financial results. In these 4 years, the Dow Jones Industrial Average increased by more than 135% (from August 1982 to December 1986).
In early 1987, it seemed that the boom would continue. Until August 26, 1987 S&P 500 index increased by 38%, while the DJIA by about 40%. These were phenomenal rates of return. American investors were filled with optimism, which was reflected in company valuations. The price-earnings ratio for the S&P 500 index was over 20. It was the highest indicator in 25 years. It can be said that the valuations were ambitious, with the market assuming that the rapid growth in revenues, profits and cash flow would continue in the coming years. If the companies failed to meet the assumed growth rate, a profound revaluation would be possible.
The causes and history of the 1987 crash
Modern hedging strategies
The 80s also saw a dynamic development of "automatic" portfolio strategies. Novice computerization provided computing ability at an unprecedented level. Computerization has also reached the financial world. The strategies were not very sophisticated. Gaining popularity was the so-called automatic wallet insurance. The strategy encouraged buying stocks with cash when stock prices were rising and selling stocks when prices were falling. A novelty was the use of futures contracts as a substitute for selling shares. From now on, as stocks fell, the manager had been buying a short position in index futures (known as selling contracts). When there were increases, short positions were closed. This way of managing positions was especially liked by financial institutions that wanted to use hedging strategies to "beat the market".
Just before the crash
The beginning of the problems did not seem so terrible. At the end of August 1987, the market corrected by 10%. The declines were short and lasted about a month. It looked like a healthy correction, a similar one took place in April of the same year. After a temporary decline, investors resumed purchases. On October 2, the Dow Jones Industrial Average rose to 2 points (662% below the peak). However, Bykom did not have enough strength for further increases. The supply side started to gain advantage. This led to the index being pushed below the important support which was the September 3 low. This has encouraged trend-following traders to open short positions in futures and sell stocks. The reasons for the drops were, among others, disappointing report on US trade deficit. It was greater than the forecasts. Investors and analysts expected that the FED may decide to raise interest rates in order to contain the downward pressure on the dollar. On October 22, 15 (Thursday), there was a sharp sale of stocks and bonds. The sale of the shares was largely due to the automatic transactions covering the portfolio.
On Friday, October 16, the stock market sell-off continued. Automatic transactions were especially troublesome "Protecting" wallet. What did it result from? The sale of futures contracts resulted in a decline in forward prices. As a result, there was a difference between the cash and the term valuation. Companies acting as arbitrators tried to take advantage of this discrepancy. They were buying a futures contract and selling a basket of stocks that was supposed to represent the fluctuations in the index (eg the S&P 500). The stock supply further "forced" systems to reduce their exposure to the stock market. Friday was very difficult for investors in the stock market. The DJIA index fell by 108 points. It was the largest point drop in the index in history. Large declines encouraged retail investors to sell fund units. At the same time, many strategies generated orders after Friday's session "Hedging portfolio". The market at the end of the week was very nervous. But fuel to the fire was added to the weekend speech by the Secretary of the Treasury, James A. Baker. Contrary to market expectations, he mentioned that the government and the Federal Reserve will not intervene in the currency market to strengthen the dollar. This meant that the government and the FED did not mind the weakening of the dollar. This can be explained by the fact that a weaker dollar means more competitive exports, which will improve the US trade balance. However, instead of reducing uncertainty, the interview introduced more questions to investors. As a result, Monday was getting very "red". However, what happened on October 19 surpassed even the wildest bears' expectations.
Crash 1987
Monday
When it seemed that Friday's session was tragic for the bulls then Monday 19.10/XNUMX said simply "Hold my beer". Monday started with problems with the opening of the stock exchange. It was not due to technical problems, but due to the imbalance between sell and buy orders (sales dominated). At 10:00 AM, almost 100 companies included in the S&P 500 did not have an opening price. In turn, the futures market opened from a large decline. After the opening, the cash market continued its declines. However, nervousness increased after the announcement by the boss SECthat "Stock quotes may be temporarily suspended". As always in such a situation, there is no calming down of moods, but greater panic.
It is also worth mentioning that trade in the US market was very concentrated. Large financial institutions had the largest share in the turnover. Suffice it to mention that The top 10 sellers of futures contracts accounted for 40% of the turnover. The problem was that the market ran out of liquidity (ie buyers). The panic combined with the desire to “cut losses” and hedge the portfolio resulted in a drastic sell-off. The Dow Jones Industrial Average 30 ended the day down 508 points. This meant a decrease by 22,6%. It was the worst session in the history of the New York Stock Exchange.
However, the index is actually the average of the selected listed companies. Therefore, the sell-off affected large enterprises that had a stable financial situation. There were market opportunities. For example McDonald's capitalization fell by 16,5%, P&G by 27,7% and Coca-Cola by 24,5%.
The problem has also arisen with investors who use leverage. The sharp declines put many buyers of shares on credit in a very difficult situation. After the session ended on Monday, there were big calls to supplement the security deposit, the so-called "Margin call".
Source: reddit.com
Tuesday
To calm the market sentiment before the opening of Tuesday's session, the Fed announced that it would provide liquidity to protect the stability of the financial system. Words went to work. October 20 Fed through open market operations injected $ 17 billion into the banking sector. After a temporary rebound, however, there was a return to declines. At the height of the panic, the quotations of derivatives on the CBOE and CME exchanges were suspended. The situation began to improve after over 600 companies announced a share buyback plan. Firms found that they would use this gift from the market to buy stocks below their intrinsic value.
The sharp drops meant that more and more voices were voiced about a repeat of the 1929 crisis. However, nothing like that happened. The indices set new highs two years later. And the great boom ended only in the XNUMXst century. With the bursting of the technology bubble.
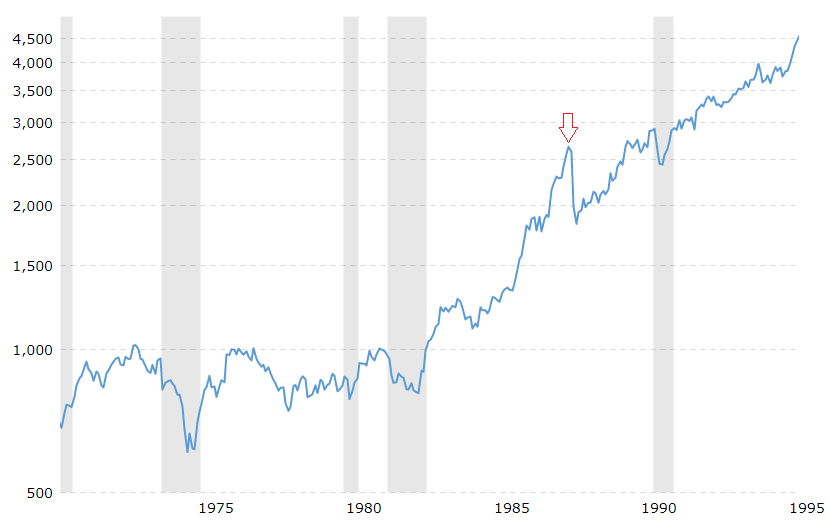
DJIA 30 index chart. Source: macrotrends.net
The Crash of 1987 and Japan
A very interesting example is Japanwhich at the end of the 80s was in a period of very dynamic growth. Both the stock market and the real estate market grew. More and more commentators mentioned that Japan would soon overtake the United States and become the largest economy in the world. In Japan, the crash took place on Tuesday. The reason was the time differences between the US and Japan. However, the consequences of the crash were much milder than for the US stock exchange. After only 5 months, the Nikkei recovered from the crash. By comparison, American investors had to wait until 1989. It is worth noting that Nikkei index ended 1987 with an increase of 15,3% (y / y). It was therefore the 10th consecutive year when the index ended the year "positive". Ultimately, the great boom on the Japanese stock exchange ended with the bursting of the bubble on the local real estate market. It happened less than three years after the 1987 crash.


