


An unnoticed filter of market behavior, or a few words about the volume

The volume on the market is often referred to simply as turnover. The use of this ratio is the most justified on the equity market and futures, it is more difficult for CFD instruments. This seemingly simple information, which reflects the change of the owner of a given stock or contract in a specific period of time, is often underestimated by traders. In graphs we often see him placed at the bottom usually in the form of vertical lines. It's worth getting to know him better and understand.
Be sure to read: What is the Forex market volume?
Confirmation of price movements
The volume is very often used in many strategies as a confirmation of price movements of a given instrument. It is freely used in technical analysis when determining the probability of an upward or downward impulse in a particular formation. It is very helpful in identifying the power of the trend. In the case of a strong upward trend in the market should move in accordance with the direction of price movement. What do we mean by that? The observation of candles is key. With bullish candles (we are talking about an uptrend), it should be larger, while bearish ones systematically and proportionally decrease. It is a signal for us that investors invest their capital in long positions on a given instrument.
Check it out: Real volume on the xStation platform
Reversal of the trend or false dislocation?
In addition to price, the volume is information that maps real values that are not calculated on the basis of certain patterns (as in the case of indicators). When looking for a potential place to reverse the trend, it is worth paying attention to whether the breakdown finds its confirmation in turnover. If the volume is small when the volume is high, there is a very good chance that the move was purely speculative.
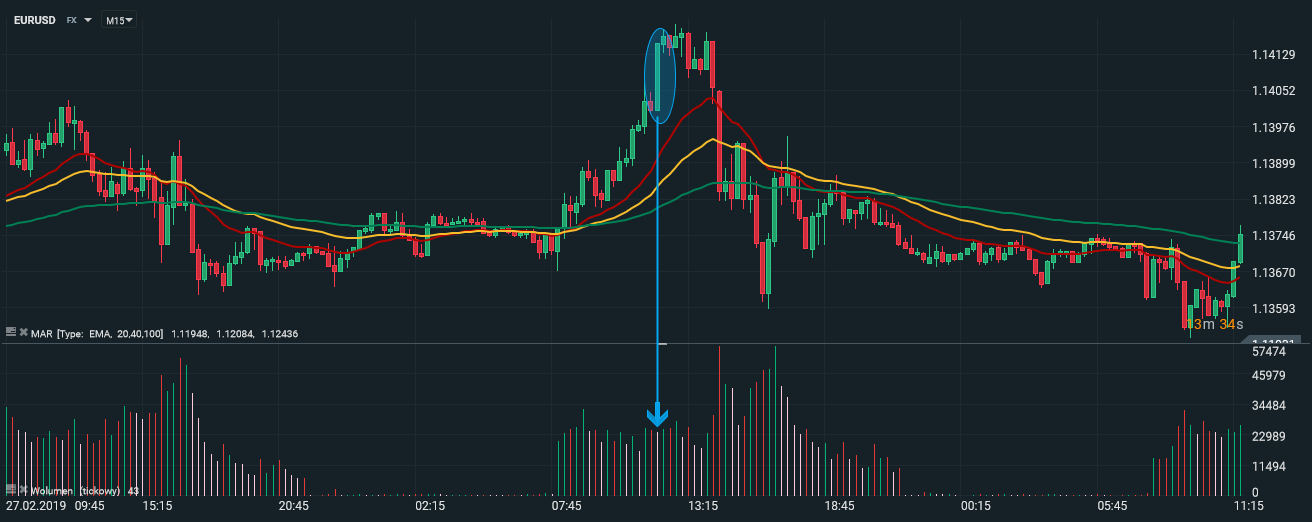
EUR / USD, xStation platform xTB
The same applies to the analysis of known candle formations. In the graphs below, we can observe a quite characteristic and easily recognizable falling star. Technical analysis places them as one of the signals of reversing the upward trend. In the first chart, we see the explicit support of the formation through the turnover generated during its creation. Therefore, there is a higher probability that the upward trend actually has been exhausted, and the price level is not (perhaps still) attractive enough to buy. In the second case we can observe two consecutive falling stars. They seem to be a kind of "double" signal to the exhaustion of growth. Turnover, however, does not indicate that this would actually happen. What is more, with demand impulses they were very significant. Therefore, it would be worth to watch more candles, bearing in mind that this formation may be misleading in this situation.
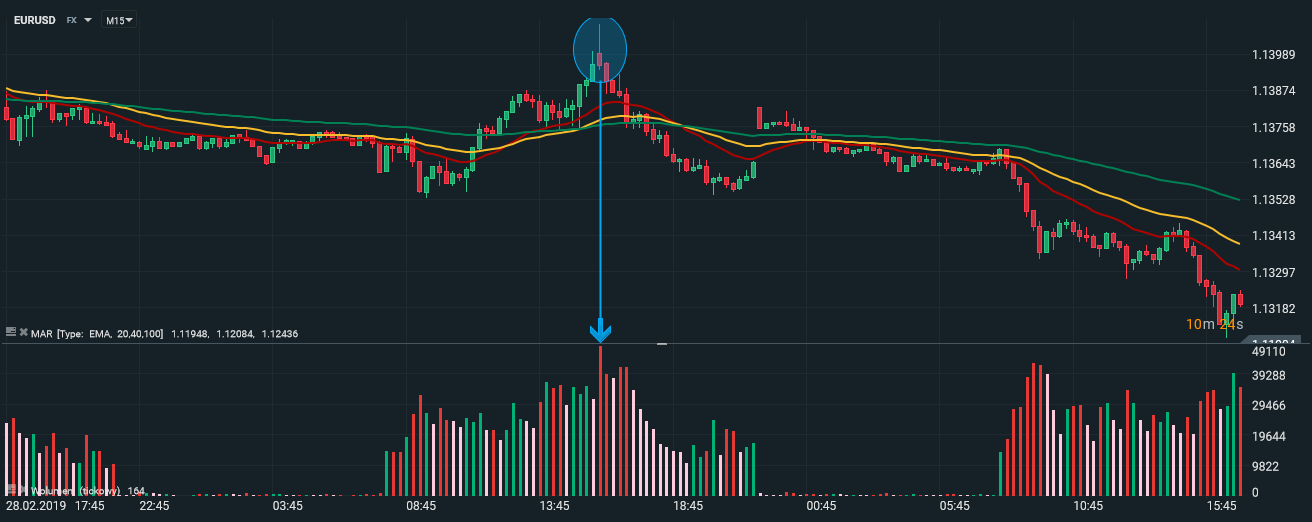
EUR / USD, xStation platform xTB
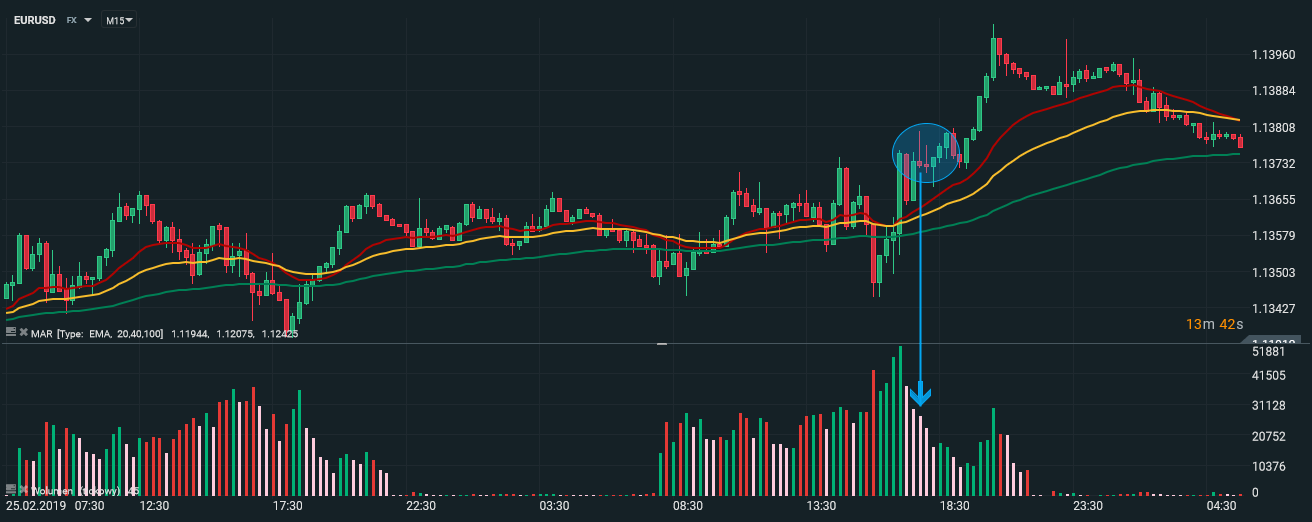
EUR / USD, xStation platform xTB
Breaking the levels and market liquidity
Similar to the formations, the volume is very useful for price action lovers. Both methods are often combined. Observation of the volume of turnover at key support or resistance levels works similarly as in the case of candle formations. It allows to some extent to identify the chances of breaking or rebounding from a given price. If it occurred with a small variation of turnover, it can be concluded that at that time no major investor participated in the generated traffic which will eventually be negated.
Be sure to read: Differences in charts between brokers
Thanks to its analysis, we can also determine the amount of capital involved in a given instrument. In periods of lower volatility in the market (analogically reduced liquidity, although this applies more to the stock market), it is worth adjusting the size of the position to the situation.
Of course, volume analysis is not the answer to all questions. It is worth considering it as a tool allowing for real assessment of price movements on the market. In my opinion, it is an interesting addition to everyday analysis.


