


Impet - introduction to the analysis [Jim Poniat]

impetus (momentum) according to the great dictionary of the Polish language: "Speed and momentum accompanying some action or process". A quote from Leonardo Da Vinci stuck in my memory for good. "Simplicity is the pinnacle of sophistication". All the techniques I use are very simple and easy to understand, although Forex trading seems extremely difficult.
We are looking for "ours" an easy-to-understand strategy that would bring you optimal returns. Of course, in the trading market there are countless systems, strategies, not to mention indicators. Unfortunately, we are not able to test them all. So what strategy is optimal for us? Which one will bring us profits? Will it work in all markets and time frames? I will answer these questions in the following articles.
For many years I have tested a lot of theories, strategies and systems, but I achieved the best results through IMPET analysis - which turned out to be the KEY TO SUCCESS! Have you ever wondered why these changes are occurring when you look at the price movement on a chart? Several elements have a huge impact on the price change.
Price changes
Price is the most important element of technical analysis. The chart below shows typical price movements. Price moves sideways for a period of time, then there is a sharp breakout and then sideways again. The market spends 70% to 80% in side traffic. And this is where most traders lose cash. This is due to the lack of knowledge about the trend, momentum and sideways behavior of the price.

Typical market changes
The only traders who make a profit are those who recognize changes in momentum. Recognizing the starting point of the momentum is extremely important here. If you find an indicator that can find the starting point of its growth, your success is guaranteed.
There are several elements that affect the changes in momentum and hence price changes.
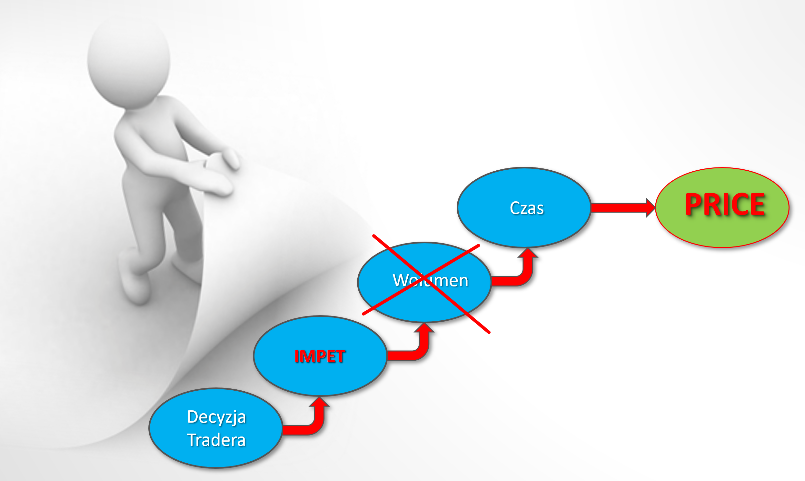
Elements influencing the price change
Elements influencing price changes
- Trader's decision - when we decide to open a position or refrain from trading, this is the first step we take.
- Momentum - in this case, the critical element that we should recognize.
- Volume - in the Forex market we have no real volume. You can additionally buy such a function from several brokers, but it is an extremely expensive service. I don't know if you know, but volume recognition can be made based on the size of the candles. This element, therefore, does not exist in our analyzes.
- Timebecause all these elements must come into existence over a certain period of time. If one is missing (without taking into account the volume), the price will not change.
NOTE: lack of momentum means insignificant price changes
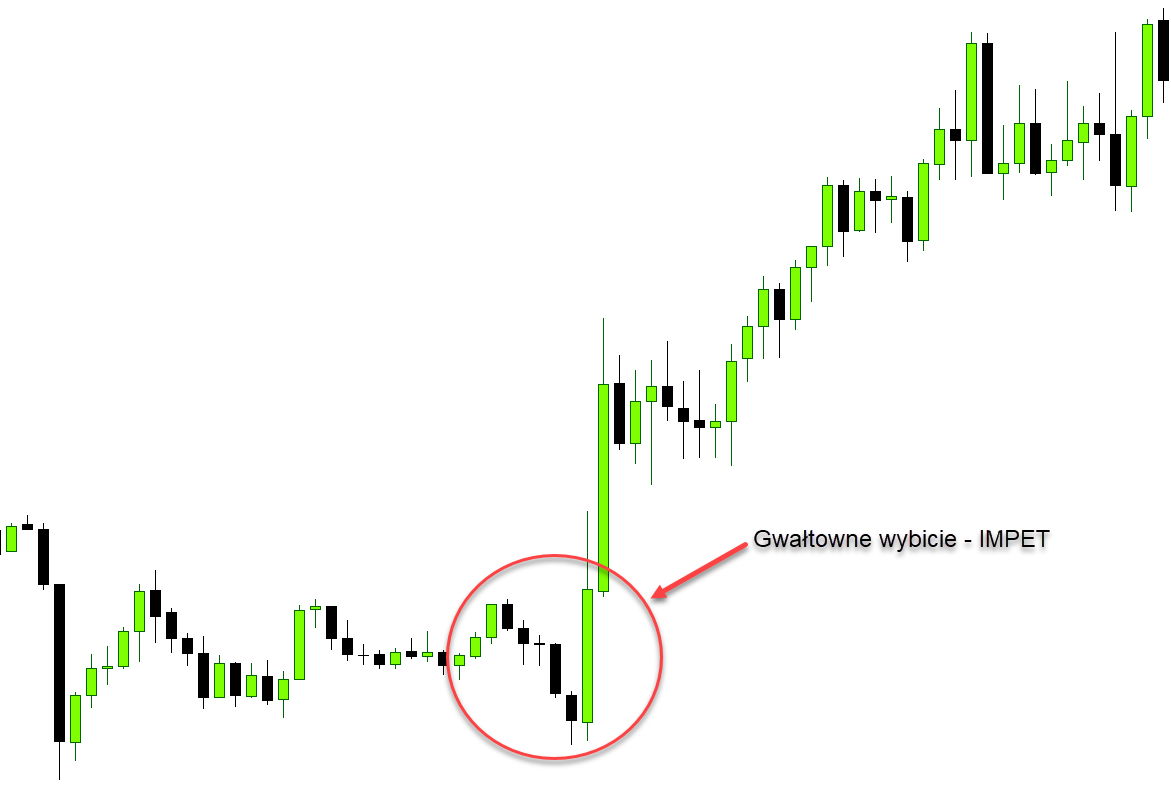
Impet causes visible price changes (ang. Price Action). Do you know why so many traders who only trade with price movements are not successful in trading? Because they do not pay attention to what causes rapid price changes - IMPET (MOMENTUM). Impet is the critical and most important element of profitable trading. The turning points and the strength of the trend are caused by momentum. If there is no momentum, there is no significant price change.
When a position is opened no matter what technique we use, momentum must be present to bring the price to the target.
Rapid trend reversal due to an increase in the upside
If there is a significant increase in momentum, there is practically zero risk. Exactly as in the graph above and below.
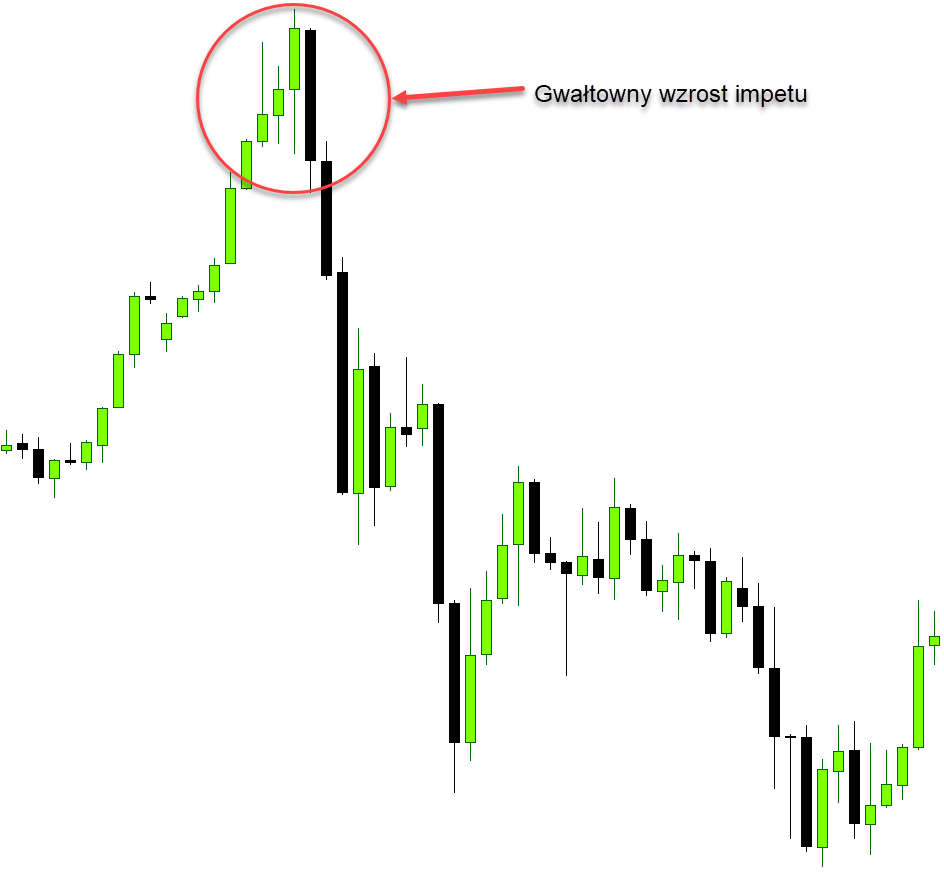
A sharp increase in momentum in a downward direction, which causes a change from an uptrend to a downward trend
Impet and Bill Williams
Bill Williams opened my eyes to the typical price changes in a trend, even though Bill does not teach momentum trading, but it was with him that I understood how incredibly important it is in the analysis. If we look at a few charts we see that the price, as I mentioned, most of the time 70% to 80% drifting sideways in the consolidation. At some point, there is a sharp breakout and the price rises rapidly, where it then consolidates. You probably opened a position more than once when the price was at the beginning of the beginning of consolidation and you made a stop loss, and after a while the price started moving in the previously chosen direction again.
READ NECESSARY: Round price levels - use them in your analysis
Many novices fall prey to the lack of knowledge. Here is a basic understanding of the behavior of momentum - a key component of price movement. When we open a position on the basis of Price Action alone, we are unfortunately not sure about its correct opening. Proper price increase / decrease along with momentum is only 20-30% of the trend. It is the analysis of momentum that tells us the strength and the beginning or end of each swing.
Fractals and Alligator are the first step to a very simple momentum analysis (the rest of Bill Williams' metrics were "black magic" to me). Our analysis should be based on the minimum number of indicators so that we can observe the price on a relatively clean chart. Alligator is great at indicating changes in momentum, and fractals show signals to open a position. But let's move on to examples of how fractals and alligator work together.
Fractals
Many traders have not used these two great indicators. Let's start with the fractals. The indicator marks highs and lows where the price reverses.
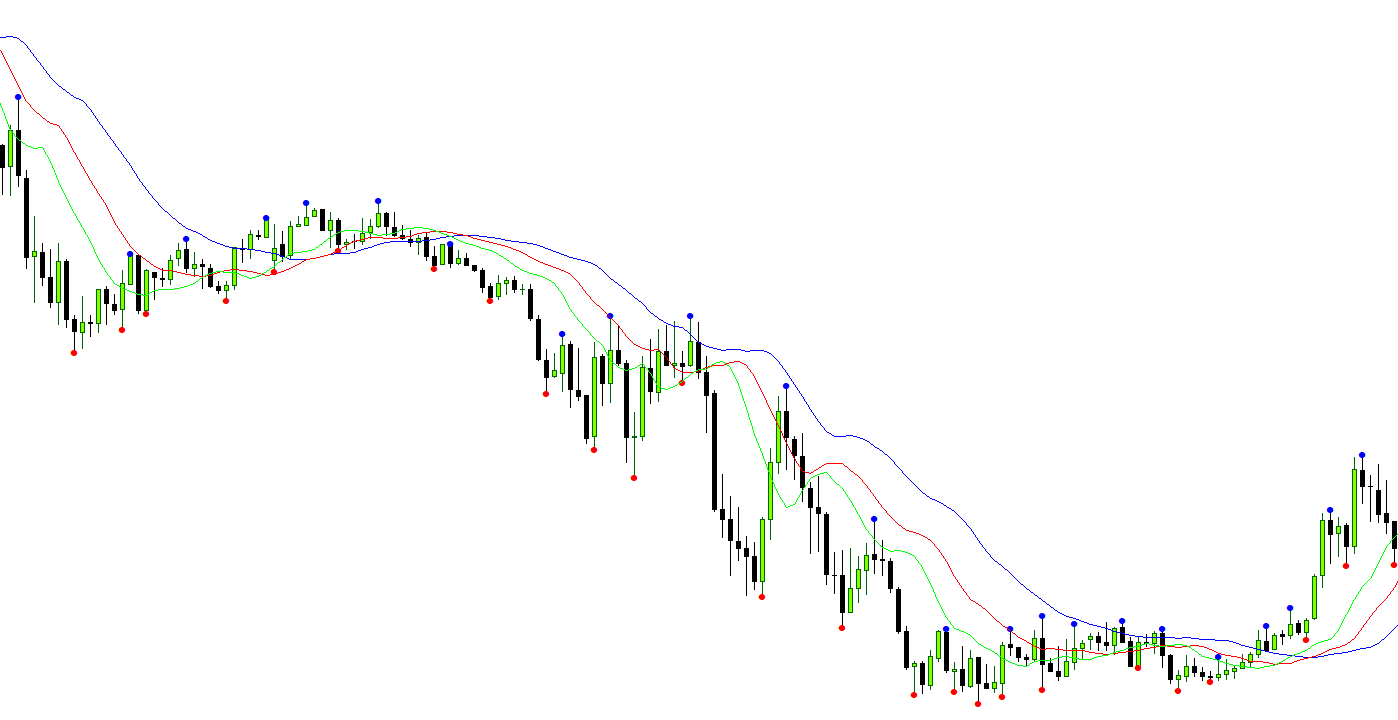
Application of fractal and alligator indicators in one chart
The above chart is transparent, we can clearly see the indicators and price movements. Blue and red dots represent fractals, moving averages are Alligator. In order for the fractal to be determined, a series of 5 consecutive candles is needed:
- The buy signal is indicated by the fractal above the highest high of the swing, with the highest middle candlestick indicating the highest price. Two candles on the left and two on the right show the lower price.
- The sell signal is the fractal below the lowest low with the middle swing candlestick being the lowest price. The other two candles to the left and right of it indicate a higher price.
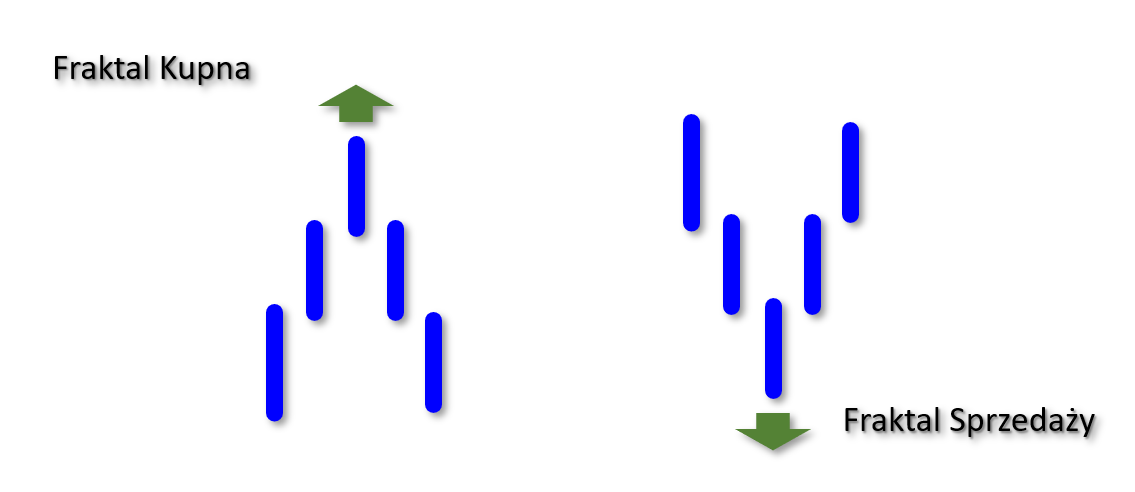
Buying and selling fractal
Since the fractals indicate the points where price was unable to hold and reversed direction, it is logical that when price breaks the old fractal at some point a shift will come with a new force. Setting the position at the point of fractal breakout will be the obvious and easiest use of fractals.
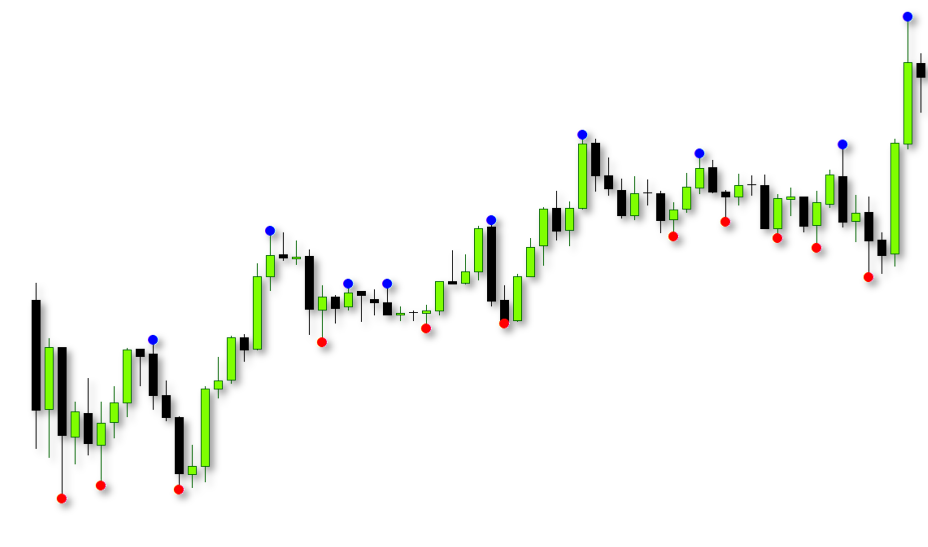
Designated fractals on the chart
Above is an example of designated fractals in a real graph. Blue color means upper fractals, red - lower fractals.
Opening a position on fractals does not require the trader's immediate reaction, which is sometimes delayed. Then traders usually start the so-called "Chase after the price", which usually ends in failure. We open positions waiting a few pips above the highest / lowest price. The position is set on the last fractal.

An example of opening a pending sell position
In the example above, the sale position has been determined. We set the pending position "Sell Stop" a few pips (depending on the time frame) below the last fractal (red dot). We set the stop loss on the level of the opposite fractal (buy fractal). As you can see from the chart, the price slowly starts to fall and our position is opened. In the next candles, the price decline accelerates, which results in an excellent profit.
READ ALSO: Market Structure - a formation that few know about
Fractals should not be used as a single indicator. We need to use an indicator to recognize changes in momentum. As mentioned before - momentum is the key to profit.
Alligator indicator
Another indicator that we will use will be Bill Williams' Alligator. (DOWNLOAD from our forum)
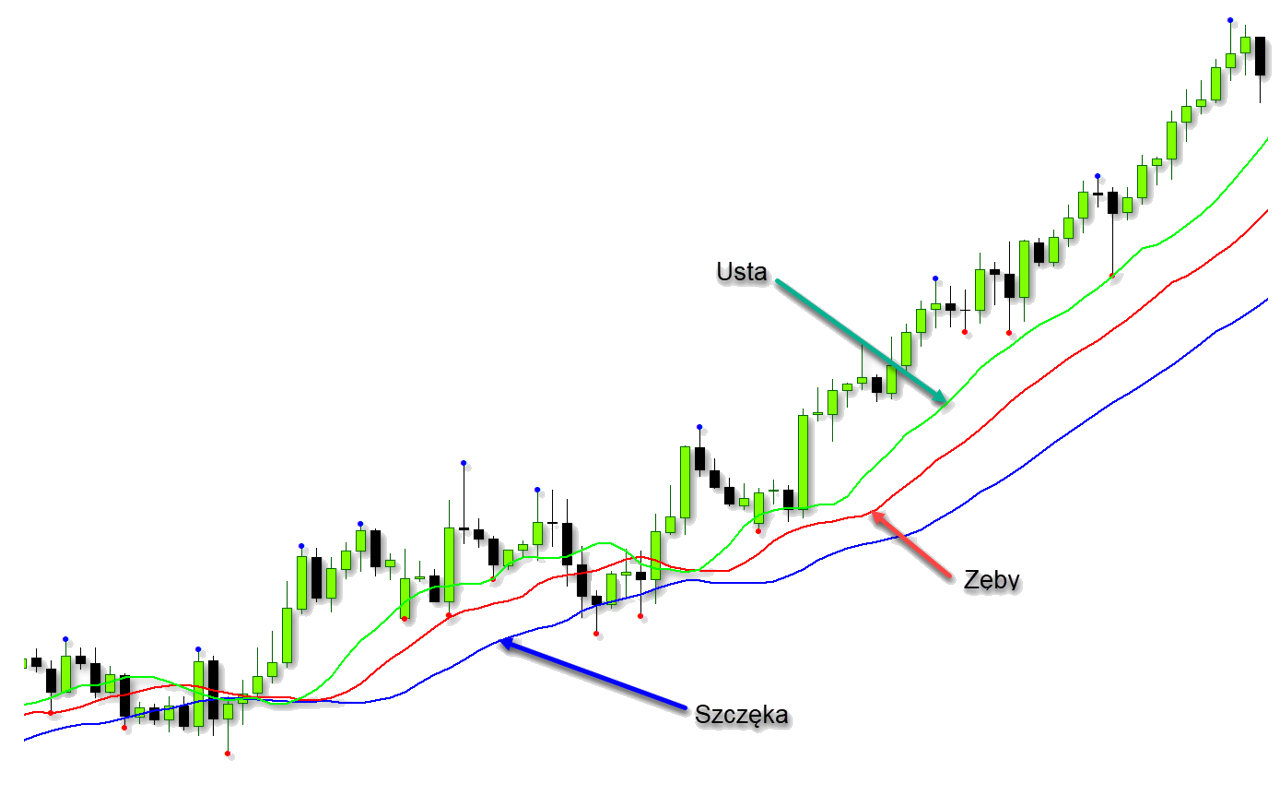
Alligator - lips, jaws, teeth
Bill Williams describes the Alligator indicator as a compass that helps us maintain the correct trading direction. The alligator helps you find the real momentum and stay far from the "edge" of the trend, which is always loss-making.
Alligator is made up of three lines of balance:
- Alligator's jaw (blue line) - 13 intervals, Smoothed Moving Average (SSMA), median on the price (high + low / 2), shifted 8 intervals into the future;
- Alligator's teeth (red line) - 8 intervals, Smoothed Moving Average (SSMA), median on the price (high + low / 2), shifted 5 intervals into the future;
- Alligator's mouth (green line) - 5 intervals, Smoothed Moving Average (SSMA), median on the price (high + low / 2), shifted 3 intervals into the future.
The alligator ratio uses a time frame relationship factor that is approximately 5: 1. If the blue line (jaw) is on the daily chart, the red line (teeth) indicates changes in the hourly chart. When all three lines narrow, it means the alligator is asleep and the price is drifting sideways - within a certain range. The longer the alligator sleeps, the more hungry it becomes. When he wakes up from a long sleep, he is very hungry and is chasing the price very far.
Alligator's dream
While the allligator is asleep, just watch the market and wait for it to awaken. When he wakes up, he opens his mouth (divergence - the divergence of balance lines) and starts hunting. When it is full, it goes back to sleep (convergence - balance line approach), then we collect the profits.
If Alligator is awake, the market is in an uptrend or a downtrend:
- When the price is above the jaw, we observe an uptrend,
- If the price is below the alligator's jaw, it is a downtrend.
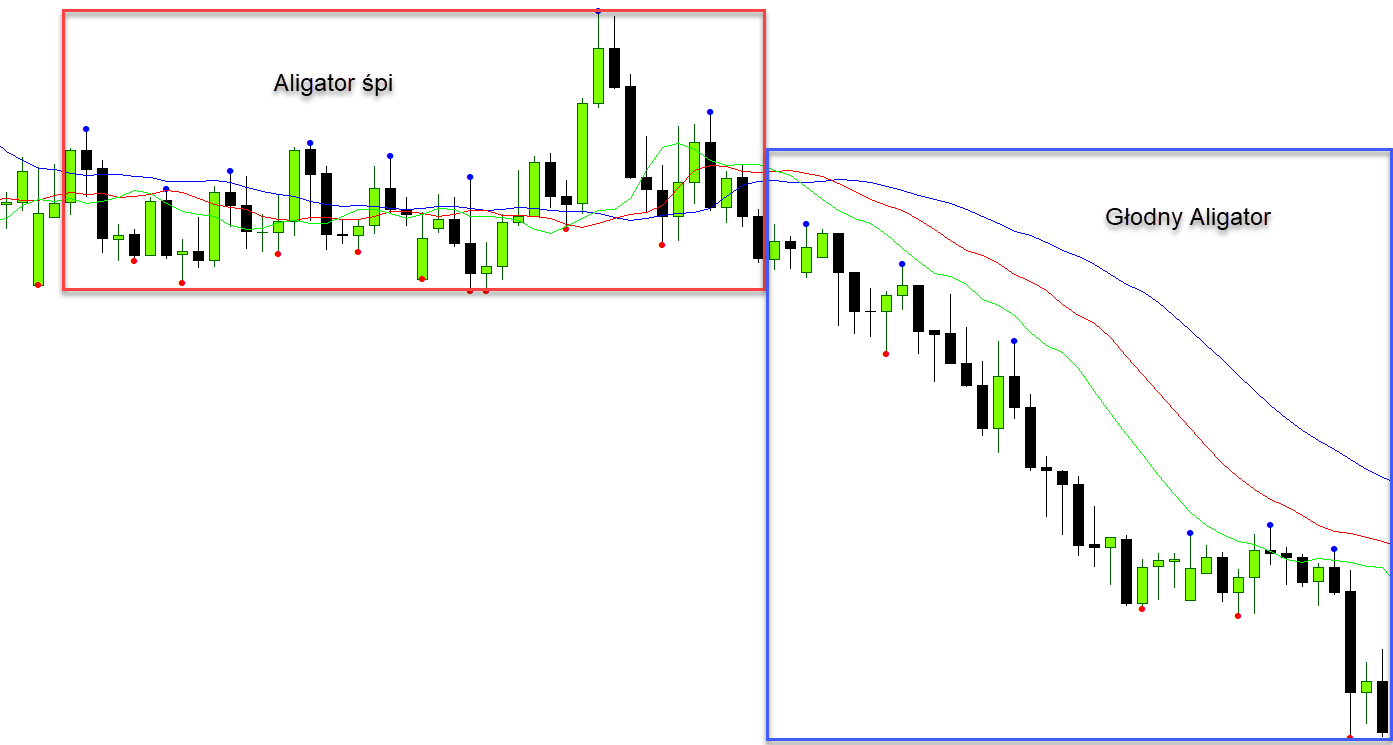
A "sleepy and hungry" alligator
Notice in the graph above how the lines tighten as the alligator sleeps. Upon awakening, the alligator begins to devour the price. The profit is pretty good ...
Fractals and Alligator
Both form an inseparable pair of indicators. In this setting, we do not need additional indicators that will only "clutter" our chart.
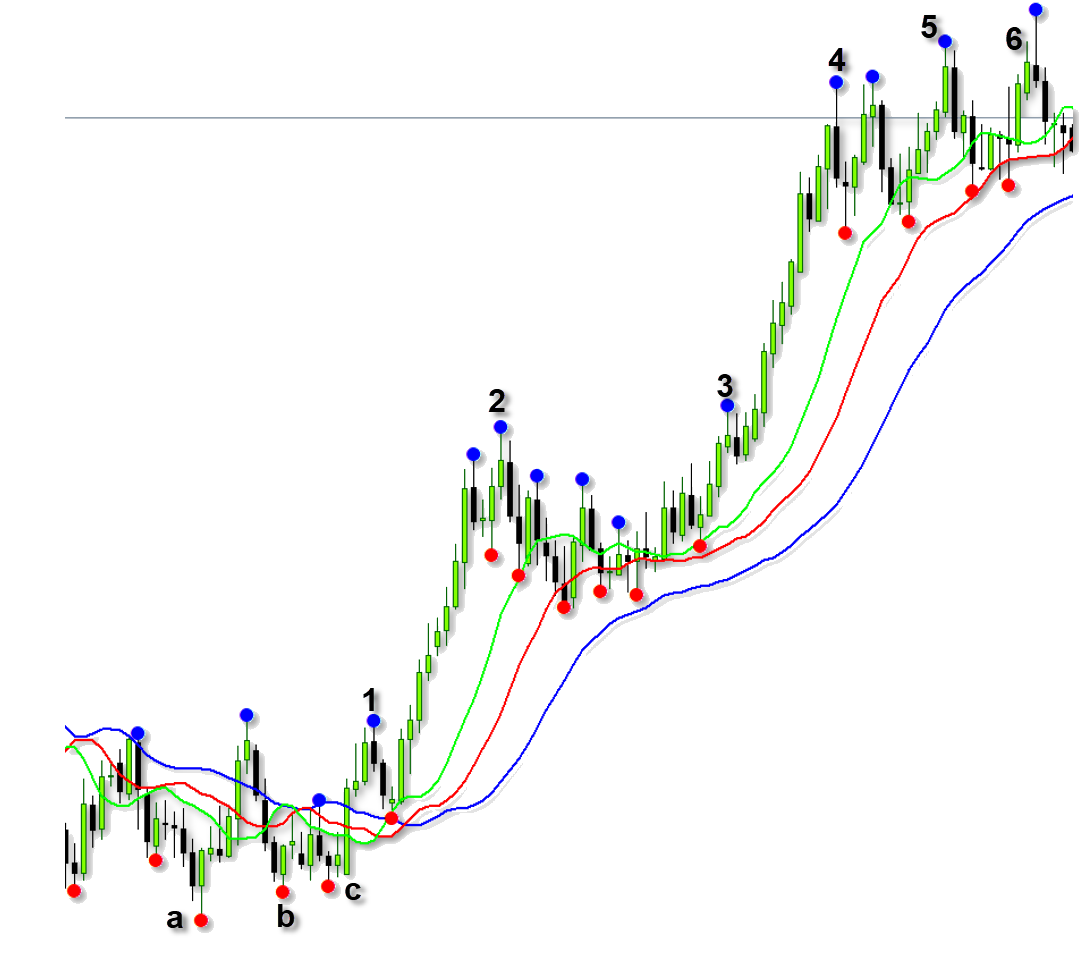
Chart example without additional indicators
As a rule, when the alligator is asleep, we do not trade, we wait for the alligator to wake up. Notice that the next fractals are marked in the chart above. Each subsequent fractal is higher than the previous one. Each of these fractals can be used to open another position. Pending positions will not be enabled until the price breaks the next fractal.
Oil chart, D1 interval
The oil chart above shows us a sharp increase in momentum and hence a sharp rise in price. The first fractal to show above the alligator's jaw gives us a risk-free profit. Each subsequent higher fractal than the previous one is a signal for us to open another position. From the sixth fractal, you can clearly see the alligator getting ready for sleep. The price starts to fall and breaks the tooth line, which is a signal to close the position for us. Opening a pending position above the 7th fractal signifies a continuation of the trend. We can see the momentum increase rapidly with the price.
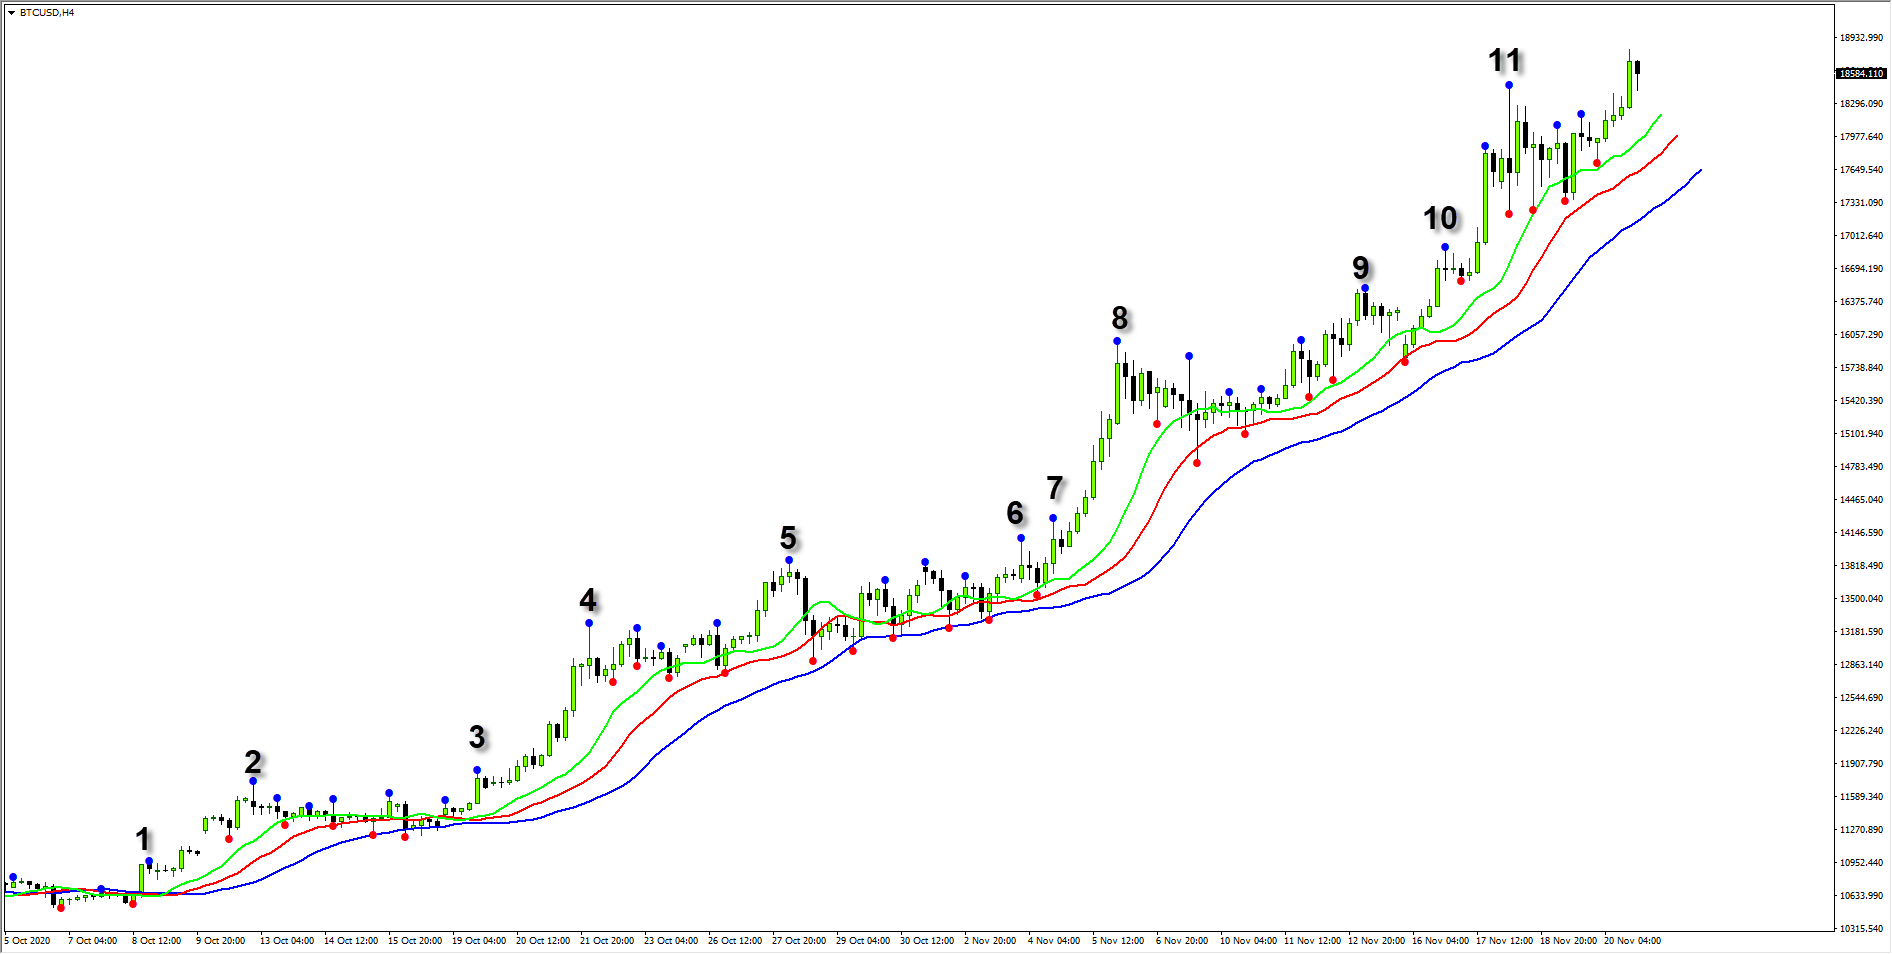
Bitcoin chart, H4 interval
Without any stress, the cascading opening of pending positions leads to huge profit.
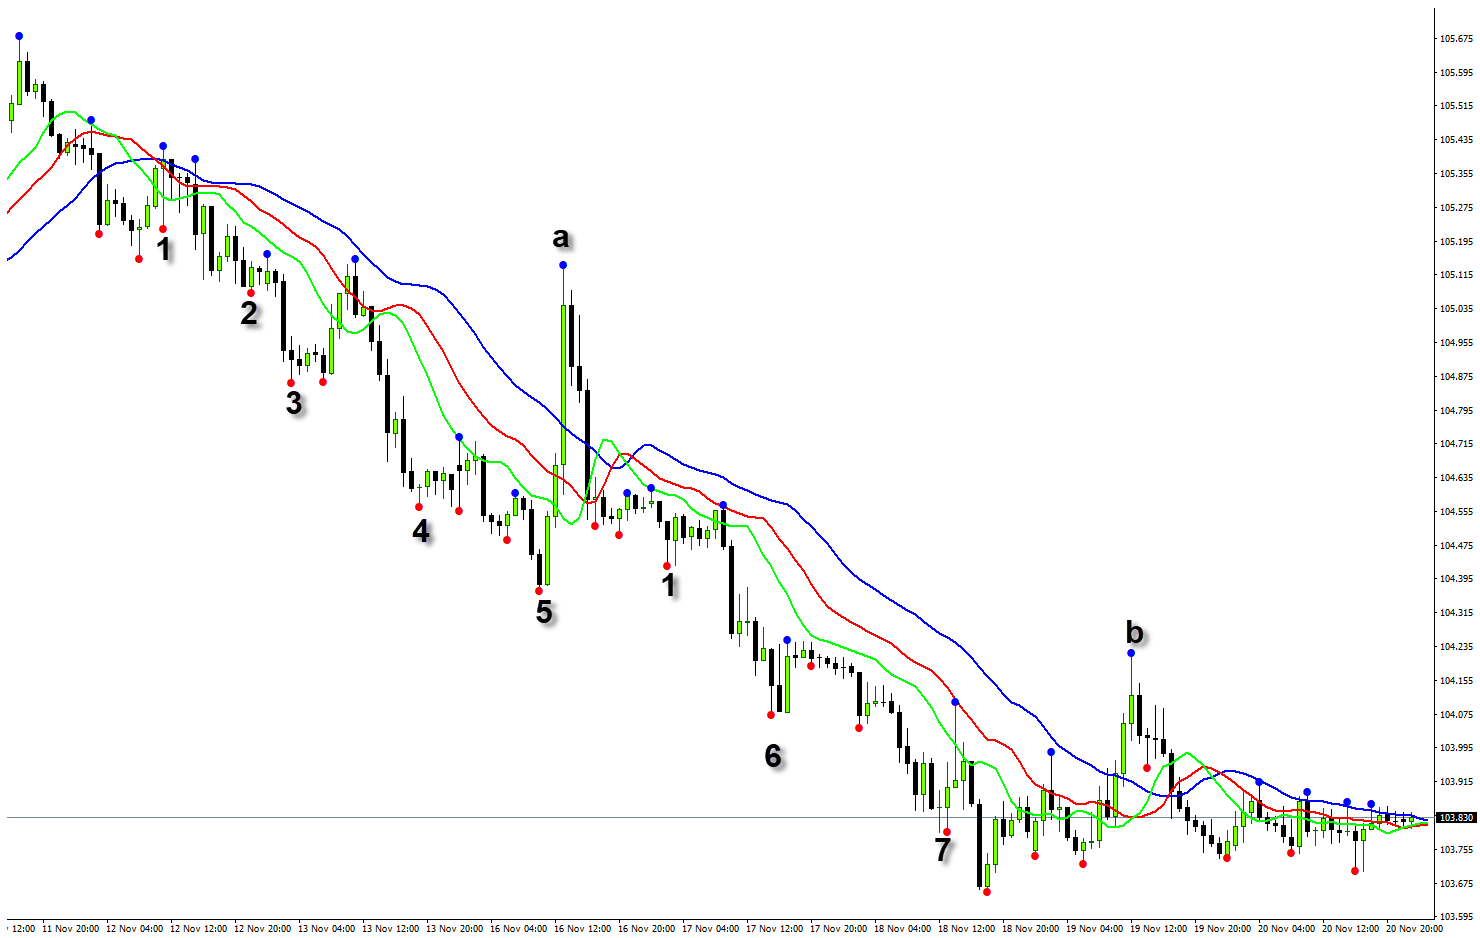
USDJPY chart, H1 interval
Let us analyze the profit from successive signals indicated by fractals.
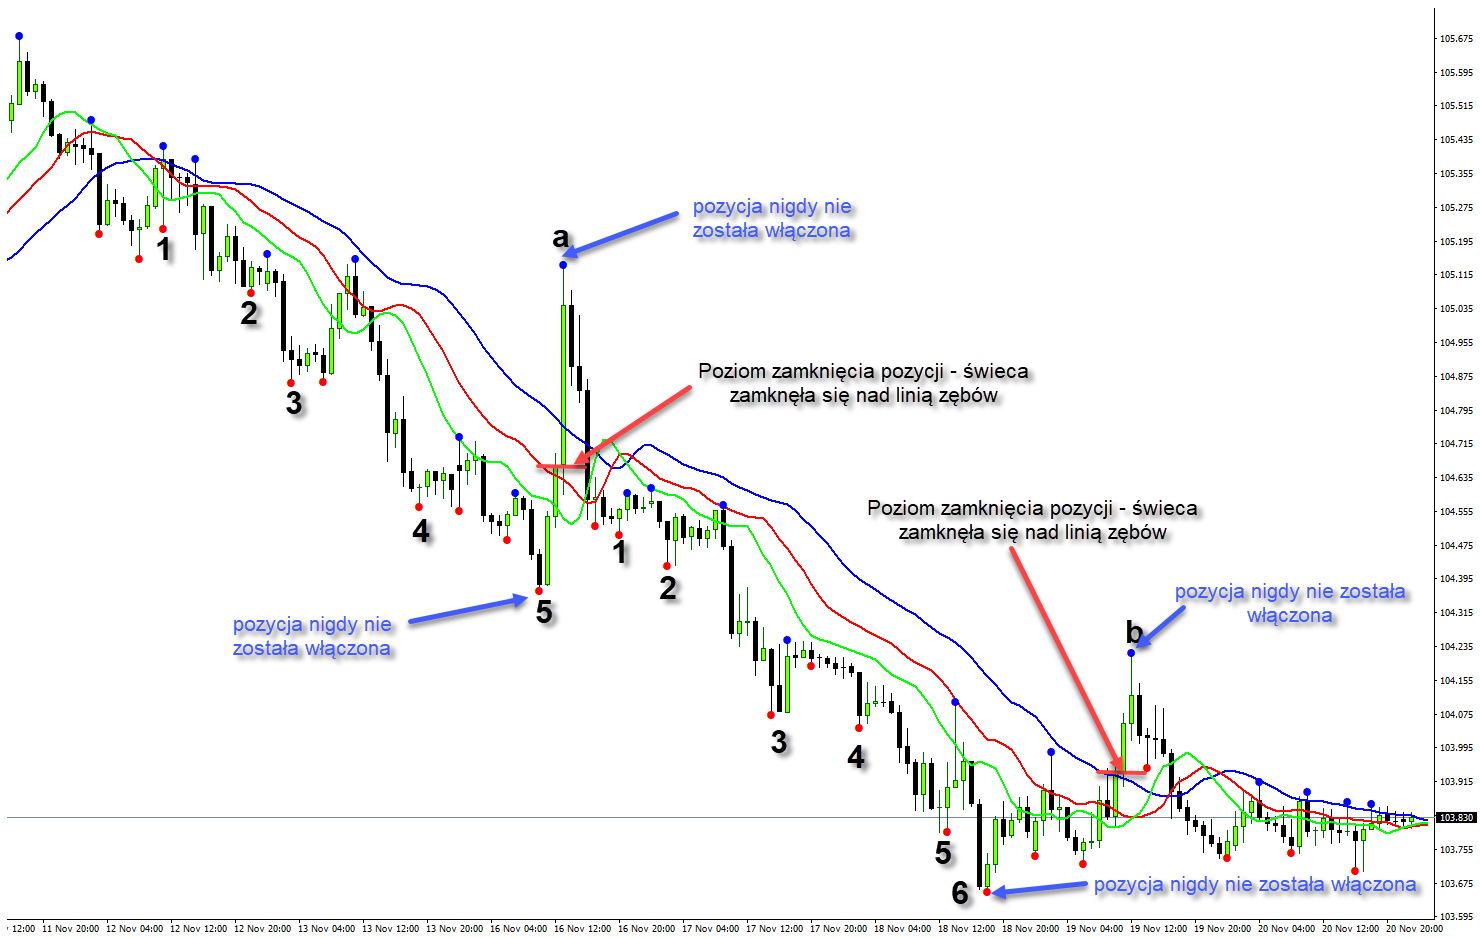
USDJPY chart, H1 interval
The past few days have been profoundly profitable on USDJPY. Here is their analysis from 8 trading days. The position was closed due to the candle closing above the tooth line.
| Openly | Time | Close | Time | Profit in pips | |
|---|---|---|---|---|---|
| 1. | 2020-11-12 | 11:00 | 2020-11-16 | 12:00 | 570 |
| 2. | 2020-11-12 | 22:00 | 2020-11-16 | 12:00 | 400 |
| 3. | 2020-11-13 | 03:00 | 2020-11-16 | 12:00 | 140 |
| 4. | 2020-11-13 | 19:00 | 2020-11-16 | 12:00 | -90 |
| 5. | The item has never been enabled | ||||
| 1 | 2020-11-16 | 20:00 | 2020-11-19 | 10:00 | 625 |
| 2. | 2020-11-17 | 02:00 | 2020-11-19 | 10:00 | 490 |
| 3. | 2020-11-17 | 15:00 | 2020-11-19 | 10:00 | 190 |
| 4. | 2020-11-17 | 02:00 | 2020-11-19 | 10:00 | 108 |
| 5. | 2020-11-18 | 13:00 | 2020-11-19 | 10:00 | -150 |
| 6. | The item has never been enabled | ||||
| Total profit from 2020-11-12 to 2020-19 in pips: | 2333 | ||||
Nice profit using only fractals and an alligator.
Opening and closing a position
Just before the last fractal occurred, the alligator woke up and started hunting bears.

Setting the opening of a pending position together with SL; USDJPY, interval H1
Note how quickly the green lines and then the red lines pierce the blue one - CHANGE OF DIRECTION! Hence, the first fractal, after changing the direction of the momentum, is kicked down. As you can see the SL setting is beyond the small correction range.
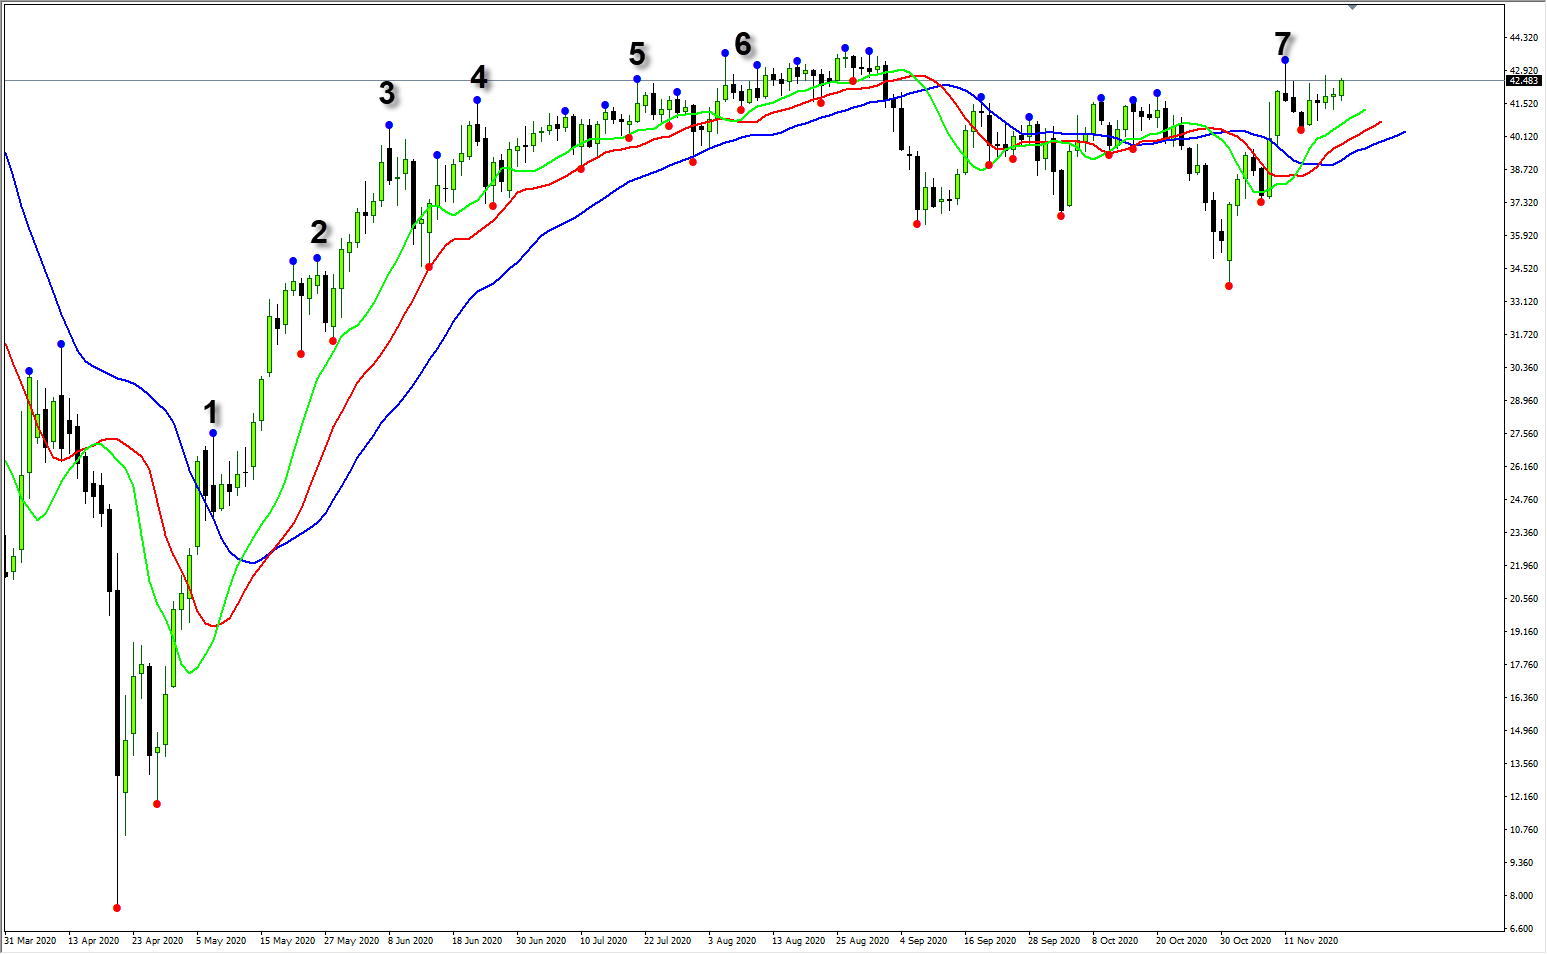
Another example of setting a position on GBPUSD. Here we are going to apply the position set distance from the fractal to 10 pips.
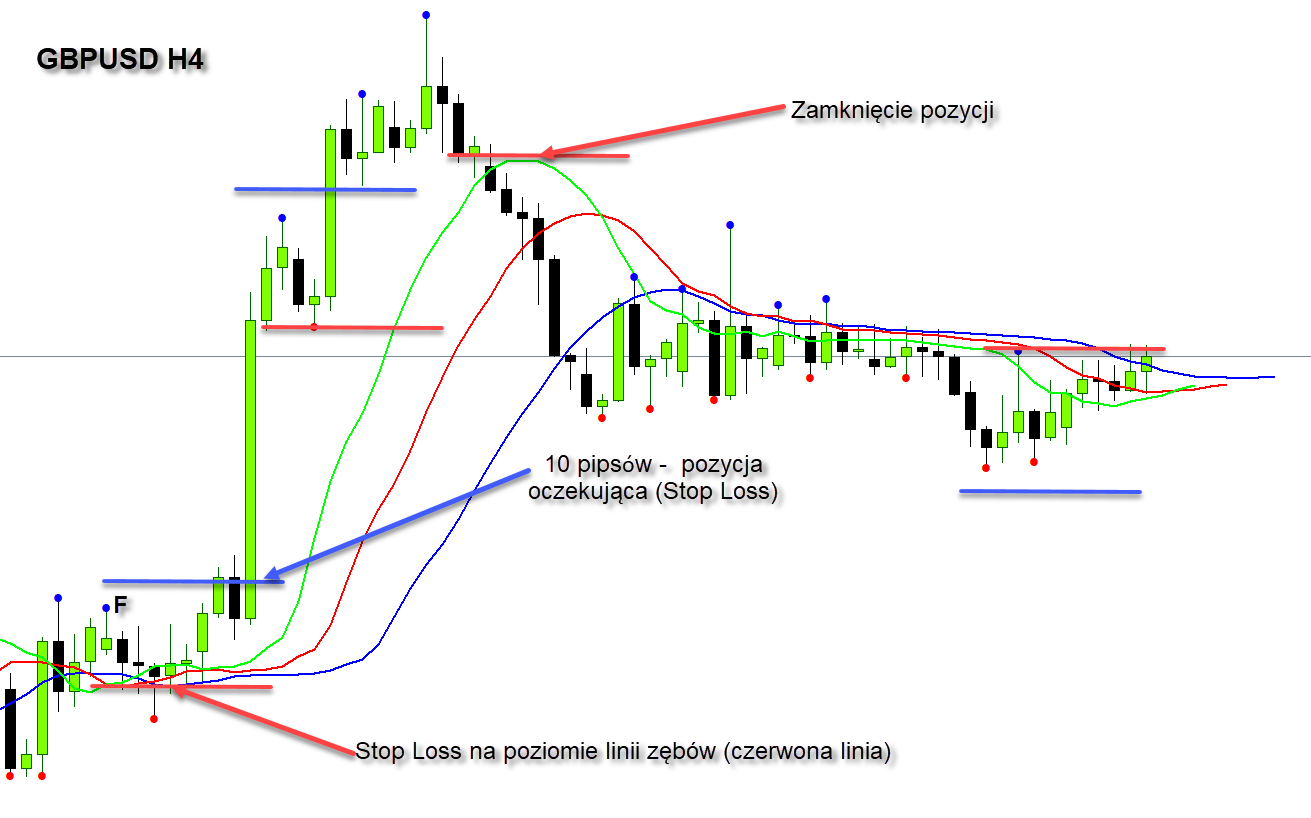
Opening more positions; GBPUSD, H4 chart
- The first position is set on 2020-11-06 at 8:00 and closed on 2020-11-11 at 16:00. The result is +294 pips.
- The second position is set 2020-11-09 at 20:00 and closed on 2020-11-11 at 16:00. The result is +36 pips.
- The third position is set 2020-11-10 at 16:00 and closed on 2020-11-11 at 16:00. The result is +50 pips.
In total, from three positions - 280 pips. Pretty good profit ...
Why didn't we close the tooth line (red line) position this time? This is where the knowledge of candlestick charts bows.
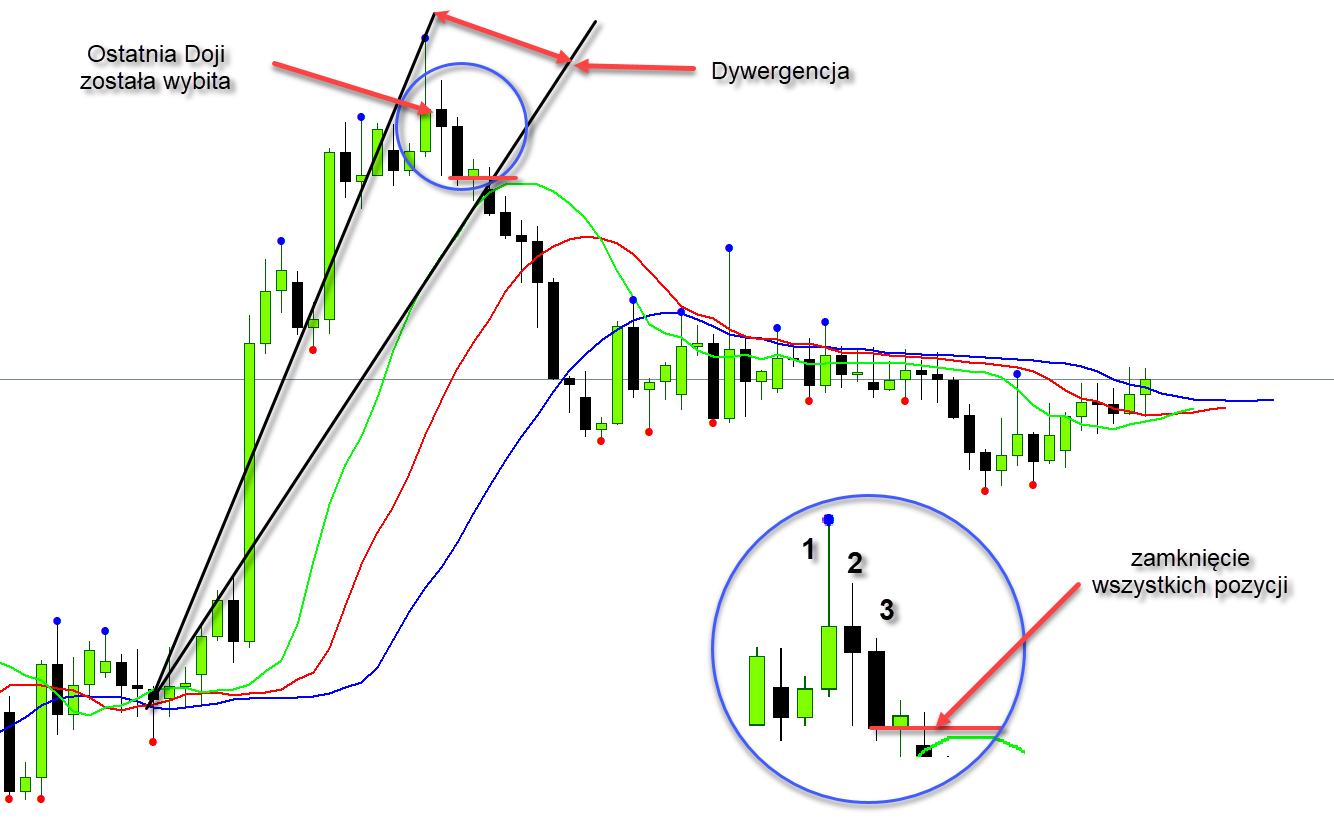
Doji Breakout and Price Divergence; GBPJPY chart, H4 interval
- We have a psychological level of 1.40 where the price must gain momentum for the price to increase further. A green candle with a long upper shadow indicates a weakening in price growth.
- The first green candle points to a very long shadow at the top, the next candle is Doji. At the moment, we do not know if this is a temporary sideways movement of the price. Another long black candle strikes the Doji candle, it is a signal to close all positions immediately!
- Here, too, we are dealing with a price divergence in relation to the green line. A rapid increase in momentum causes a sharp increase in price. Further price increases must stop, as shown in the chart.
SL settings and achieving maximum profit
Our goal is to achieve maximum profit.
- The first indication of the danger of reducing your profit is FIVE SUCCESSIVE Fractals IN THE SAME COLOR. When this occurs, we move the SL a few pips from the highest / lowest price to secure the maximum profit.
- If we are in a market where the price is escaping sharply and the angle of the current price level is greater than the angle on the green line, then we set SL on the green line to secure the maximum profit. In the sales market, we do the opposite.
- If we are in an ongoing trend, we set the SL to the red line, which is the balance line one time frame lower than the one we are working on.


Leave a Response