


How to analyze a REIT? Avoid known indicators - net profit, FCF

Although many REITs are listed on the stock exchange, they are valued differently from "ordinary" companies. Standard valuation measures such as Price / Earnings and Earnings per Share (EPS) are not a good measure of the value of a REIT. This is due to the specific nature of the companies' operations.
Be sure to read: What is a REIT and how to invest in it? [Guide]
In REITs, a large portion of costs is depreciation of buildings (depreciation), which varies depending on the building. For Douglas Emmett (REIT with offices and apartments), buildings are depreciated over 40 years. Unlike production equipment, many investment buildings can increase in value, not lose. Depreciation of such buildings blurs the REIT's true ability to create value (reduces net profit) and diminishes the true value of the assets.
Another measure that does not always work for REITs is free cash flow (FCF). The simplified formula for FCF (free cash flow) looks like this:
FCF = Operating Cash Flow - Capital Expenditure (CAPEX)
FCF does not work for developing companies that invest in development (e.g. construction of another office building), because they increase capital expenditure (CAPEX). An example of such a REIT is equinixwho must invest in new data centers to increase revenues. This causes an increase in capital expenditure and a decline in FCF.
| equinix | 2017 | 2018 | 2019 |
| net profit | 232,9 | 365,4 | 507,2 |
| operating cash flows (OCF) | 1439,2 | 1815,4 | 1992,7 |
| investment expenses | 1378,7 | 2096,2 | 2079,5 |
| FCF | 60,5 | -280,8 | -86,8 |
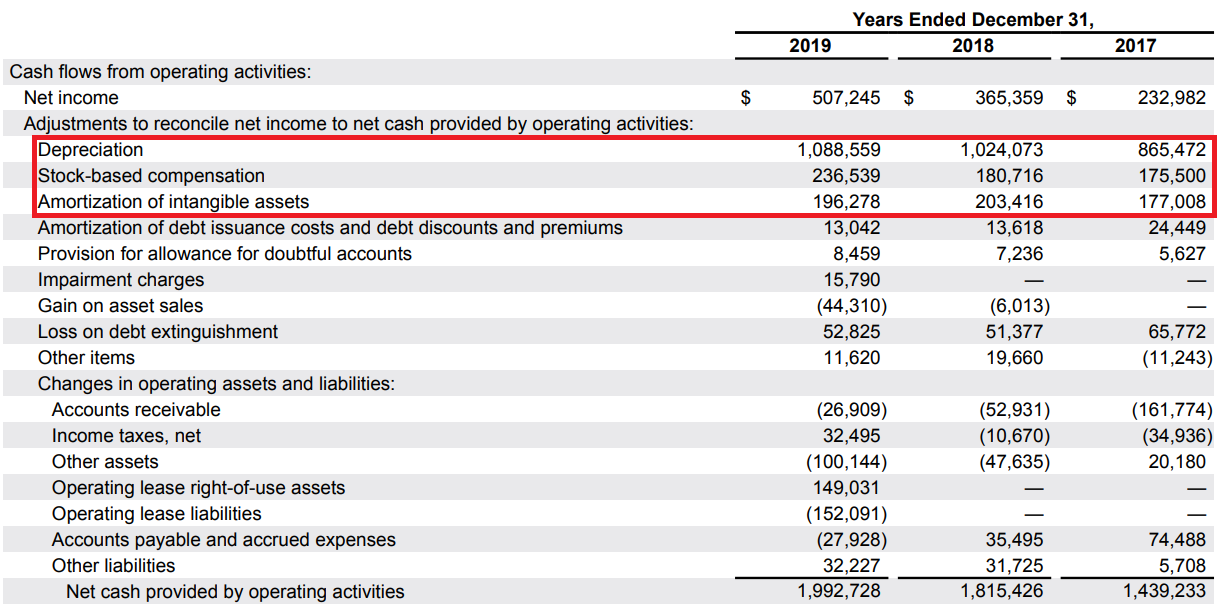
The several-fold difference between the net profit and cash flows from operating activities (OCF) results, among others, from:
- large share of depreciation (amortization and depreciation) in the company's costs. Depreciation of equipment and buildings is not a cash cost, but an accounting record of asset impairment over time.
- Stock-based compensation, i.e. accounting costs that were paid for by the share issue. This is, for example, the payment of shares of a part of employees' salaries. In the income statement, they are a component of R&D expenses, sales teams and management costs.
FFO - the basic measure for REIT valuation
FFO stands for Funds From Operations. FFO is standardized by National Association of Real Estate Investment Trusts (NAREIT). Funds from Operations it roughly determines how much cash is generated from the company's operating activities without incurring capital expenditure. It is calculated according to the following formula:
FFO = net profit + depreciation attributable to the property + losses on the sale of the property - profit on the sale of the property +/- other one-off events
- other one-off events These include, among others, losses and gains from changes in control over real estate, write-offs on real estate and minority investments.
- the result on the property sold is deducted from net profit as it is a one-off event.
- value deduction property depreciation aims to demonstrate the true cash-generating capacity of a REIT. The main non-cash cost has been deducted.
The investor does not have to calculate the FFO himself. Each company listed in the United States must calculate the FFO in its report to the SEC (the American equivalent of the KNF). The following calculations presented by Equinix in the financial statements for 2019:

Below is a comparison of FFO with FCF and cash flows from operating activities:
| Equinix (based on the financial statements) | 2017 | 2018 | 2019 |
| cash flows from operating activities | 1439,2 | 1815,4 | 1992,7 |
| investment expenses | 1378,7 | 2096,2 | 2079,5 |
| FCF | 60,5 | -280,8 | -86,8 |
| FFO | 992,4 | 1253,1 | 1314,5 |
| FFO as% of cash flows from operating activities | 68,95% | 69,02% | 65,96% |
Advantages:
- The FFO is a better measure of a REIT's cash generating capacity than the net profit and the FCF
- It does not include property depreciation in its cost, which is accounting, not cash
- Deducts from the result the impact of one-off events (sale of real estate)
- FFO is calculated according to one standard defined by NAREIT
- High investment CAPEX has no impact on the ratio
Disadvantages:
- assumes that the company has no maintenance expenses, which distorts the image of the REIT
- is based on accounting measures (possibility of manipulation)
- part of non-cash costs (SBC) are treated as cash costs
AFFO - "purified FFO"
The second indicator used in REIT valuation is AFFO, ie (Adjusted Funds from Operation) it is a “cleaned” FFO indicator. Each company calculates its AFFO ratios, which they believe better reflect the company's cash-generating potential. Due to different measures, you should always look at how the company calculates the AFFO. The standard is to subtract maintenance expenses (recurring capital expenditures) from the FFO. Sometimes companies add stock-based compensation to the FFO. AFFO can be compared to a substitute for FCF after excluding the necessary capital expenditure. Below the AFFO as calculated by Equinix:
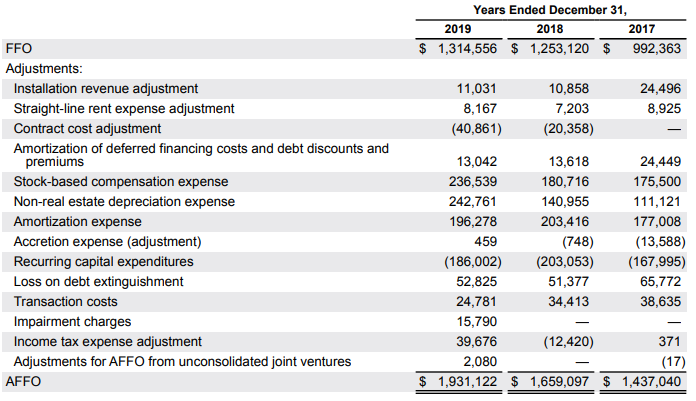
In the case of Equinix, FFO has been added to, among others, depreciation (e.g. non-real estate fixed assets), restructuring costs, transaction costs and costs paid with shares.
Below is a comparison of FCF calculated as OCF less maintenance expenses and its comparison to AFFO.
| Equinix (based on the financial statements) | 2017 | 2018 | 2019 |
| cash flows from operating activities | 1439,2 | 1815,4 | 1992,7 |
| maintenance expenses | 168 | 203 | 186 |
| FCF (cleaned) | 1271,2 | 1612,4 | 1806,7 |
| FFO | 992,4 | 1253,1 | 1314,5 |
| AFFO | 1437 | 1659,1 | 1931,1 |
| AFFO as% FCF | 113,04% | 102,89% | 106,88% |
AFFO shows that if "at this point" the company stops growing, it will generate free cash similar to AFFO. However, the AFFO-based valuation should take into account the dilution of the current shareholding (Stock-based compensation increases the number of shares).
Ability to pay dividends
As REITs are dividend companies, the ability of the companies to pay dividends from the cash generated needs to be assessed. The market standard is to use a payout ratio in which the dividend paid by the FFO or AFFO is divided. Below is an example for Equinix.
Payout ratio from FFO
| Equinix (based on the financial statements) | 2017 | 2018 | 2019 |
| Dividend | 621,5 | 738,6 | 836,2 |
| FFO | 992,4 | 1253,1 | 1314,5 |
| payout ratio | 62,6% | 58,9% | 63,6% |
Payout ratio from AFFO
| Equinix (based on the financial statements) | 2017 | 2018 | 2019 |
| Dividend | 621,5 | 738,6 | 836,2 |
| AFFO | 1437 | 1659,1 | 1931,1 |
| payout ratio | 43,2% | 44,51% | 43,3% |
The lower the ratio, the greater the security of continuing the dividend payment at a similar level.
Debt service capacity
Net debt / EBITDA
A significant amount of cash generated is usually spent on dividends. REITs raise capital for investments by issuing shares and use debt. Debt issues increase leverage, which increases investment risk. For this reason, you need to determine the company's ability to service its debt. The most frequently used ratio is net debt to EBITDA.
EBITDA in a simplified form is the operating profit increased by depreciation.
| Equinix (based on the financial statements) | 2017 | 2018 | 2019 |
| EBITDA | 1837,9 | 2204,1 | 2454,9 |
| interest debt (without leasing) | 8381,5 | 9813,6 | 10319,9 |
| cash and equivalents | 1412,5 | 606,2 | 1869,6 |
| net debt | 16969 | 9207,4 | 8450,3 |
| net debt / EBITDA | 3,79 | 4,18 | 3,44 |
The lower the ratio, the greater the company's ability to service its debt. Additionally, the low ratio provides the company with a "buffer" for development without the need to issue shares.
Interest coverage ratio
EBITDA / interest expense
There are many ways to calculate it, but NAREIT uses the following formula for many of its calculations: interest coverage ratio = EBITDA / interest expense.
Below are the details of Equinix:
| Equinix (based on the financial statements) | 2017 | 2018 | 2019 |
| EBITDA | 1837,9 | 2204,1 | 2454,9 |
| interest costs | 392,2 | 478,7 | 521,5 |
| Interest coverage ratio | 4,69 | 4,60 | 4,71 |
It is often assumed that a ratio above 3,0 indicates the company's debt service capacity. The higher the interest coverage ratio, the safer the company's financial situation.
What indicators are used in REIT valuation?
The FFO and AFFO values mentioned earlier in the article are the basis for estimating the company's value. The three main methods for valuing REITs are:
- P / FFO - company capitalization divided by FFO
- P / AFFO - company capitalization divided by AFFO
- NAV (net asset value) - this is the most laborious valuation method. You need to market your assets (mainly real estate) and deduct liabilities.


