


How to invest in dividend companies - stocks and ETFs [Guide]

Investing in dividend companies has many stages. Some investors focus on the amount of the dividend in relation to the current share price (the so-called dividend yield - dividend yield). Others focus on choosing dividend companies with a stable business model and a low payment ratio (the amount of dividend paid to the company's net profits). A separate group of investors are those who focus on investing in companies with increasing dividends. As a rule, the dividend paid increases both in nominal value and in terms of the DPS (dividend per share) ratio.
These types of companies are generally mature enterprises that generate large amounts of FCF (free cash flow) and cannot reinvest them in the business at a decent ROIC rate. As a result, they share the excess cash with their shareholders. For a long-term investor, such companies are an interesting investment idea. To illustrate, let's take an example: An investor purchased 100 shares of ABC for $ 100 apiece. The company paid out $ 3 per share (DPS) in dividends in the first year and increased its dividends per share by 5% per annum. This is what the payment table will look like in the coming years. The longer the period of dividend increase lasts, the stronger the compound interest effect.
| 1 year | 2 year | 3 year | 4 year | 5 year | 20 year | |
| DPS (dividend per share) | 3$ | 3,15$ | 3,31$ | 3,47$ | 3,65$ | 7,58$ |
| dividend rate at the purchase price | 3% | Present in several = 3,15% | Present in several = 3,31% | Present in several = 3,47% | Present in several = 3,65% | Present in several = 7,58% |
How to invest in dividend companies
Companies that regularly increase the level of dividends per share (DPS) for at least 25 years are called Dividend Aristocrats. On the other hand, companies that have been able to raise dividends for at least 50 years are called Dividend Kings. In order for the investor not to have to choose which companies are best for his portfolio, the solution is to use the ETF offer. An example of such a solution is iShares Core Dividend Growth ETFwhich gives exposure to US dividend companies.
iShares Core Dividend Growth ETF
iShares Core Dividend Growth ETF was founded in mid-2014. As of May 11, the ETF had assets under management of $ 22,3 billion. So it is an ETF that is quite popular with investors. It is worth mentioning that the costs of this ETF are very small and amount to 0,08% per year. The fund's benchmark is the Morningstar US Dividend Growth Index. To understand why specific companies are included in the fund's portfolio, you need to look more closely at the methodology of selecting companies for the index.
Morningstar US Dividend Growth Index
The index is owned by Morningstar, a company listed on the US stock exchange. The index itself was created in April 2014 and has historical data since 2003.
The index gives exposure to US companies with a history of sustained dividend growth. The index is based on the Morningstar US Market Index, which represents approximately 97% of the US stock market (in terms of capitalization). In order for a company to join the Morningstar US Dividend Growth Index, it must:
- pay dividends,
- have a history of at least 5 years of continuous dividend increase (year on year),
- have a significant buffer to continue paying higher dividends.
The last point means that in addition to the dividend history itself, the company's ability to further increase the amount of dividend paid is examined. The index uses the payout ratio as a filter. It must be no more than 75%. This means that the amount of dividend paid cannot exceed 75% profit nthe etto of the enterprise.
Moreover, the index does not include the companies that have the best chance of reducing dividends. For this reason, companies with the highest dividend yield (DY) are excluded from the index. The exclusion concerns 10% of companies with the highest dividend yield. DY is the result of dividend paid out by the company's capitalization. The larger the dividend relative to capitalization, the higher the dividend yield (dividend yield).
The index also bets on diversification. For this reason, none of the index components can have a weight greater than 3% (after periodic index reconstruction). This is to prevent the index from becoming too concentrated. Changes in the composition of the index are made once a year (December). In turn, adjustments to the shares of the index components are made four times a year (March, June, September, December).
Below is a list of the top 10 components of the index (as of May 12, 2022):
- Johnson & Johnson - 3,01%,
- Pfizer - 2,89%,
- Microsoft - 2,76%,
- Procter & Gamble - 2,67%,
- Apple - 2,58%,
- JP Morgan Chase - 2,55%,
- Merck - 2,53%,
- Coca-Cola - 2,22%,
- Broadcom - 2,01%,
- PepsiCo - 2,00%.
Selected dividend companies
Johnson & Johnson (JNJ)
It is a company that dates back to 1886. Currently, the company produces and sells medical equipment, pharmaceuticals and consumer products. It is one of the components of some of the most famous indexes in the world: S & P 500 and Dow Jones Industrial Average 30. It is also one of the few companies that has maintained its rating at the highest level (AAA). Johnson & Johnson has operations in 60 countries with 141 employees. JNJ sells its products to over 700 countries. The company operates in three segments: "Consumer Health", "Pharmaceutical" and "Medical Devices". The Consumer Health segment includes care products used by consumers. Among the brands owned by Johnson & Johnson are Johnson's or Listerine. In addition, this segment also includes products to help you quit smoking (Nicorette) or dressings (BAND AID). In 2021, this segment accounted for $ 14,6 billion in sales. There is a broad portfolio of drugs in the Pharmaceutical segment. Johnson & Johnson focuses on the oncology, immunology, and treatment of infections (e.g. COVID-19, AIDS), cardiac and metabolic drugs. In 2021, this segment's revenue amounted to $ 52,1 billion. For "Medical Devices" JNJ sells medical devices helpful in orthopedics (DePuy Synthes brand) or general surgery (Ethicon). The segment's revenue for the past year was $ 27,1 billion. In November 2021, the company announced that it intends to spin off the Consumer Health business.
| $ million | 2018 | 2019 | 2020 | 2021 |
| revenues | 81 581 | 82 059 | 82 584 | 93 775 |
| operational profit | 21 175 | 20 970 | 19 914 | 24 547 |
| operating margin | Present in several = 25,96% | Present in several = 25,55% | Present in several = 24,11% | Present in several = 26,18% |
| net profit | 15 297 | 15 119 | 14 714 | 20 878 |
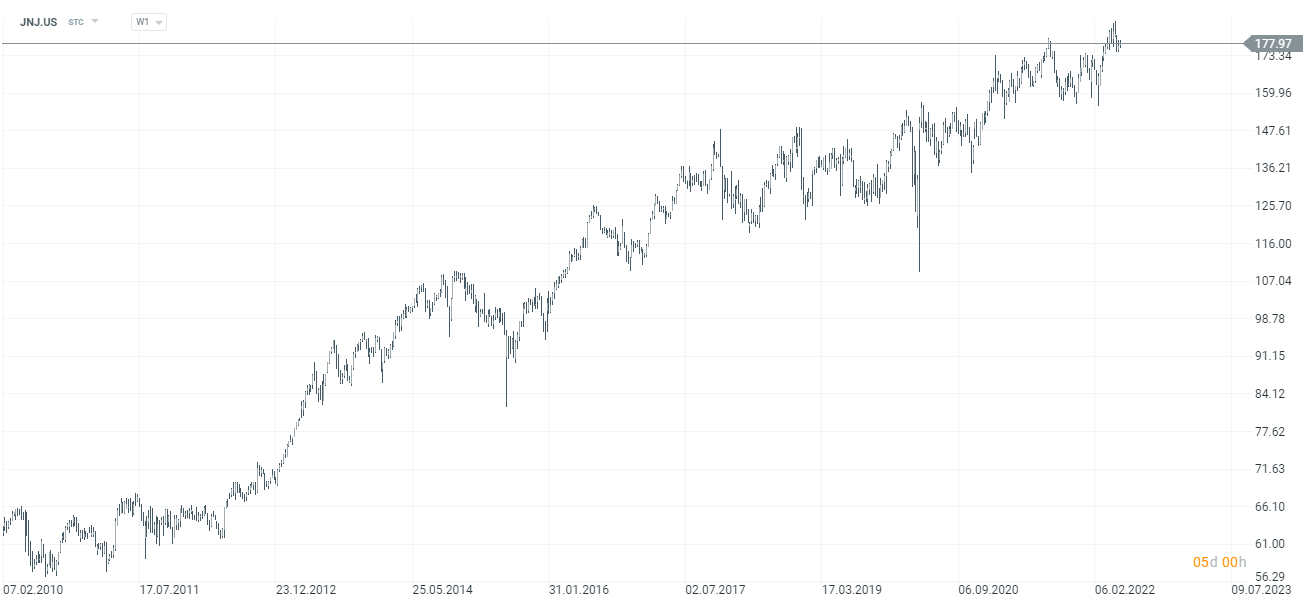
Johnson & Johnson chart, interval W1. Source: xNUMX XTB.
Microsoft
The company was founded in 1975 by Bill Gates. Over time, the company has become synonymous with the operating system for personal computers. At the end of fiscal 2021, the company had 181 employees, 000 of whom were in the US alone. Microsoft it has undergone a transformation in recent years. From a boring company focused on cutting coupons from past successes, Microsoft has become one of the leading players in the cloud market. The company currently operates in three segments: Productivity and Business Processes, IntelligentCloud, More Personal Computing. The Productivity and Business Progress segment focuses on the company's most famous products related to office work and communication (incl. Office 365, LinkedIn, Outlook, OneDrive, Skype, Dynamics). The aforementioned segment generated revenues of $ 2021 billion in 53,9 (+ 16% y / y). The cloud segment generates the highest revenues. The Microsoft product belongs to the Big Three of this market (excluding China). In 2021, Intelligent Cloud achieved sales of $ 60 billion (+ 24% y / y). This segment includes products such as Azure, SQL Server, Windows Server, GitHub and Visual Studio. More Personal Computing is an equally important segment. In 2021, sales of this segment generated revenues of $ 54 billion (+ 12% y / y). This segment can be characterized as "rest of the activity". The index includes the Windows operating system, Surface brand products (laptops), accessories and Xbox as well as the Xbox Game Pass subscription.
| $ million | 2018FY | 2019FY | 2020FY | 2021FY |
| revenues | 110 360 | 125 843 | 143 015 | 168 088 |
| operational profit | 35 058 | 42 959 | 52 959 | 69 916 |
| operating margin | Present in several = 31,77% | Present in several = 34,14% | Present in several = 37,03% | Present in several = 41,59% |
| net profit | 16 571 | 39 240 | 44 281 | 61 271 |
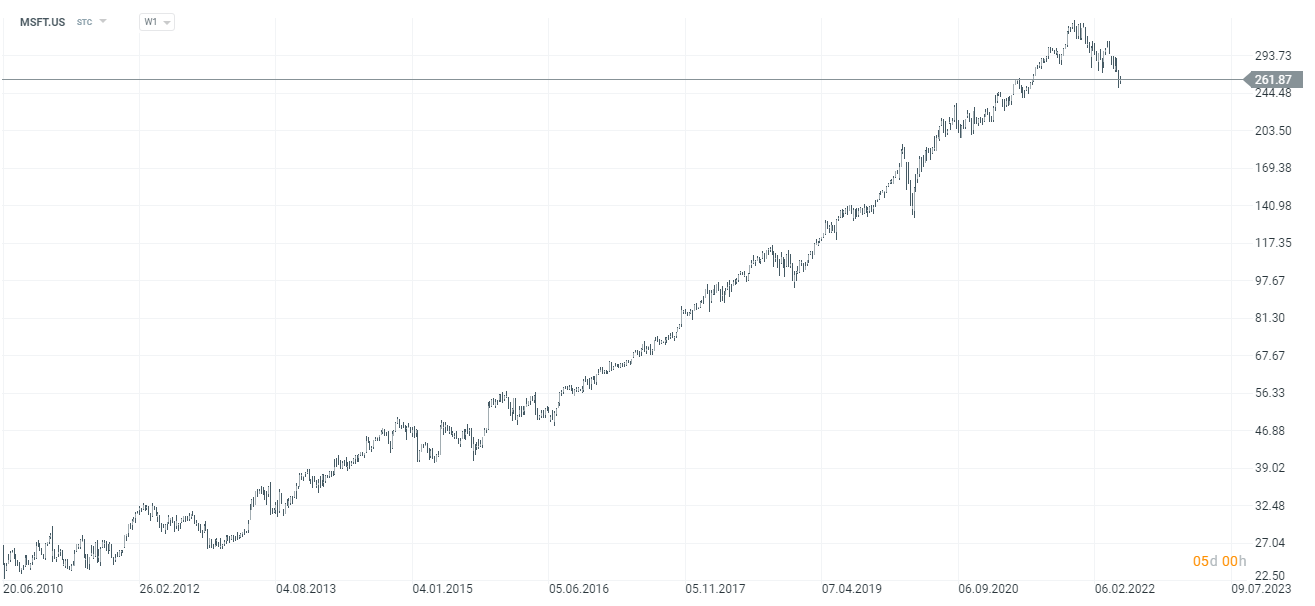
Microsoft chart, interval W1. Source: xNUMX XTB.
Procter & Gamble
It is a company that dates back to 1837. It was then that William Procter and James Gamble founded a soap factory in Cincinnati, Ohio. Over the years, it has expanded its product portfolio. As a result, it is currently one of the largest companies offering fast moving consumer products (FMCG). It is worth mentioning that a dozen or so years ago, the company also offered snacks (including Pringles chips). The crisp brand itself was acquired by Kellogg's for approximately $ 2,7 billion. Procter & Gamble sells its products in over 180 countries around the world. The company has geographically diversified operating activities. This allows P&G to manage the supply chain more efficiently.. At the end of 2021, P&G was active in 70 countries. The company's products are sold via online (e-commerce) and traditional channels (supermarkets, local stores, pharmacies, distributors, wholesalers). The most important recipient of the company's products is Walmart Inc., which is responsible for approximately 15% of P&G sales. Procter & Gamble's 10 largest clients generated 39% of revenues in 2021. The brands belonging to the company include: Pampers, Oral-B, Always, Head & Shoulders, Braun, Gillette, Old Spice and Mr. Clean. The most important segment of the company is Fabric & Home Care (including Ariel powder, Mr. Clean cleaners), which generated 34% of revenues in the last year. The second largest is Baby, Feminine & Family Care (including Pampers, Always, Tampax), which is responsible for a quarter of revenues.
| $ million | 2018FY | 2019FY | 2020FY | 2021FY |
| revenues | 66 832 | 67 684 | 70 950 | 76 118 |
| operational profit | 13 711 | 13 832 | 15 706 | 17 986 |
| operating margin | Present in several = 20,52% | Present in several = 20,44% | Present in several = 22,14% | Present in several = 23,63% |
| net profit | 9 750 | 3 634 | 12 764 | 14 035 |
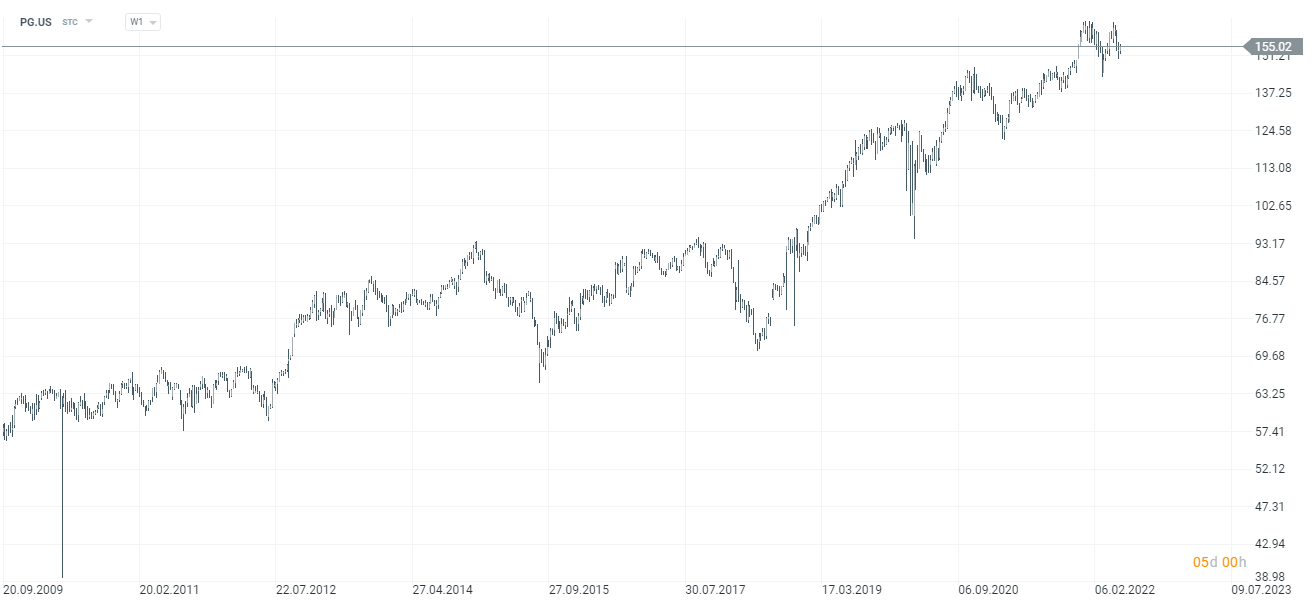
Protect & Gamble chart, interval W1. Source: xNUMX XTB.
Apple Lossless Audio CODEC (ALAC),
The company - a symbol that has had its ups and downs in its history on the stock exchange. The former president of the company has become an icon - Steve Jobs. Apple Lossless Audio CODEC (ALAC), became famous thanks to its iconic products, such as a personal computer - Macintosh (now Mac), iPhone, iPod, iPad and smart watch. The development of products and services requires a lot of employment. At the end of the 2021 financial year, the company employed over 154 people. What the company has managed to do is create a community of fans that it manages to monetize. Of course, Apple is not only physical products, but also services, which are already an important segment of the company's operations. Apple services include, among others fees charged on the App Store, Apple Card and Apple Pay payment solutions. The services also include fees generated by Apple Music or Apple TV. The key product for the company is the iPhone. In 000, the company generated 2021% of total revenues ($ 52,5 billion) on the sale of products under this brand. The next largest segment is services, which reached the level of $ 191,97 billion (+ 60,43% y / y). Despite the fact that Apple's products and services are known all over the world, 27% of revenues came from North and South America (most of the turnover comes from the United States).
| $ million | 2018FY | 2019FY | 2020FY | 2021FY |
| revenues | 265 595 | 260 174 | 274 515 | 365 817 |
| operational profit | 70 898 | 63 930 | 66 288 | 108 949 |
| operating margin | Present in several = 26,69% | Present in several = 24,57% | Present in several = 24,15% | Present in several = 29,78% |
| net profit | 59 531 | 55 256 | 57 411 | 94 680 |
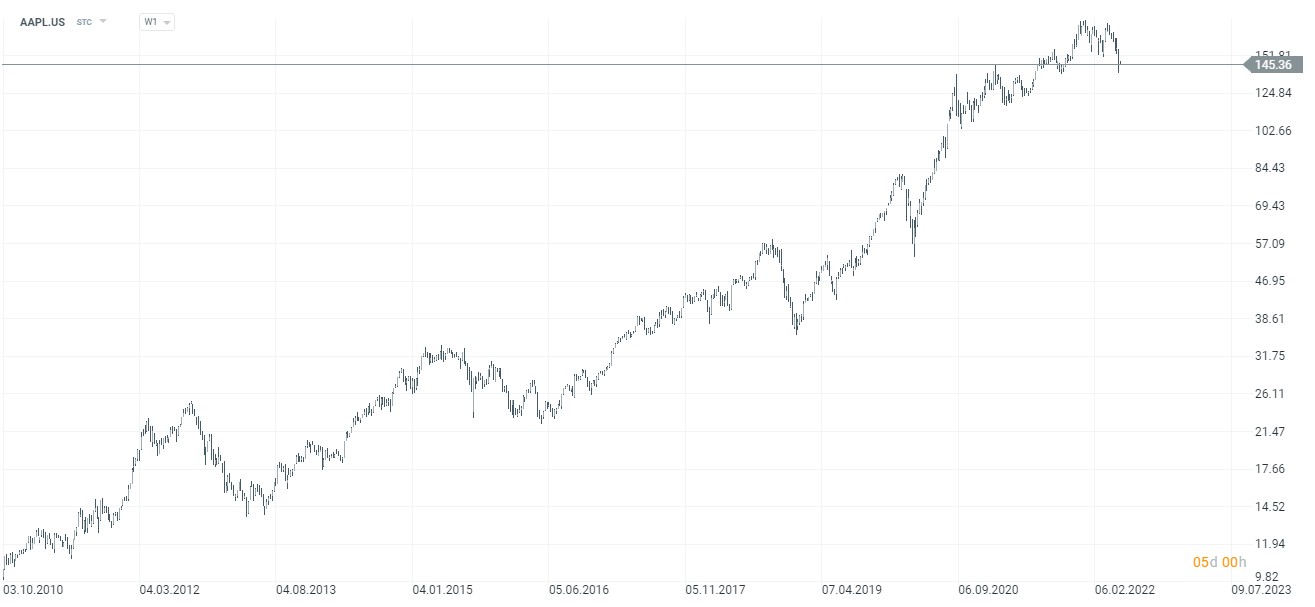
Apple chart, interval W1. Source: xNUMX XTB.
Home Depot
Home Depot it the largest chain of DIY stores and garden stores in the world. At the end of the 2021 financial year, the chain had 2317 stores located in the United States, Canada and Mexico. The average floor area of one store is 104 square feet, including 000 square feet of outdoor garden area. There are 24 to 000 items in one store. The range of products is extremely wide: from building materials to tap seals. Thanks to this, the stores are used by both professional construction teams and ordinary consumers who want to make, for example, repairs on their own. Home Depot sells its products both through the traditional channel (its own chain of stores) and online. Of course, most of the revenues are generated from the network of stationary stores. In the years 30-000, the average volume of purchases increased by over 40% (CAGR). In the last fiscal year, the average customer transaction was $ 000. Meanwhile, average sales per square foot during that time grew by 2019% yearly, reaching $ 2021. Home Depot is a true cash generating machine. This allows the company to generously share profits with shareholders. In 10 alone, the company paid out $ 83,04 billion in dividends and bought back its own shares for $ 15,5 billion. The company's annual reports also show that the company's management board also focuses on operational efficiency, regularly measuring ROIC, i.e. the return on capital invested.
| $ million | 2018FY | 2019FY | 2020FY | 2021FY |
| revenues | 108 203 | 110 225 | 132 110 | 151 157 |
| operational profit | 15 777 | 15 843 | 18 278 | 23 040 |
| operating margin | Present in several = 14,58% | Present in several = 14,37% | Present in several = 13,84% | Present in several = 15,24% |
| net profit | 11 121 | 11 242 | 12 866 | 16 433 |

Home Depot Chart, W1 Interval. Source: xNUMX XTB.
Forex brokers offering ETFs and stocks
How to invest in dividend companies? Of course, the simplest option is to buy only shares, but for people who want to well diversify and balance their portfolio, investing in dividend companies through entire ETFs will be a better choice. An increasing number of forex brokers have quite a rich offer of stocks, ETFs and CFDs for these instruments.
For example on XTB Today, we can find over 3500 equity instruments and 400 ETFs, a Saxo Bank over 19 companies and 000 ETF funds.
| Broker |  |
||
| End | Poland | Denmark | Cyprus * |
| Number of exchanges on offer | 16 exchanges | 37 exchanges | 24 exchanges |
| Number of shares in the offer | approx. 3500 - shares circa 2000 - CFDs on shares |
19 - shares 8 - CFDs on shares |
approx. 3 - CFD on shares |
| The amount of ETF on offer | approx. 400 - ETF approx. 170 - CFD on ETF |
3000 - ETF 675 - CFD on ETF |
approx. 100 - CFD on ETF |
| Commission | 0% commission up to EUR 100 turnover / month | according to the price list | Spread depends on the instrument |
| Min. Deposit | PLN 0 (recommended min. PLN 2000 or USD 500, EUR) |
0 PLN / 0 EUR / 0 USD | PLN 500 |
| Platform | xStation | SaxoTrader Pro Saxo Trader Go |
Plus500 platform |
* PLUS500 CY offer
CFDs are complex instruments and come with a high risk of losing money rapidly due to leverage. From 72% to 89% of retail investor accounts record monetary losses as a result of trading CFDs. Think about whether you understand how CFDs work and whether you can afford the high risk of losing your money.


