


Trend lines in the LT-4C formation and their application on price abolition

Trend lines are a fascinating tool. Most traders who do not use indicators definitely use trend lines in their analysis. One of the most important elements of technical analysis is determining the direction of the trend and the upcoming price changes. The classic technique is to use a trend line that offers clear indications of levels of support and resistance in price changes. The trend line is a straight line connecting two or more points in both the upward trend and the downward trend.
Be sure to read: How to distinguish a trend market from consolidation
One of the basic iron rules when applying a trend line is:
The line connecting the points should not cross the bodies or shadows of existing candles.
The intersection of the line by the changing price indicates the upcoming price and / or trend changes. Although trend lines are a very simple tool, we are unfortunately drawing them incorrectly. When we start our analysis, the first thing we should do is set the direction of the current trend direction. The chart below clearly shows a strong price increase - swing AB. And suddenly the price begins to slow down its changes. A typical reaction of many traders is to open short positions. But why do they make such a decision? Of course, the simple definition of a trend change is to blame here. We are dealing with more and more swings with lower and lower high turning points.
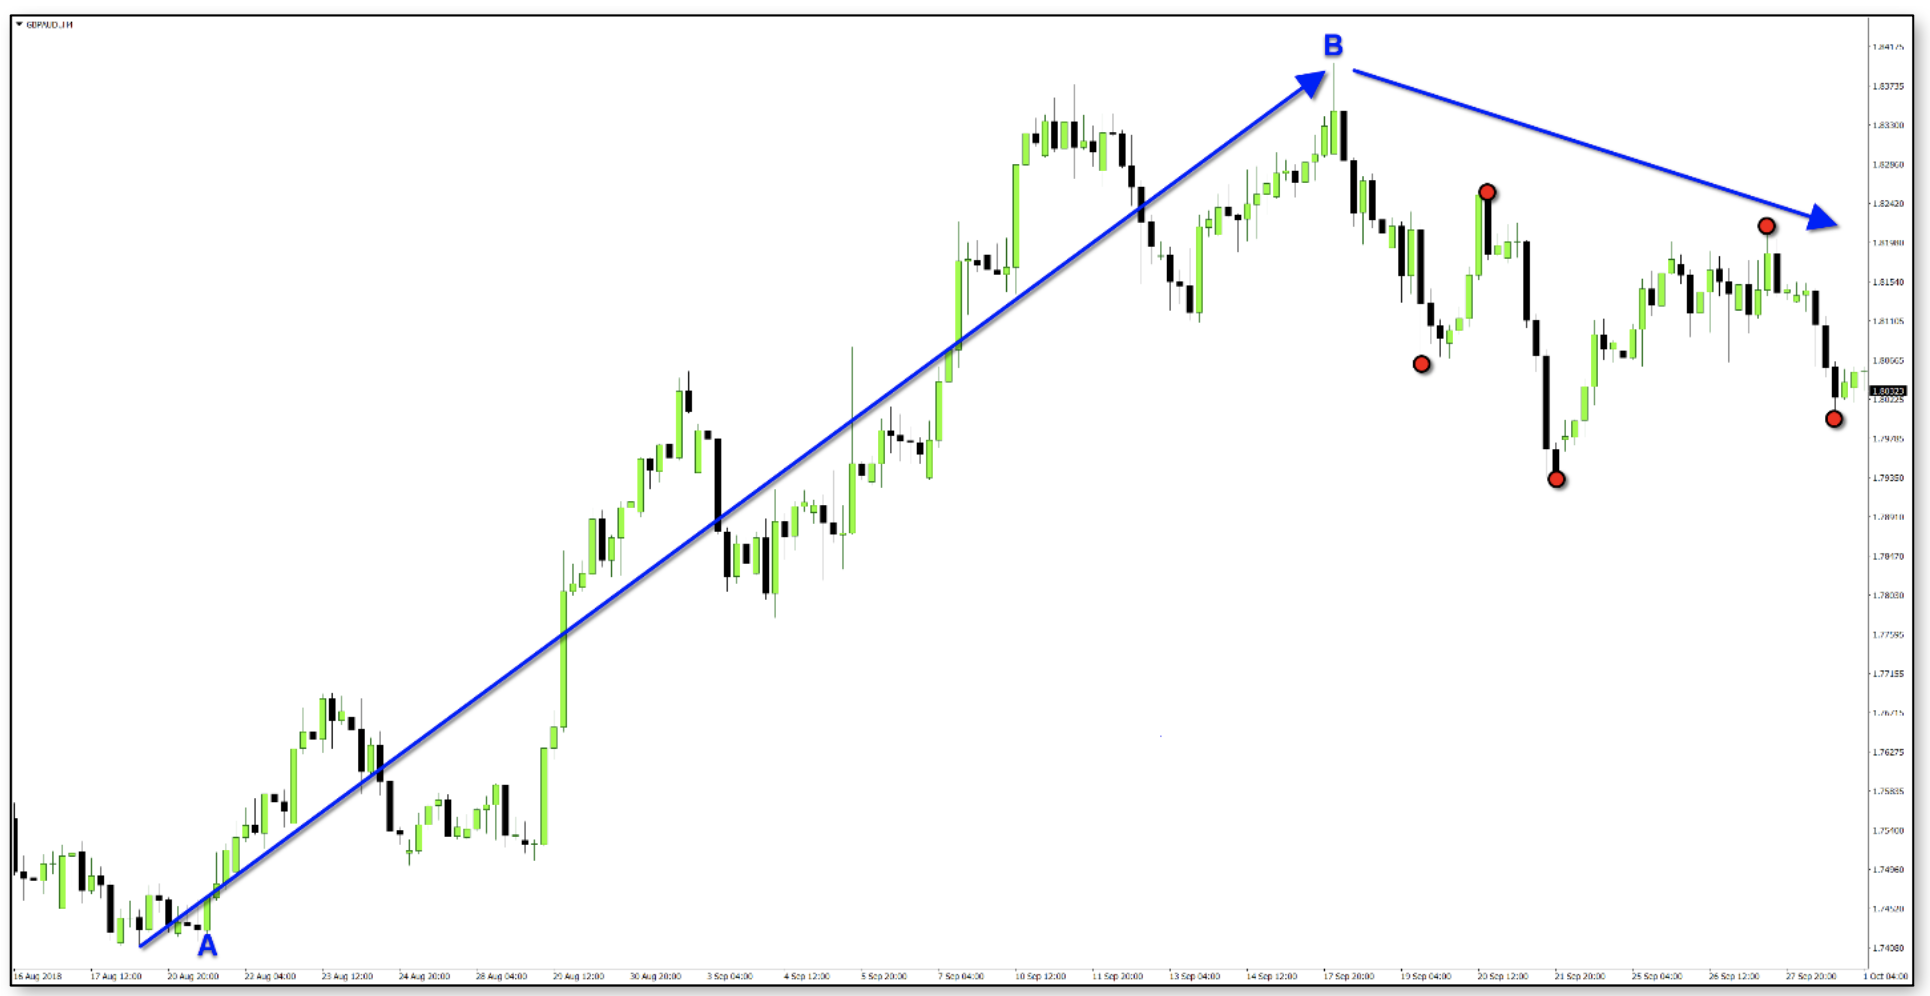
Typical definition of a trend change.
Unfortunately, typical definitions do not always work as most traders expect ...
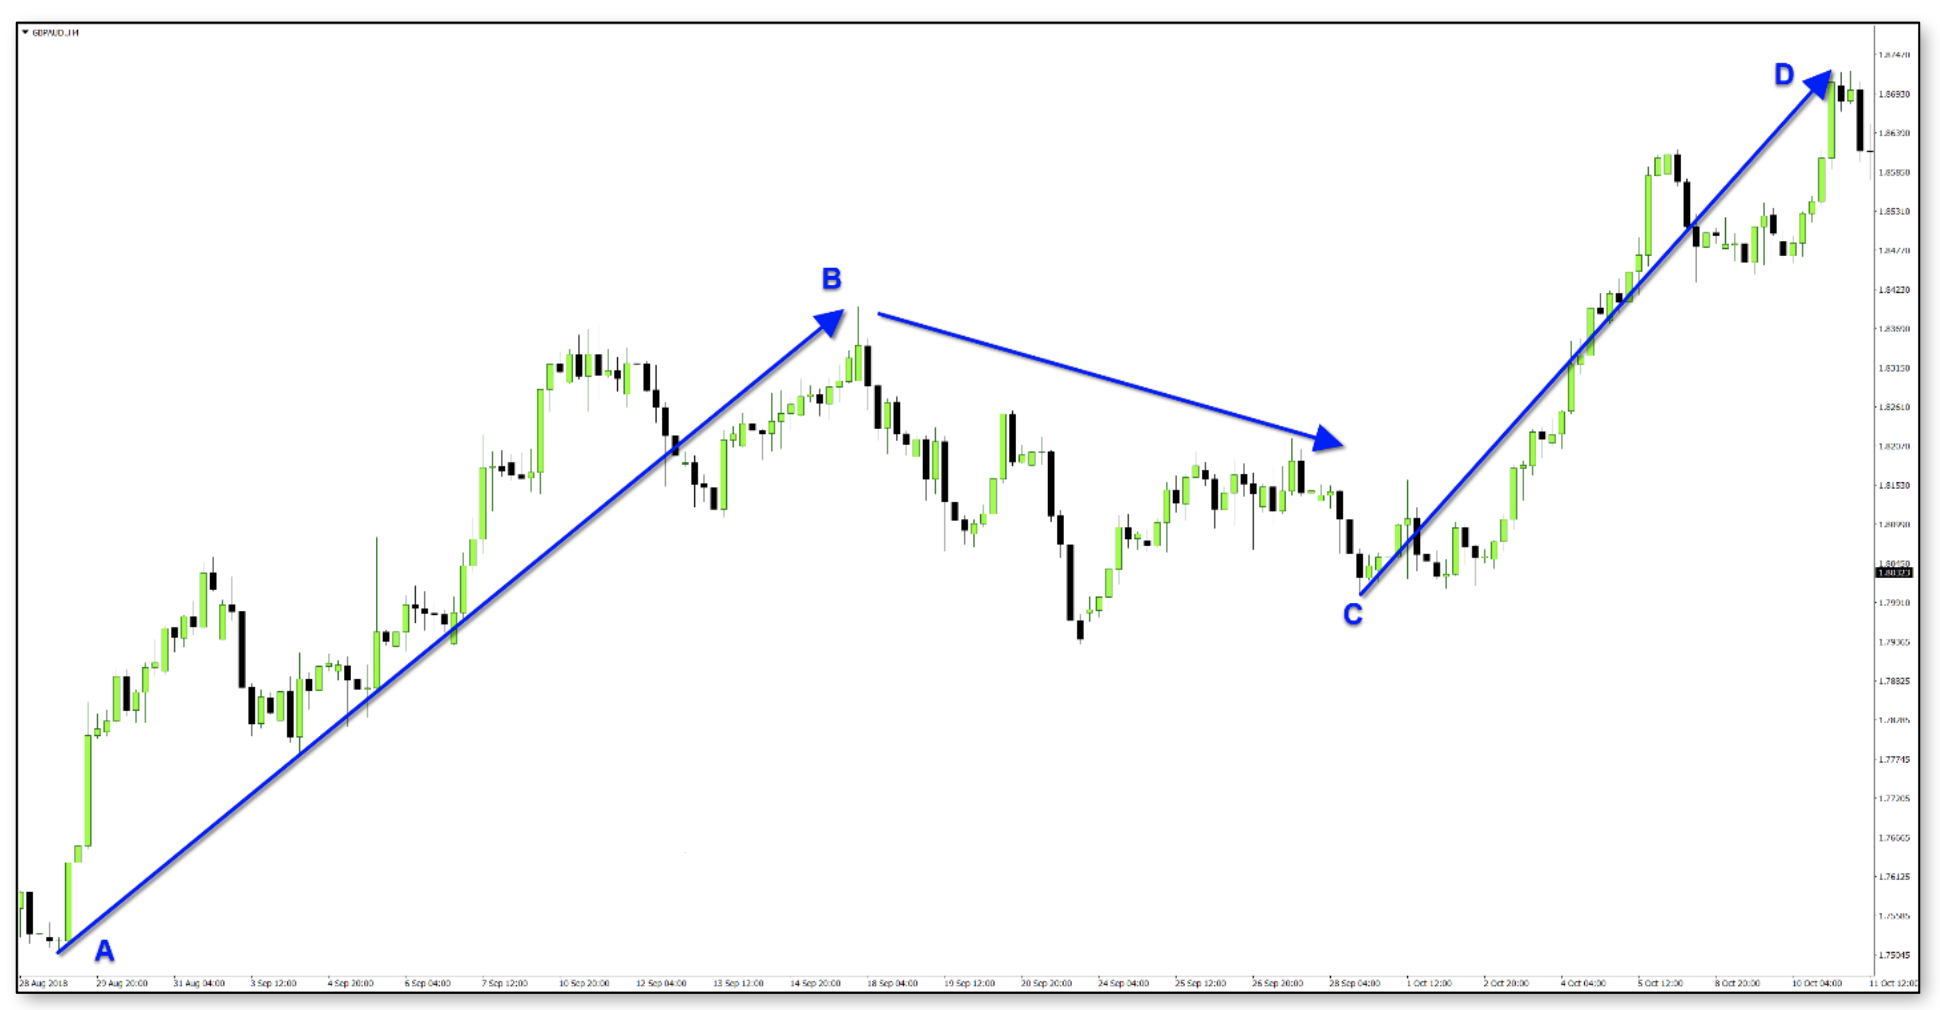
Unexpected continuation of swing AB.
The swing CD is almost the same length as the swing AB - 790 pips. We should not base our analysis solely on the theoretical definition of trend change. We should pay special attention to changes momentum. Impet is the necessary energy that the price needs for its changes. Are we able to determine the upcoming changes that have occurred in the above chart? Yes!
The technique you are about to learn is an excellent indicator of where and when you can open positions when changing swings and increasing momentum.
It is an elementary idea to check that each stroke is correct given:
- Trend.
- Number of price withdrawals in swings.
- Relative length of swings.
- Percent lift of swings.
Trend and price hold lines
Let's look at the excellent application of the trend line to determine price reversals. In general, the weaker the reversal, the more likely a return to the ongoing trend is. This means that a weak withdrawal is worth the risk of our capital. On the other hand, a strong price reversal is a warning to us that there will most likely be a change of direction. By using two trend lines, you can observe the momentum of the impetus on price lifting based on several swings.
Trading Rules - Trend Line Theory (Pullback)
Our first task is to master the correct drawing of 0-2 and 0-4 lines. In the upward trend the 0 turning point 'ZERO', is extremely high point.
This is the point where the backtracks begin - a turning point:
- Note the following graphs for correct marking of turning points and their marking from 0 to 4.
- Then draw the trend line from point 0 through point 2. This is the 0-2 line (green).
- Now draw the trend line from point 0 to point 4. This is the 0-4 (red) line.
The essence of our analysis is the relative slope of both lines in relation to each other.
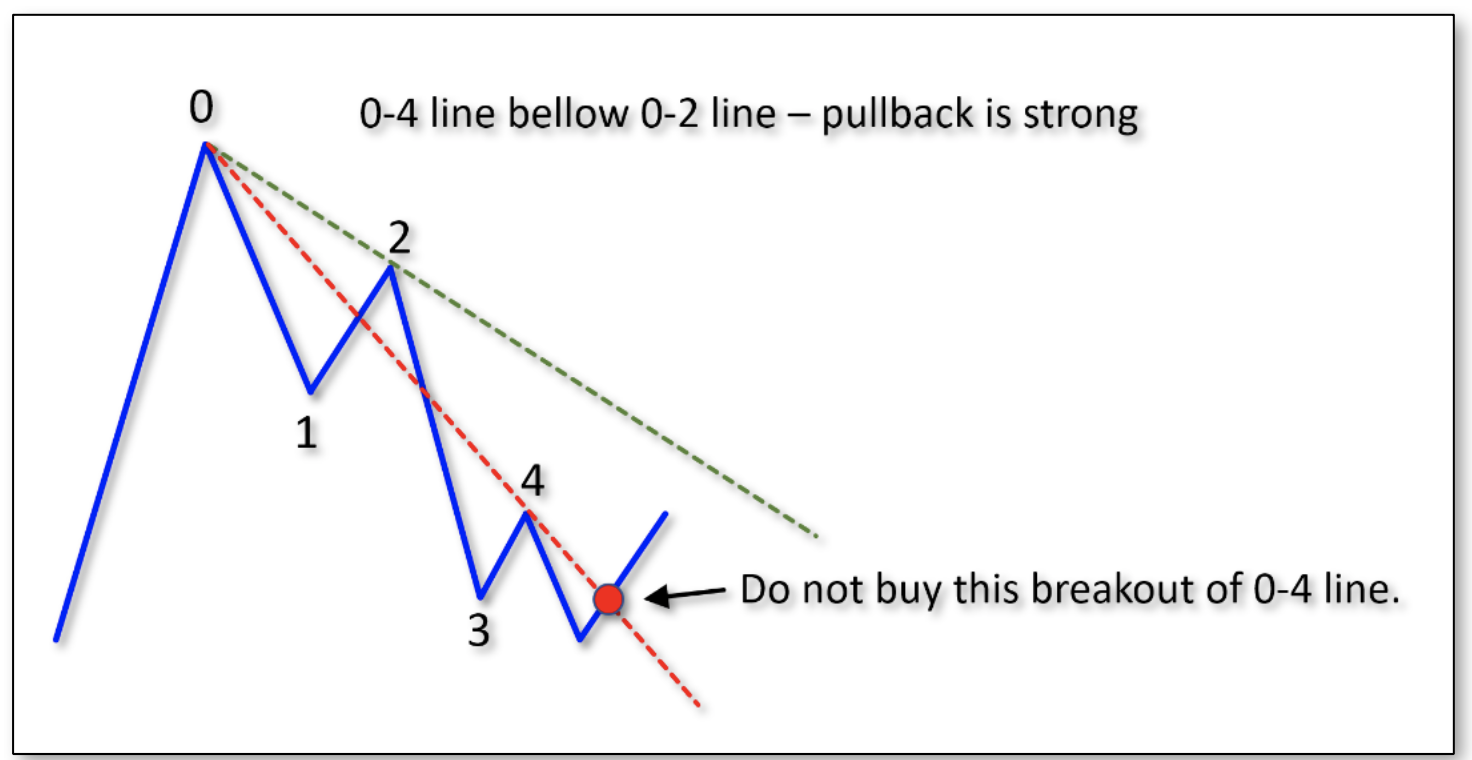
With this line setting, we do not open long positions.
If the 0-4 line is below the 0-2 line, the price halt is strong. Avoid trading in this line setting.
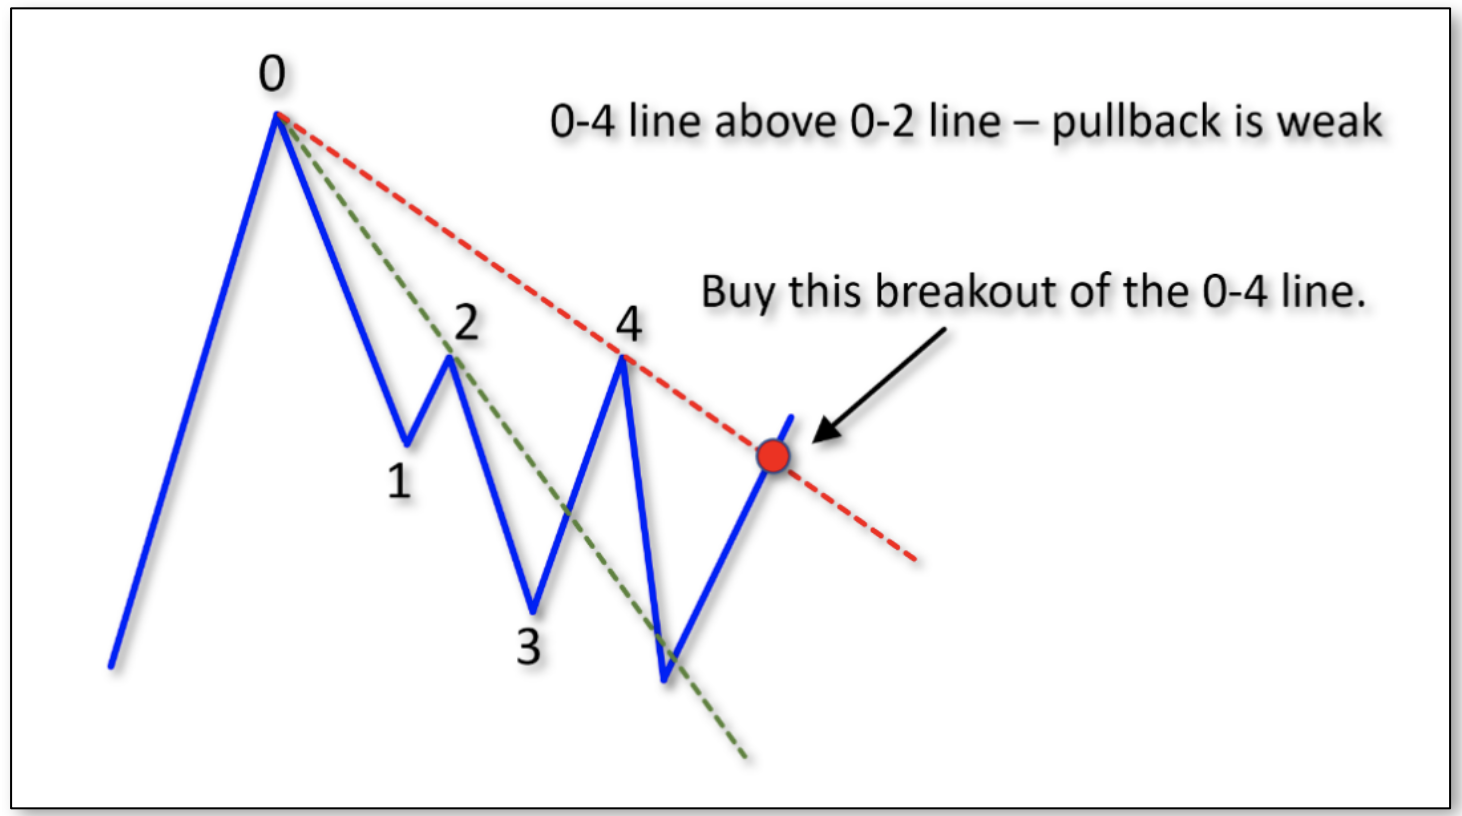
Correct setting for opening long positions.
If the -2 line is below the 0-4 line, the price is ready for further increase. This is the correct setting on which we can trade. Here is the setting for the previously used GBP / AUD pair chart.
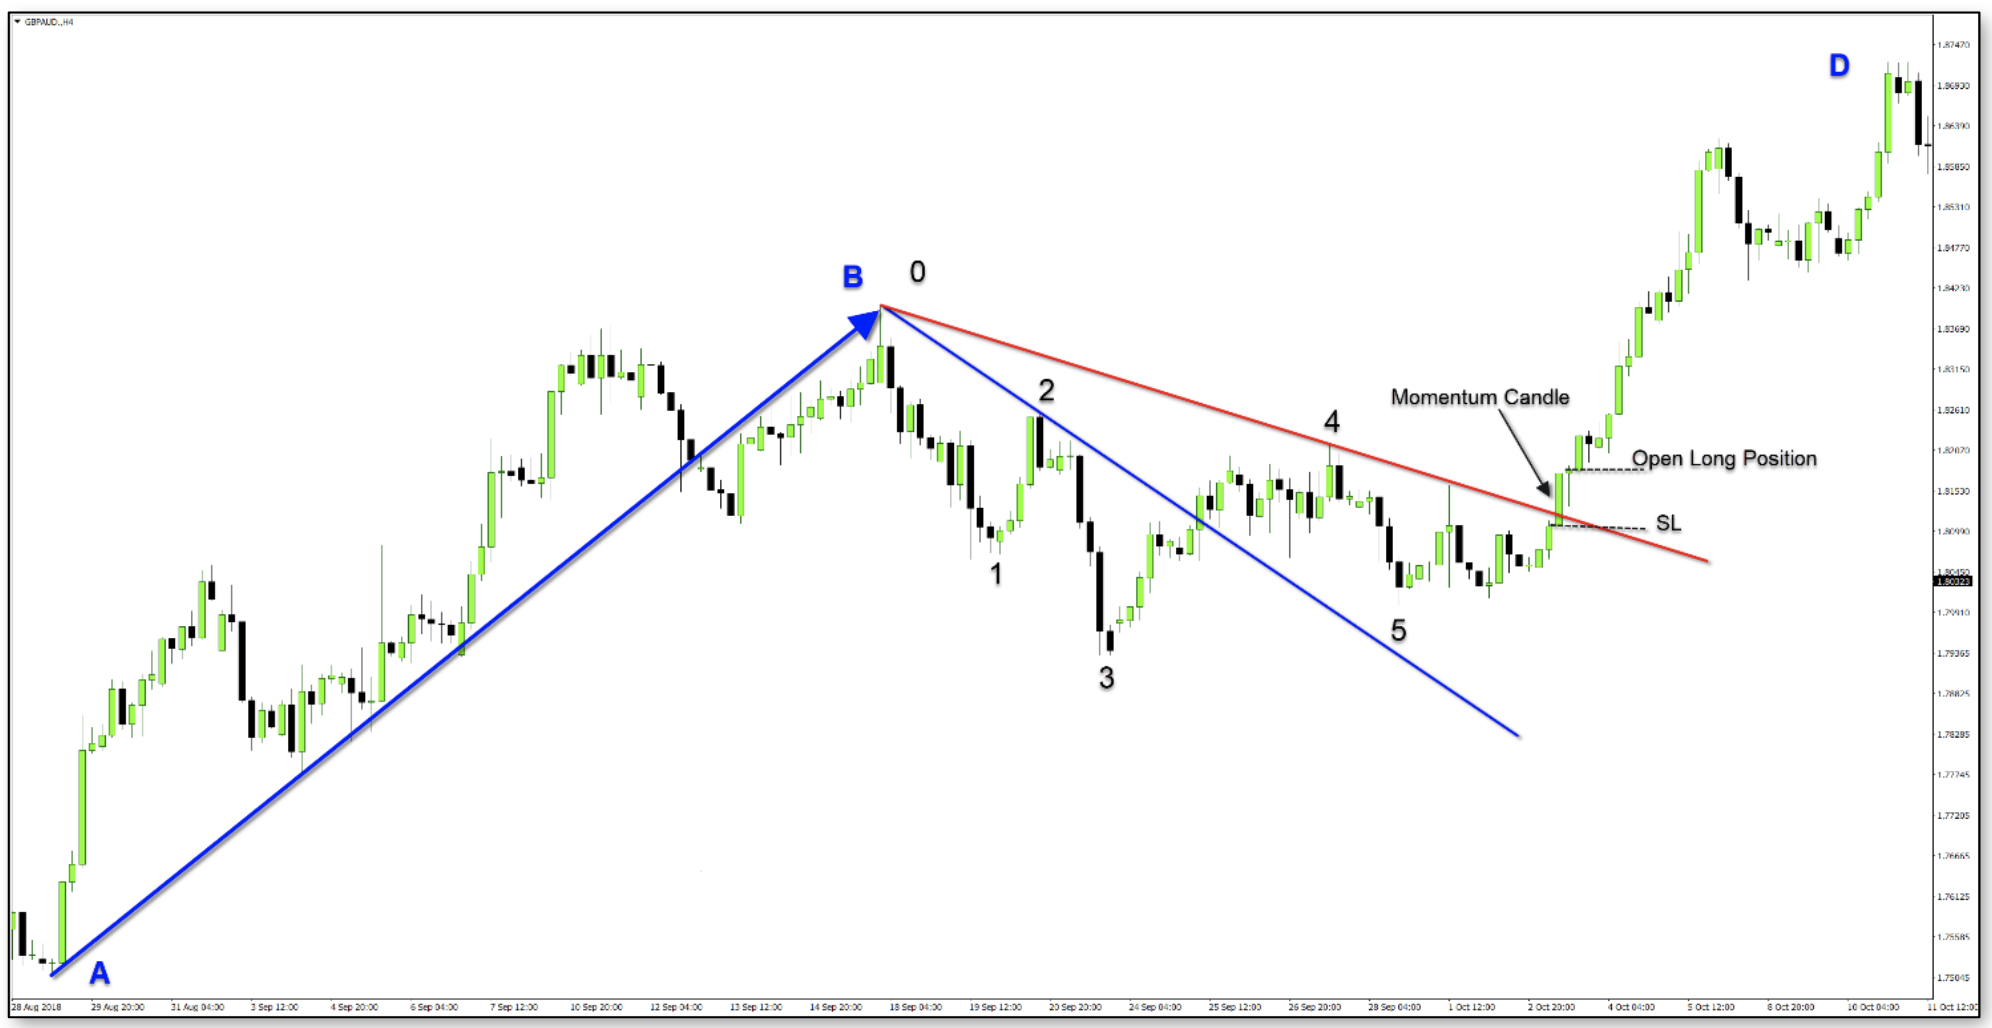
Correct trend line setting.
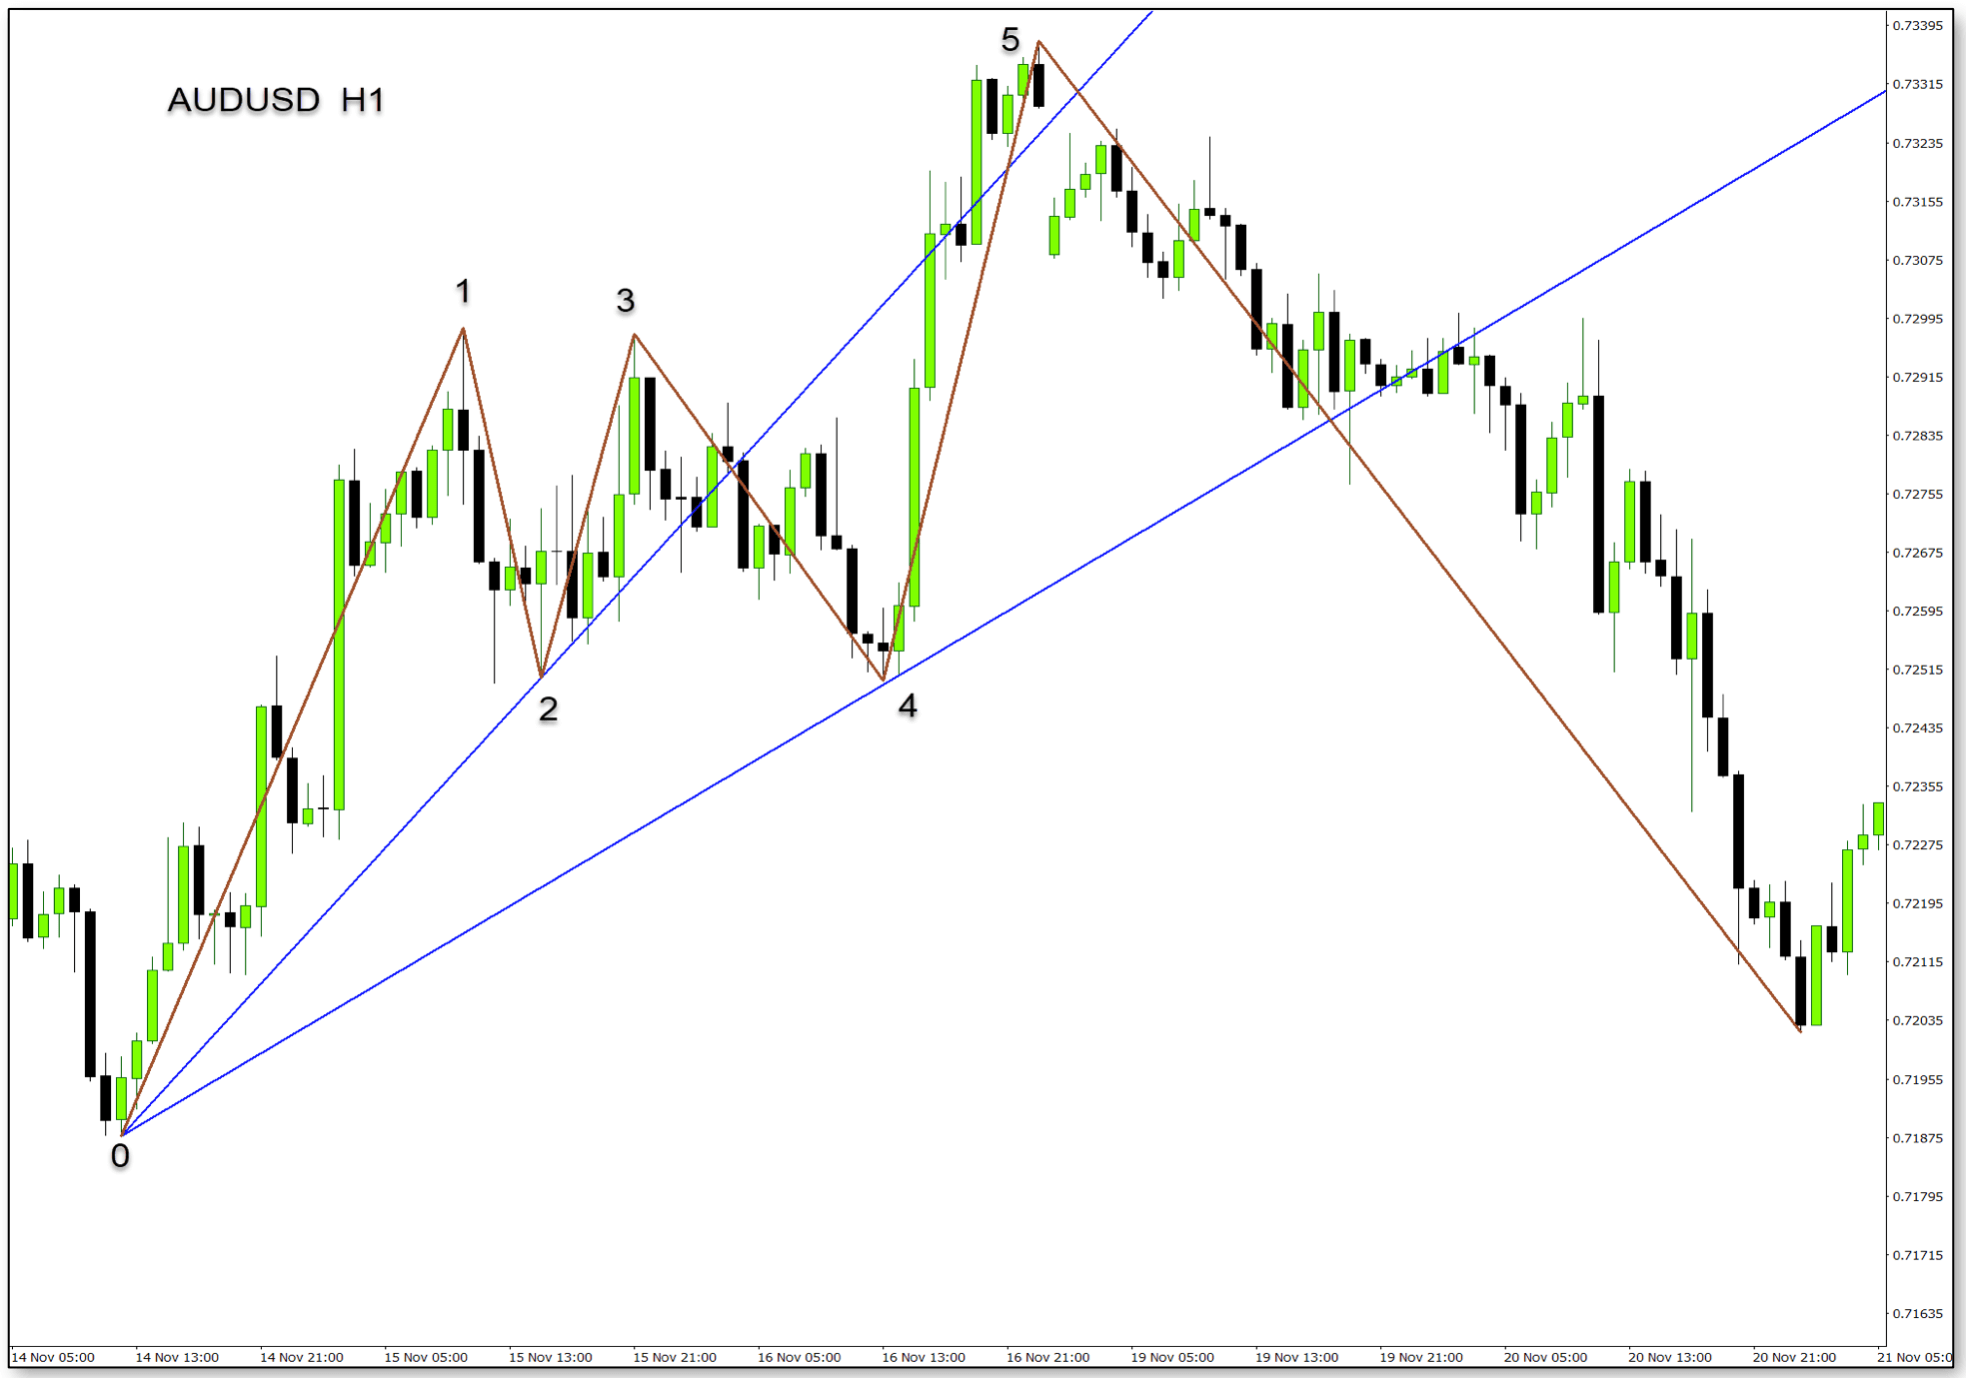
Another example of the correct setting for the upward trend.
Trading rules on two lines.
Long position:
-
- Rising trend.
- The 0-4 line is located above the 0-2 line
- Open a buy position on the upward break in the price of the 0-4 line. The signal candle should close significantly above the 0-4 line.
Short position:
-
- Downward trend.
- The 0-4 line is below the 0-2 line
- Open a sales position after the price drops below the 0-4 line. The signal candle should close significantly below the 0-4 line.
This method may seem a bit complicated at the beginning of its use. Pay attention mainly to the 0-4 line. Switch to your own charts and train line mapping.
Check your claims according to the following trade rules.
Again:
- For a long uptrend position, the 0-4 line should be above the 0-2 line.
- For a short downward trend, the 0-4 line should be below the 0-2 line.
Personally, I am impressed by this simple strategy. This is a clever way to use the trend line.
Pay special attention to price changes in the context of a trend and you have at your disposal an excellent strategy that works on every financial market and on every time frame. It is always safest to wait for confirmation of a line break. The candle should close significantly above (below) the trend line. The best signal is after closing candlestick impetus.
This article is part of the book "Esencja Foreksu - Trend Lines".
Author Jim Poniat
 Well-known Canadian financial market analyst and trader with 13 years of experience. Author of two books specializing in Forex trading. From 2006 to 2008, he trained and gained knowledge from traders such as Bill Williams, Steve Nison, Martin Pring, Michael Duane Archer and many others. From 2008 to 2015, he ran an investment fund with several million dollars. During this time he cooperated with one of Canadian banks.


