


Risk-off markets, falling inflation and a strong US labor market

One of the most important weeks in terms of the development of the situation on the financial markets in the coming months is behind us. The most important data we got to know was, of course, another US inflation reading (and the second consecutive month of positive surprise - inflation is falling faster than expected by the market). The day after inflation, we also had another Fed meeting, which turned out to be more hawkish than the market expected.
Last week we also had a meeting and decisions of other central banks, especially in particular ECB. From the important macro data, apart from inflation, we also learned further data on unemployment benefits (in the US) and preliminary readings of PMI indices for December this year.
After inflation and the Fed, markets went into risk-off mode
Last week the WIG index increased slightly by 0,35% and practically came full circle, rising to a positive US inflation surprise (closing on Tuesday), and then falling due to the hawkish rhetoric of central banks. We remain above the 200-day moving average and there is still no sign of a breakout to the downside. We even got a positive signal of a breakout above the 100-day moving average through the 50-day moving average. Normally, this should be a positive sign, but today it is not necessarily so. If only central banks could start lowering interest rates.

W.1 Index WEDGE until December 16.12.2022, XNUMX. Source: own study, stooq.pl
Interestingly, S & P500 experienced a significant decline for the second week in a row. Over the last two weeks, the S&P500 fell by a total of 5,39%, while the WIG fell by only 0,31%. As a rule, this situation should not last too long (especially during declines). The next chart compares the S&P500 with the WIG20 index.
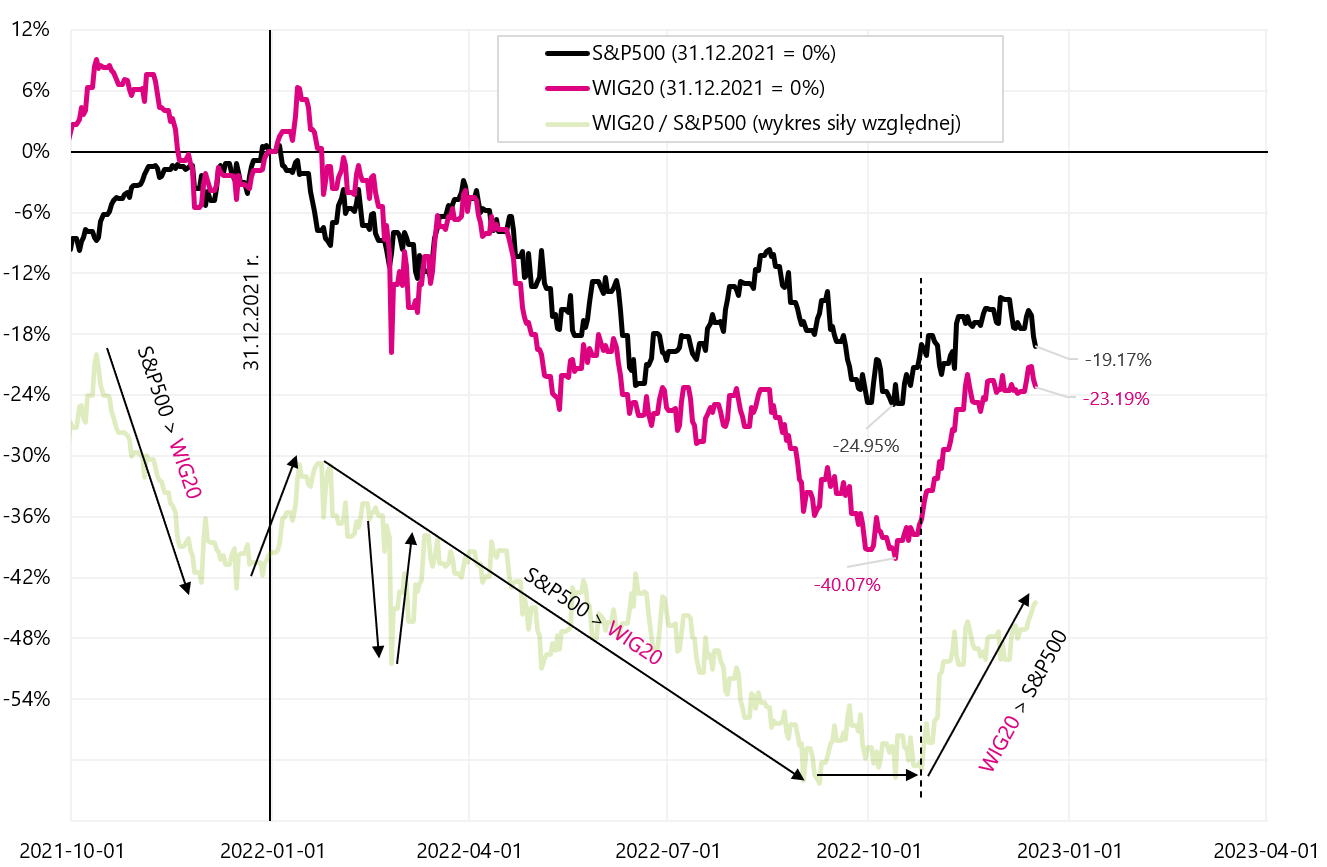
W. 2 S & P500 i Wig20 from the beginning of 2022, and the relative strength chart until December 16.12.2022, XNUMX. Source: own study, stooq.pl
Last week was not a good one for US stocks. The S&P500 index fell by 2,08% and broke down the 50-day average and is now only 7,7% above the lows of the current slump (for comparison, the WIG is still 22,8% above the lows of the current slump).
W.3 Index S & P500 until December 16.12.2022, XNUMX. Source: own study, stooq.pl
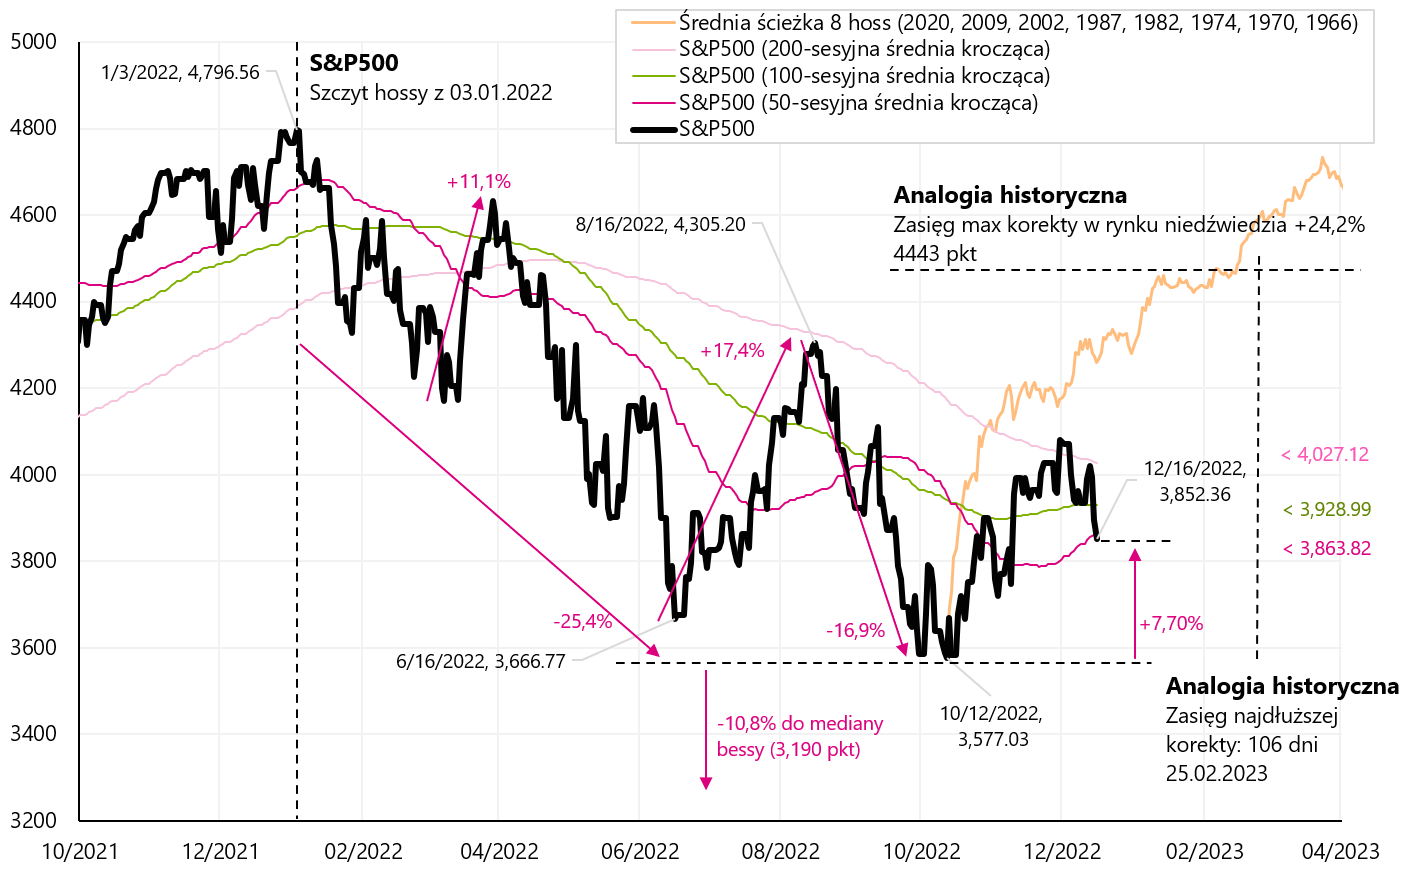
Let's check how the closing of the week on the S&P500 looks like against the background of 15 upward adjustments within the bear market rally and the average path of 8 bulls (the beginning of the upward adjustments and the new bull market on the next chart begins at the S&P500 low, i.e. on October 12.10.2022, 2 .). Unfortunately, it seems that after the last XNUMX sessions of decline, we are moving away from the scenario of a new bull market.
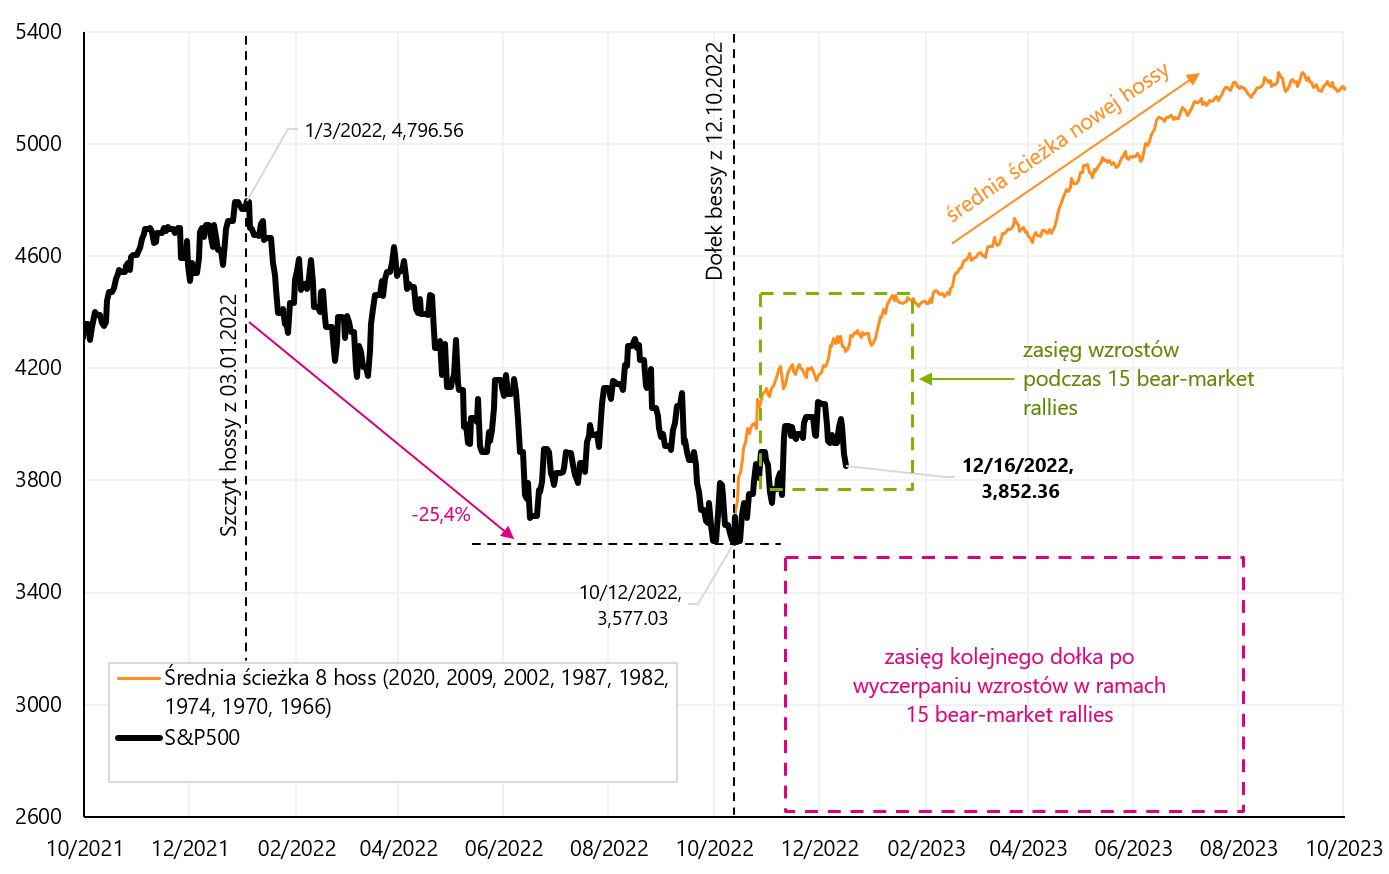
W.4 Index S & P500 until December 16.12.2022, 15, the range of 2022 "bear-market rallies" from the bear markets in 2008, 2009-2000, 2002-1973 and 1974-8, and the average bull market path (on the example of XNUMX bull markets). Source: own study, stooq.pl
Last week, the most important event for the financial markets was the publication of inflation in the US for November this year, which the markets welcomed with great enthusiasm. Nevertheless, in the following days, central banks treated investors with a "cold shower", unwavering in their hawkish attitude. Let's see how individual asset classes reacted. The S&P500 (futures) are presented in the next chart. Enthusiasm after better-than-expected inflation lasted only for a moment.
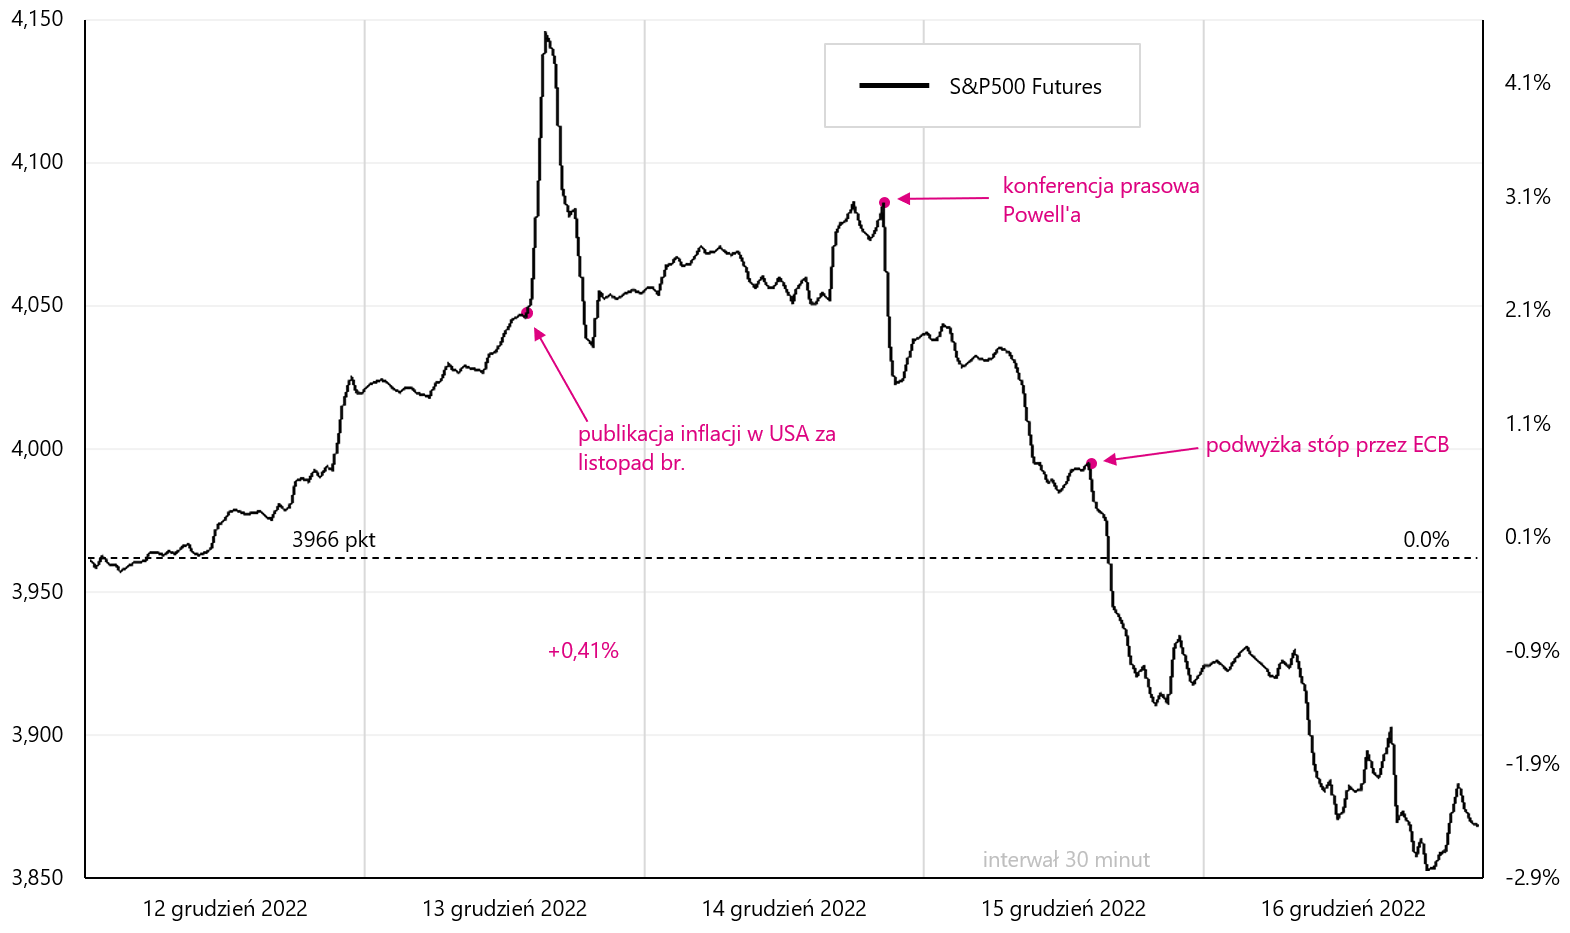
W.5 Daily chart of the Index S&P500 Futures in the week from December 12 to 16.12.2022, XNUMX. Source: own study, stooq.pl
In the case of the Eurodollar, the reaction to inflation in the US was similar (strong exchange rate increase). However, in the case of central banks, it reacted much stronger to the ECB's decision, although in this case the strong strengthening of the euro did not last long either.
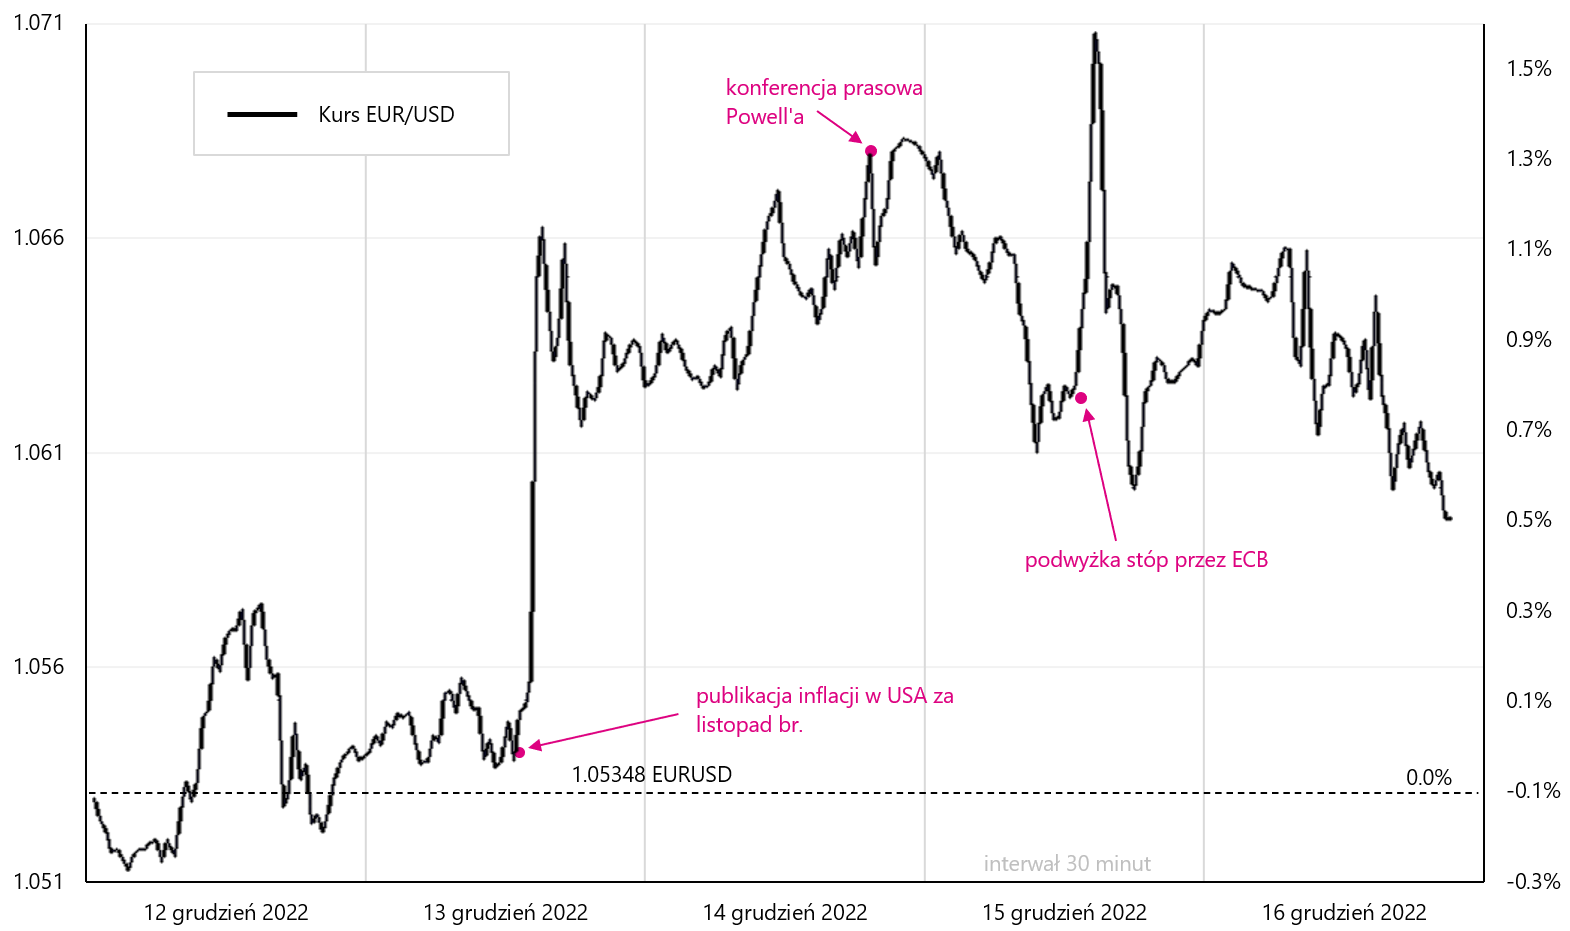
W.6 Daily exchange rate chart EUR / USD in the week from December 12 to 16.12.2022, XNUMX. Source: own study, stooq.pl
US 10-year bond yields reacted to inflation with a sharp decline of around 13 basis points immediately after the release of the inflation. Later, until the end of the week, we had high volatility, but declines after inflation were maintained (and the decisions of the FED and ECB were not as important, at least they did not affect the quotations as much as inflation).
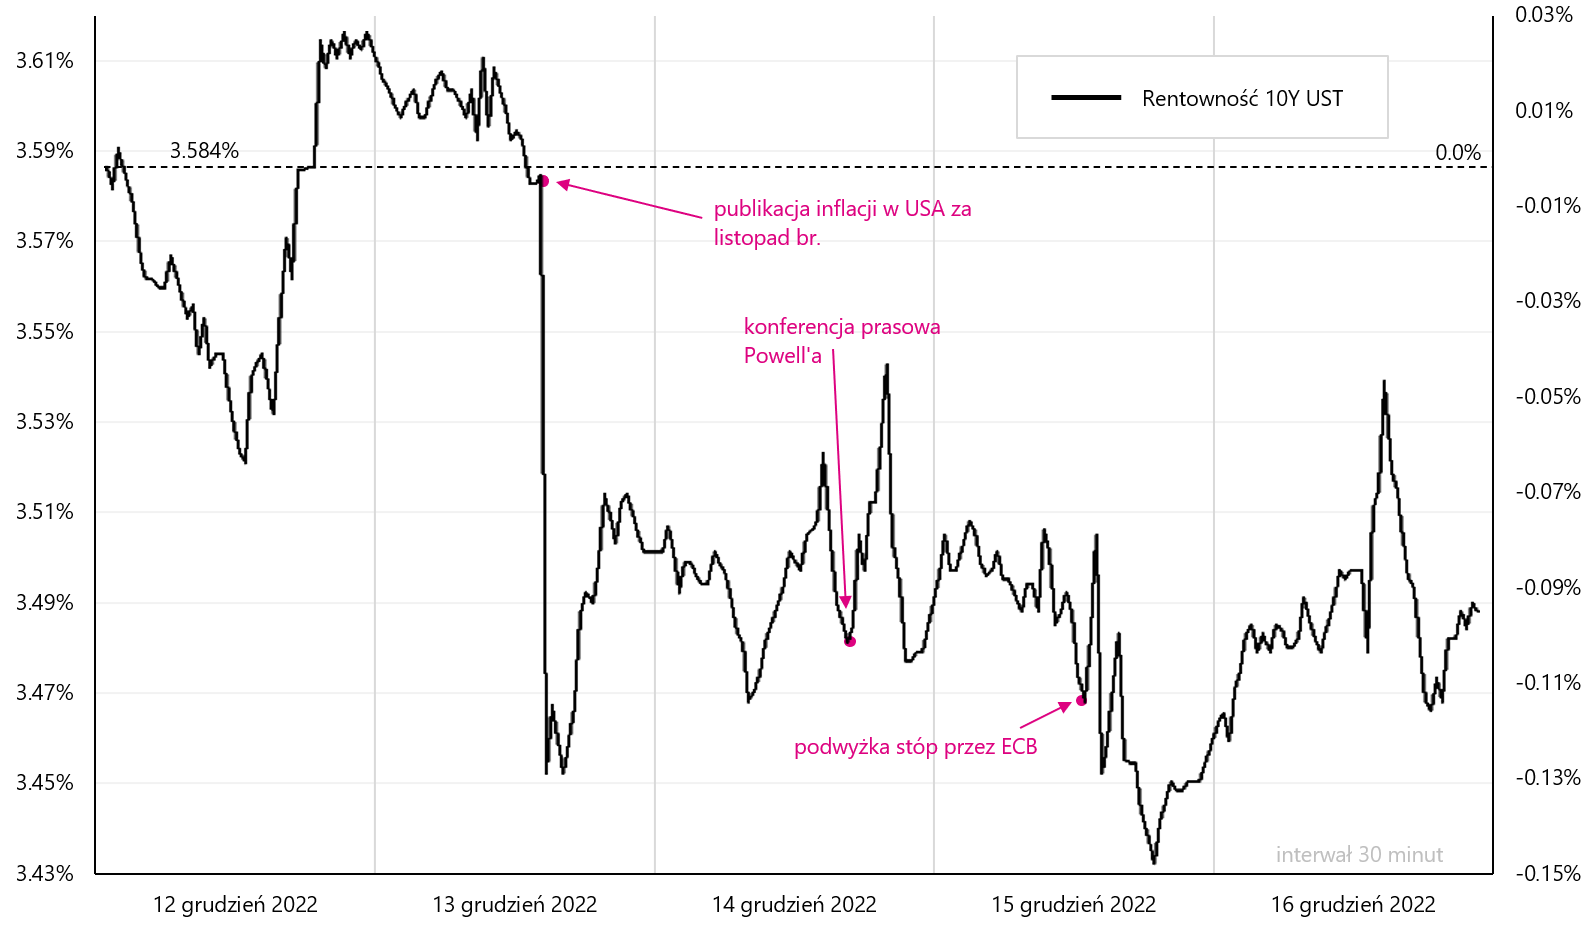
W.7 Daily yield chart 10Y SET in the week from December 12 to 16.12.2022, XNUMX. Source: own study, stooq.pl
Yields of 10-year German bonds behaved a bit differently, which reacted more after the announcement of a hawkish interest rate hike by the ECB and closed the week ca. 23 basis points higher.
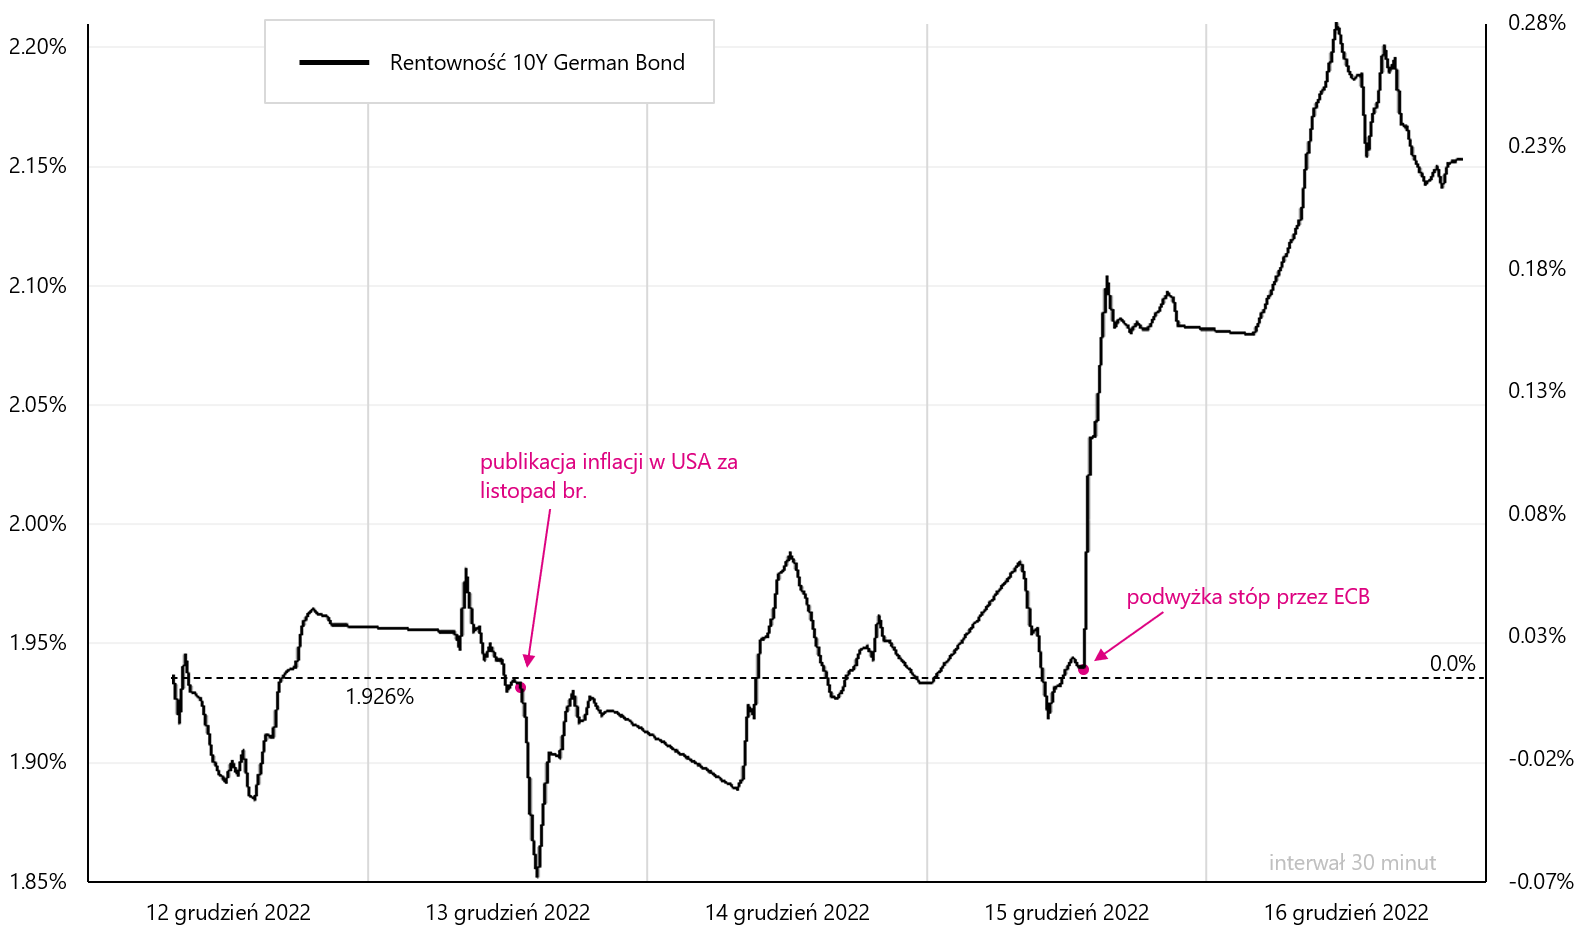
W.8 Daily yield chart 10Y German Bond in the week from December 12 to 16.12.2022, XNUMX. Source: own study, stooq.pl
In the case of gold, we closed the week with only a 0,1% decline, but gold reacted relatively strongly to both US inflation and hawkish messages from the FED and ECB during the week.
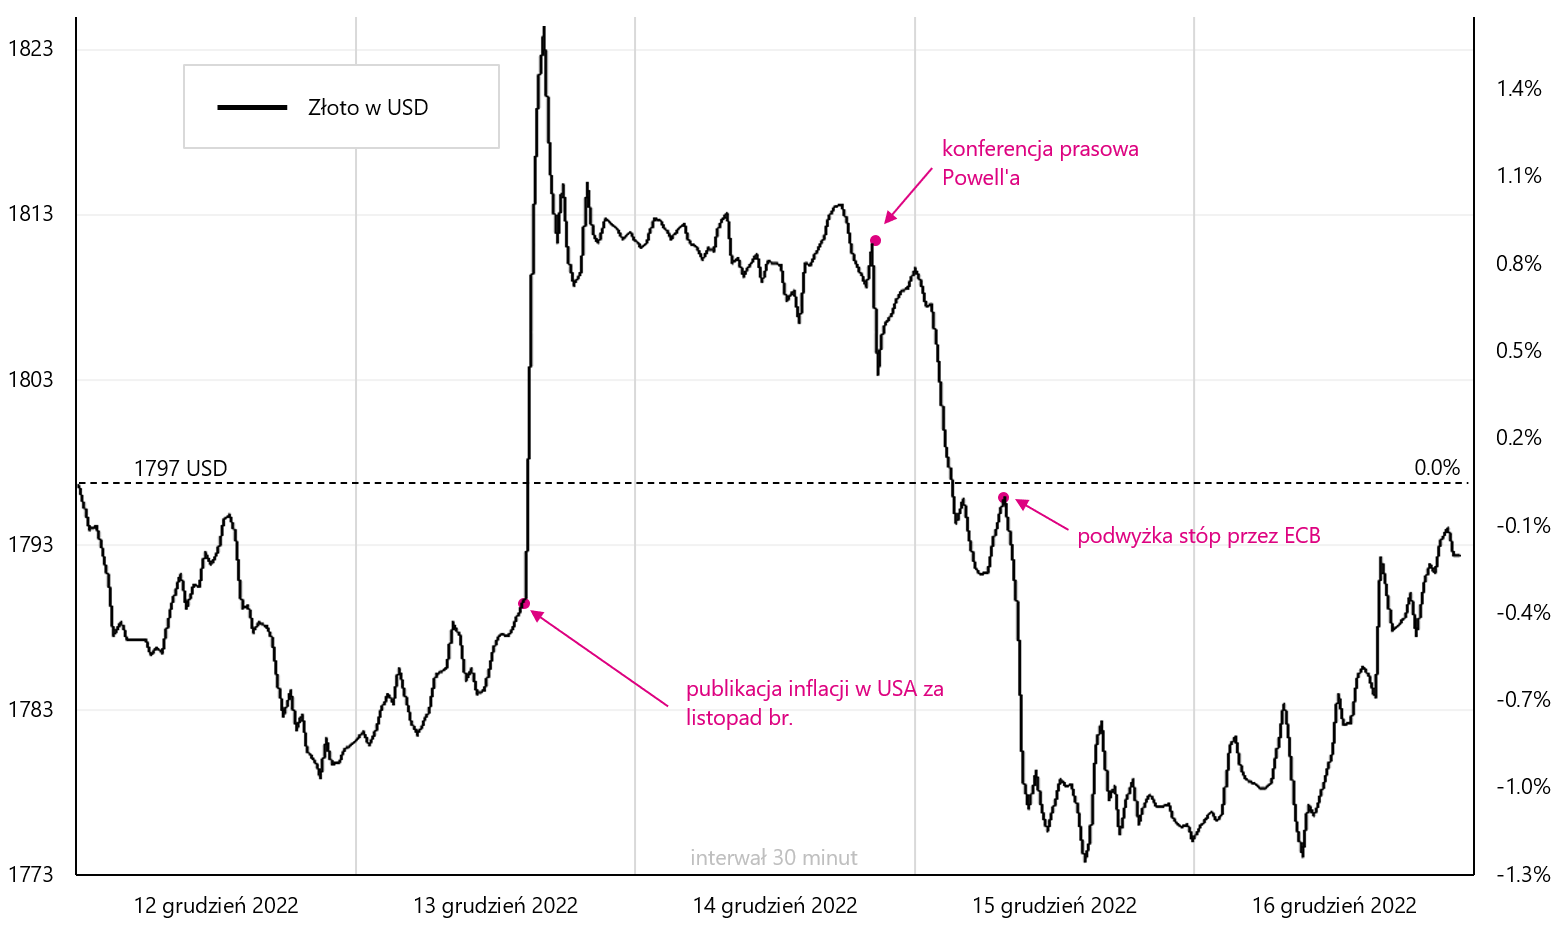
W.9 Daily exchange rate chart gold in the week from December 12 to 16.12.2022, XNUMX. Source: own study, stooq.pl
USA: Inflation is falling fast, but it's still not enough for the Fed
CPI inflation in the US fell in November much more than analysts expected. Year-on-year, it is already 7,1% (up from the peak in June this year in the amount of 9,1%). In the case of core inflation, we are talking about an annual change of 6,0% (from September's peak of 6,6%).
Virtually every major component fell more than the market expected in November. This is very good news, but it is still not an overwhelming argument for the Fed to even think about changing monetary policy (as the market would like).

W. 10 CPI inflation and core inflation in the US, year-on-year change. Source: own study, FRED
Then why did the markets want to celebrate too early? For two reasons: (i) the inflation target is 2% – and there is still a long way to goand (ii) the labor market is still too strongto think about a decline in wage growth (which, according to Powell, is the main determinant of the fight against core PCE inflation). In order for core CPI inflation to fall to pre-pandemic levels, the monthly change in inflation should not be higher than 0.1532% (on average in the following 12 months).
The monthly change in core inflation in November amounted to 0,1987% - although this is a very low reading, it would still not allow the annual dynamics to return to pre-pandemic levels. In the last 5 months (the annual CPI inflation rate has been falling for 5 months), the average monthly change in core inflation amounted to 0,3853%. Simulations of core inflation decline with such monthly changes are presented in the next chart.
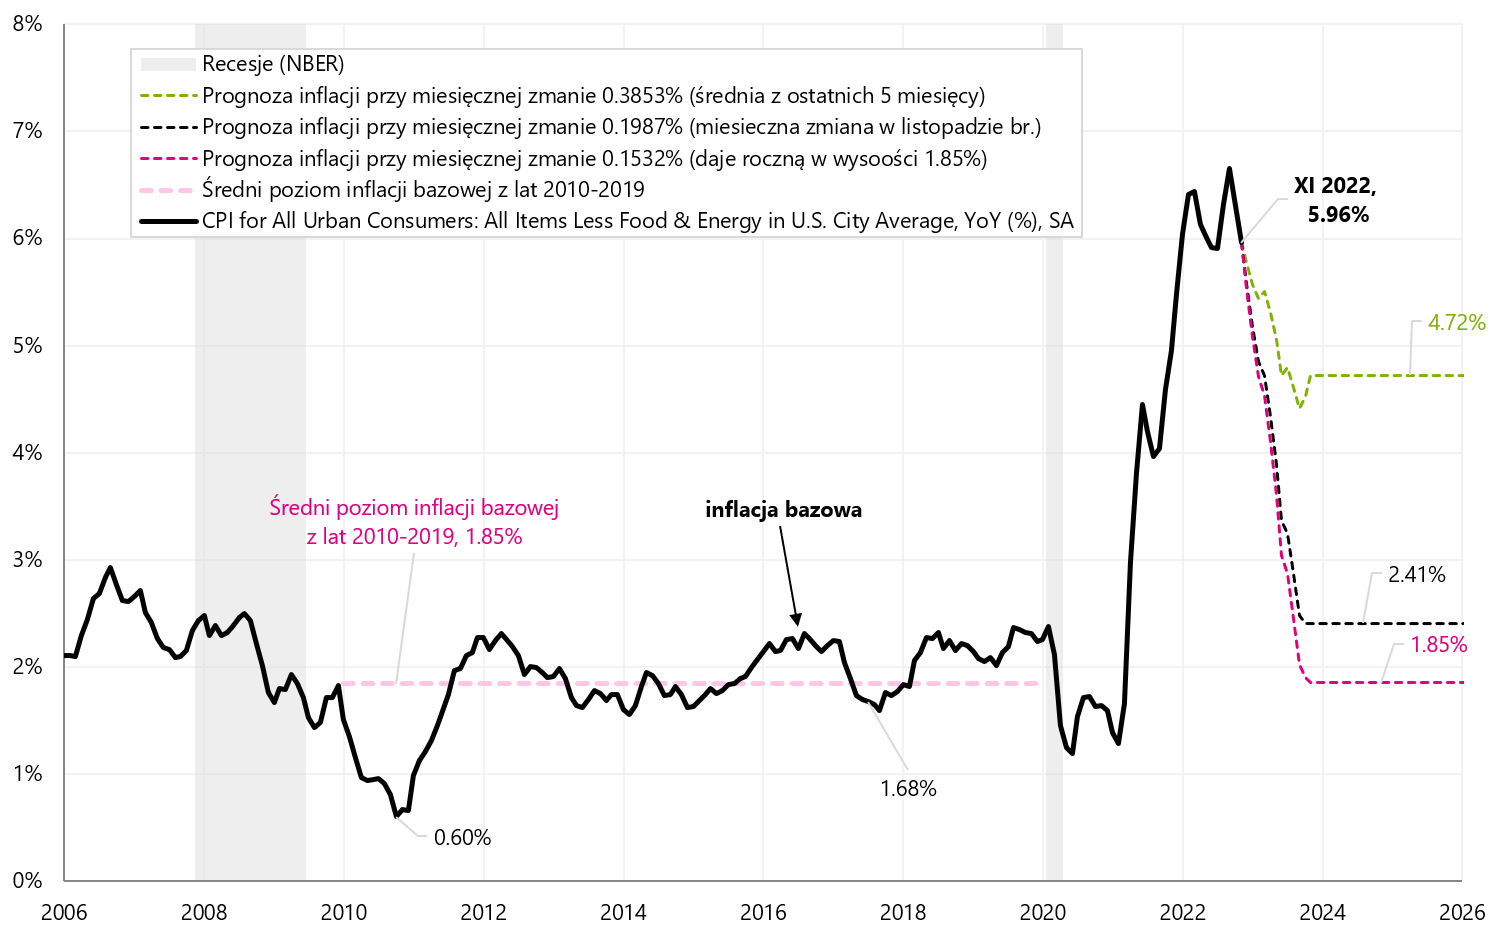
W. 11 core inflation in the USA and simulating its decrease with various monthly changes. Source: own study, FRED
Therefore even a very slight increase in core inflation in November this year. this is still too high for us to return to pre-pandemic inflation levels. The next chart shows monthly changes in core inflation and the level required each month (0,1532% - black dashed line) for annual inflation to return to pre-pandemic levels.
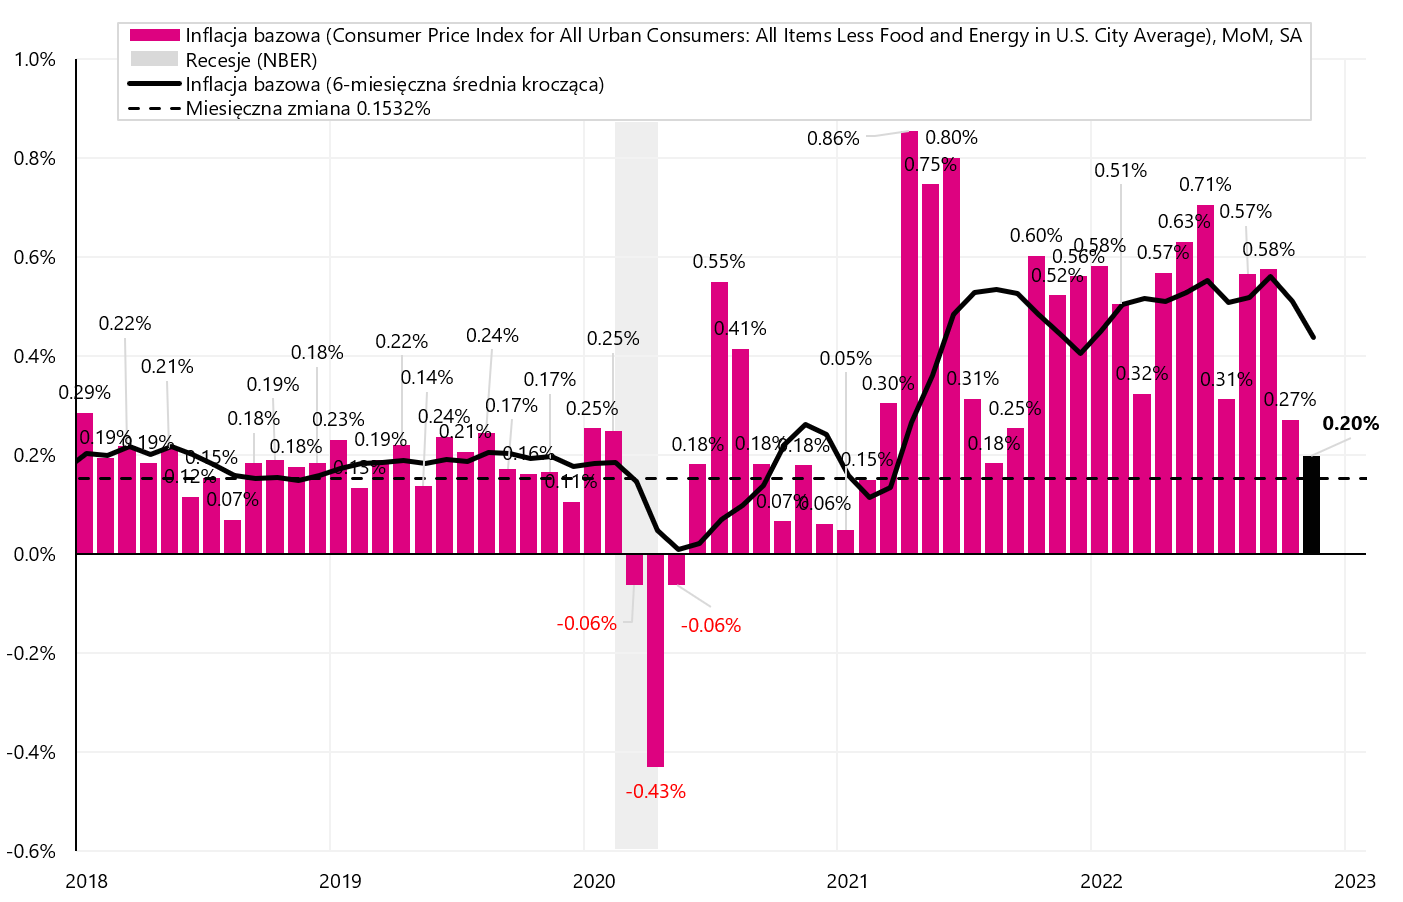
W.12 Monthly changes in core inflation in the USA and simulating its decrease with various monthly changes. Source: own study, FRED
The Fed has no plans to cut rates in 2023. In its just published projection, the FED raised the central projection to 5,10% at the end of 2023 and 4,10% at the end of 2024 (was 4,6% and 3,9%). The FED also raised its inflation forecast to 3,5% at the end of 2023 and 2,5% at the end of 2024 (was 3,1% and 2,3%). The next chart shows the latest path of interest rates according to the FED projection (from December 15.12.2022, XNUMX).
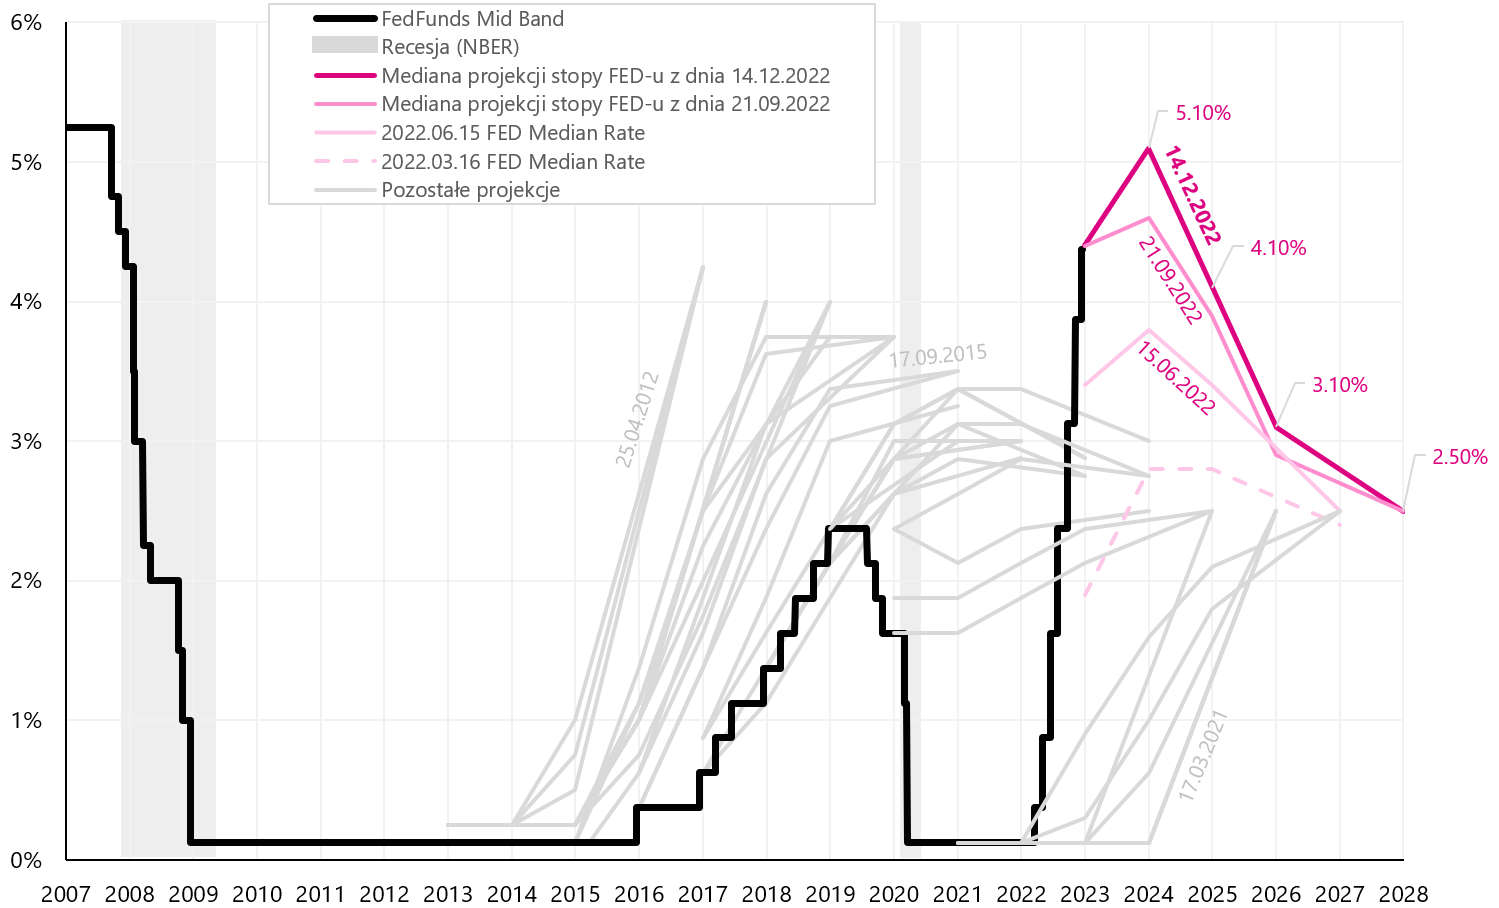
W.13 Projection history Fed interest rates from each meeting against the background of the actual reference rate (FedFunds Mid Band), including the latest projection of December 15.12.2022, XNUMX. Source: own study, FOMC Projections
The next chart shows two FED interest rate futures curves. The first before the publication of inflation for November this year. (curve of December 12.12.2022, 16.12.2022), and the second at the end of this week (of December 4,99, 4,83). The combined effect of inflation and the next FED meeting is a decrease in the valuation of the maximum rate to which the FED will raise rates from 2023% to 5,1% (green dashed line). The FED rate at the end of 4,40, according to the FED projection, will be XNUMX%, but according to the market, only about XNUMX% (the second dashed green line).
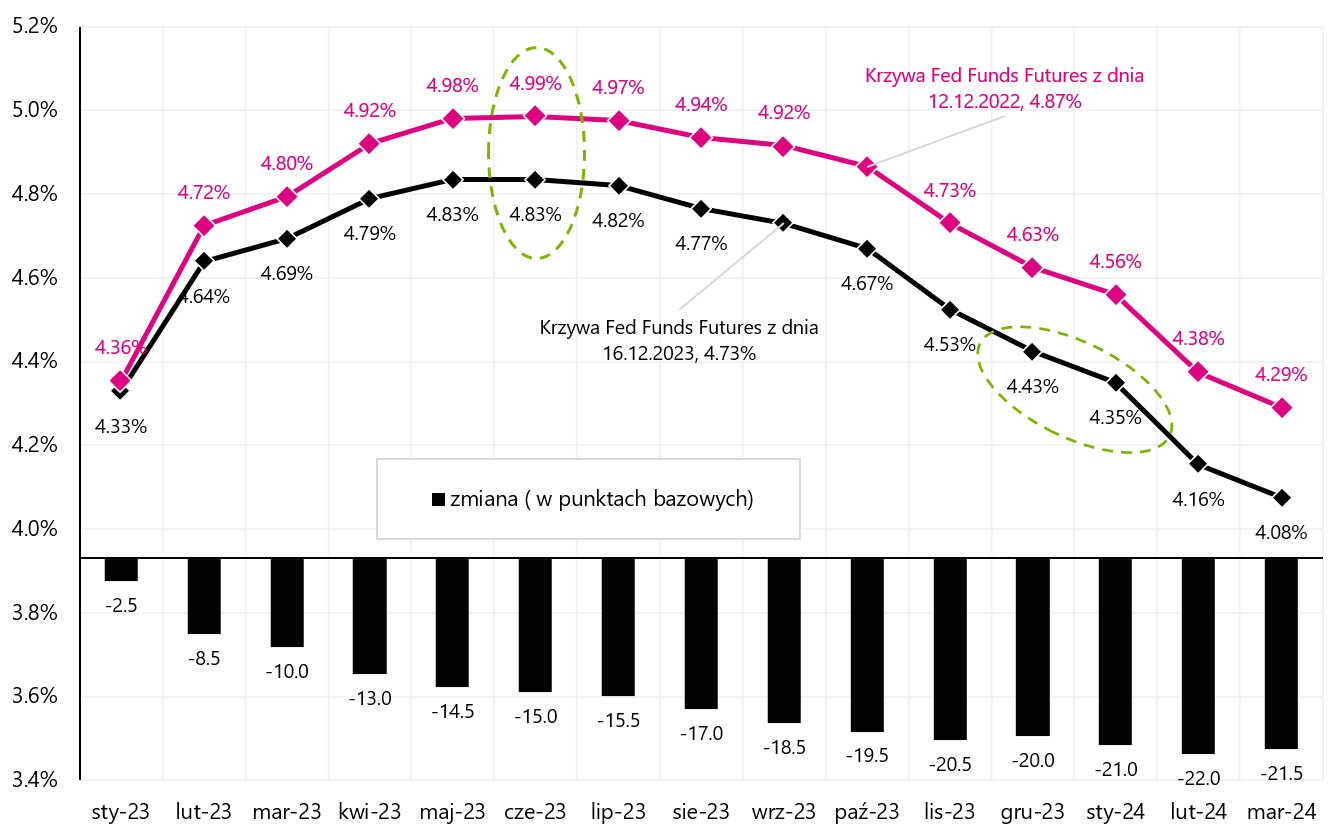
W.14 Term curves Fed interest rate futures contracts-u (30 day Federal Funds Futures). Source: own study, CME
The Fed is much more hawkish than the market. Why? Because The FED is fully comfortable fighting inflation and will continue to fight it no matter what recession it has to cause. In the fight against inflation, there is a rule that the longer we keep interest rates at a restrictive level, the greater the chance that we will defeat inflation permanently (or that it will not return to higher levels as it did several times in the 70s).
I would expect the FED (and other central banks as well) to be relatively more hawkish, at least as long as they are comfortable fighting inflation. The "comfort" will exist until such circumstances occur that will force rapid interest rate cuts. What we mean by comfort today: good markets and good labor (and economy) – even if we are looking at indicators lagging in the cycle (as opposed to looking at leading indicators which suggest slowing down and falling inflation).
The good condition of the markets and the economy is as follows: the S&P 500 is "only" 19,7% up from 16% a few days ago, the unemployment rate has increased only 0,2 pp above the low of the cycle (or to 3,7% from 3,5. 2,9%). US GDP increased by 3% in Q2022 4 and according to the forecast of the Atlanta GDPNow model it will increase by 2022% in Q2,8 15.12.2022 (model forecast according to data as of December XNUMX, XNUMX).
Conclusions for investors: don't fight with the FED. Without some big event in the markets or the economy, it is hard to expect a real FED pivot before 2024. Without a real FED pivot, it's hard to expect a real bull market in stocks.
USA: the labor market is not going to slow down? Only for now
The labor market is the key to defeating inflation through lower wage growth and finally a smaller contribution of salaries to the cost of services, which should mean lower prices of services and, finally, lower core inflation of services.
Currently, there is an interesting discussion about whether the labor market is really as strong as the Current Employment Statistics Survey (establishment survey) shows. From March this year according to this survey, we had almost 2,7 million jobs growth, while the second Current Population Survey (household survey) indicates that there was no increase in the number of employed people in this period (we wrote more about this in previous report). The matter has a chance to be clarified during the revision of historical data by the BLS (Bureau of Labor Statistics) next year.
A significant downward revision in the number of jobs is indicated by an analysis published last week by Philadelphia FED. Such an analysis can provide more accurate job estimates because it is based on more accurate quarterly data (rather than the monthly data on which BLS estimates employment levels). In return, it is quite delayed, because currently the Philadelphia Fed can only give us more accurate estimates until June 2022. However, according to this analysis in the period from March to June this year. the increase in jobs was 10,5 thousand, instead of the official BLS data of 1,047 million jobs. While data revisions will explain the difference in employment between the two surveys, they will be in the "distant" past, so the markets will not attach much importance to it.
What counts for the markets is the current state of the labor market a the sooner the labor market "ruptures", the sooner we can count on the actual bottom on the stock market. And we receive the most up-to-date data in weekly reports on the number of unemployment benefits, especially initial claims. And according to the latest report, the labor market has no intention of slowing down. Initial claims fell in the week ending December 10. up to 20 thousand The chart below shows the details.
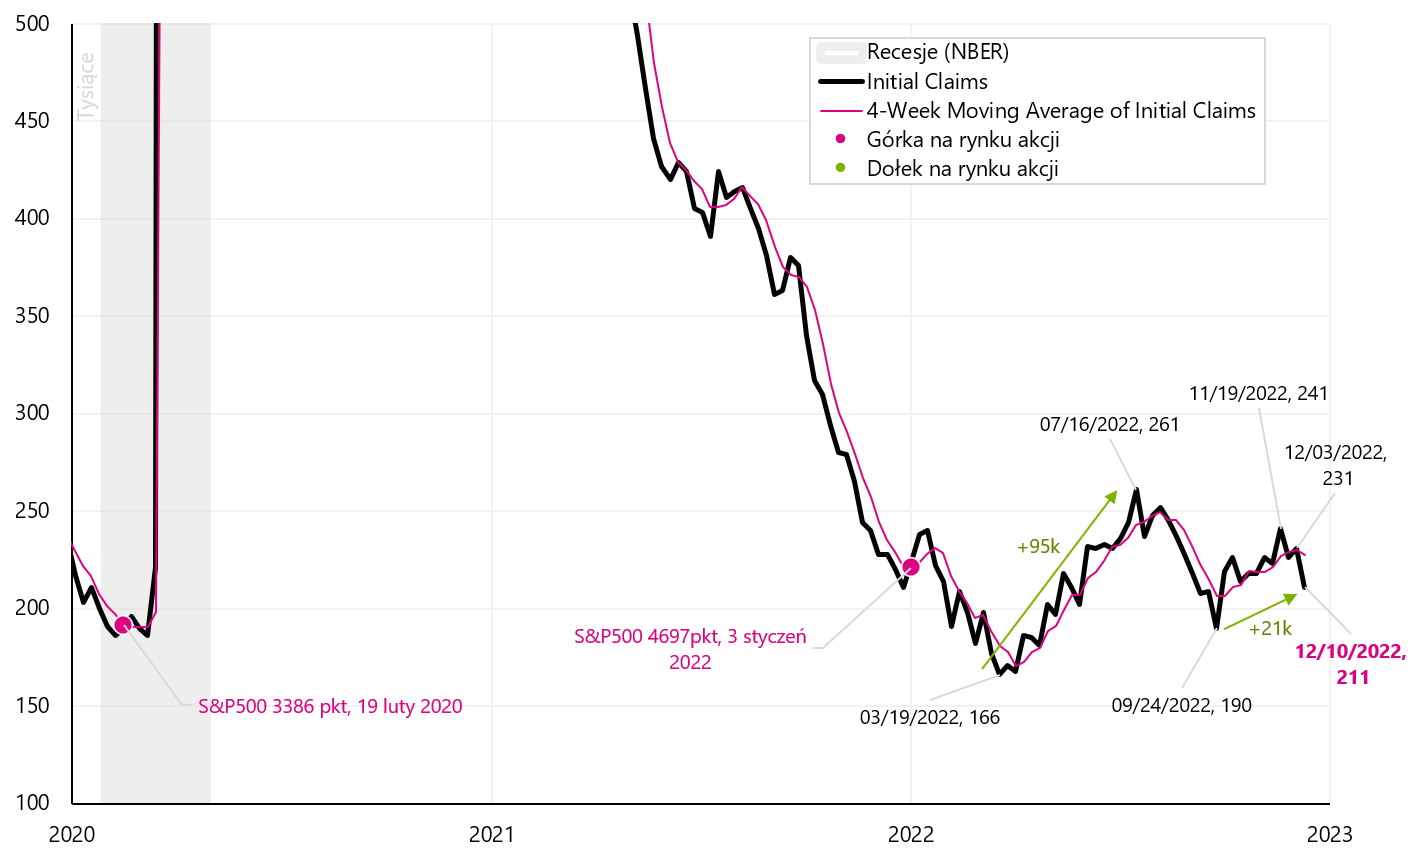
W.15 Number of first-timers unemployment benefits. Source: own study, FRED
If historical analogies were to hold true in the current cycle, then to think about the low of the S&P500, the number of benefits should increase to about 300-350, which is still about 90-140. from today's level. The next chart shows when historically we had lows on the S&P500 in previous cycles.
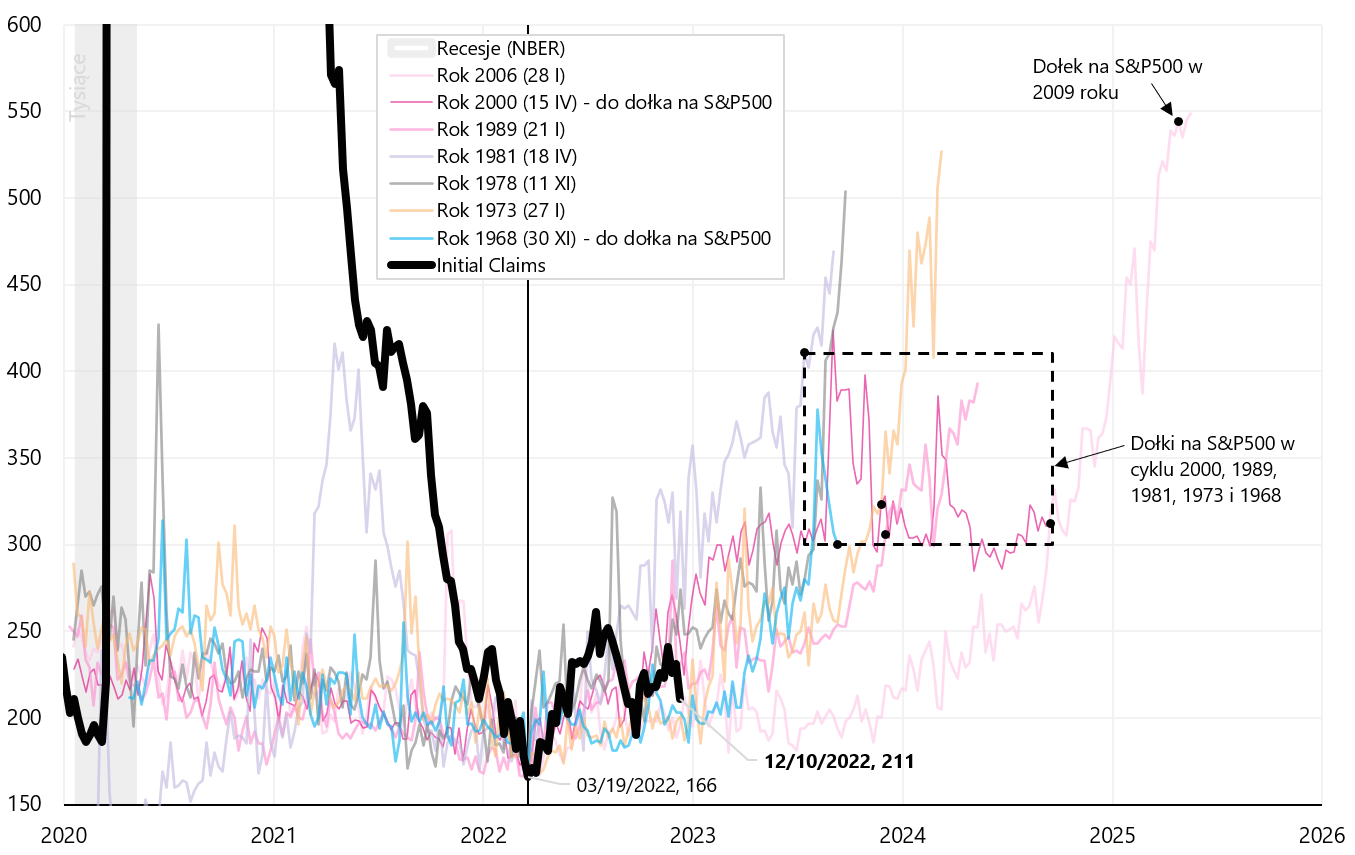
W.16 Number first-time unemployment benefits and holes on S & P500 during previous unemployment cycles. Source: own study, FRED
PMIs point to a further slowdown
Last week we got to know the preliminary PMI indices for December (preliminary PMI readings are published by S&P Global, while the US ISM does not publish preliminary data).
In Europe (Eurozone) PMI industrial index increased from 47,1 to 47,8 points in December this year. (at most for 2 months). On the other hand, the services PMI increased from 48,5 to 49,1 points (the highest in four months). A slight improvement in both indicators is a good sign, but it does not change the overall picture of the European economy.
S&P Global also gave its own preliminary US PMI. The manufacturing PMI fell to 46,2 pts in December from 47,7 pts in November and it is the lowest in 31 months. On the other hand, the services PMI fell to 44,4 pts in December from 46,2 pts in November and it is the lowest in 4 months. S&P Global in his commentary, to a sharp decline in new orders. In general, such readings indicate a stronger slowdown in the US economy (which we will see in real data in a few months).
If ISM Manufacturing were to fall by 3 points in December this year, (publication on January 4, and such a possible drop is suggested by the preliminary US PMI S&P Global reading - see the chart below), it could even have an impact on the S&P500.

W.17 American ISM manufacturing and US PMI Manufacturing S&P Global. Source: own study, ISM, S&P Global
Summation
Last week was very important and informative in terms of monetary policy of central banks in 2023 (even in conditions of strongly falling inflation).
Investors could enjoy lower-than-expected inflation in the US for a while, but a day later they got to know the strongly hawkish message of the FED. What is important in terms of developments in 2023, The FED intends to fight inflation even at the expense of recessionat least as long as circumstances allow it (you can call it "comfort" in the fight against inflation). AND without a real "pivot" of the FED, it is difficult to expect a real bull market in stocks.
About the Author
 Jaroslaw Jamka - Experienced fund management expert, professionally associated with the capital market for over 25 years. He holds a PhD in economics, a license of an investment advisor and a securities broker. He personally managed equity, bond, mutli-asset and global macro cross-asset funds. For many years, he managed the largest Polish pension fund with assets over PLN 30 billion. As an investment director, he managed the work of many management teams. He gained experience as: Member of the Management Board of ING PTE, Vice-President and President of the Management Board of ING TUnŻ, Vice-President of the Management Board of Money Makers SA, Vice-President of the Management Board of Ipopema TFI, Vice-President of the Management Board of Quercus TFI, Member of the Management Board of Skarbiec TFI, as well as Member of Supervisory Boards of ING PTE and AXA PTE. For 12 years he has specialized in managing global macro cross-asset classes.
Disclaimer
This document is only informative material for use by the recipient. It should not be understood as an advisory material or as a basis for making investment decisions. Nor should it be understood as an investment recommendation. All opinions and forecasts presented in this study are only the expression of the author's opinion on the date of publication and are subject to change without notice. The author is not responsible for any investment decisions made on the basis of this study. Historical investment results do not guarantee that similar results will be achieved in the future.


