


The worst forecast for the stock market since 2008.

After 2008, the shares encountered numerous difficulties. Each time, however, they returned to new record highs as a result of endless political action, primarily from central banks. Due to quantitative easing and lower interest rates, central banks have led - it is now clear that an unsustainable investment boom in the energy market, which was unable to pay itself back, to large-scale US buy-back programs and even higher valuations of growth companies.
Check it out: Brokers offering CFDs on stocks - Summary
Last year, the Sino-US Trade War began to cause disruptions in supply and slowdown in economic growth. In the first quarter of 2020, the global economy fell victim to the outbreak of the COVID-19 pandemic, which led to both a supply (China isolation) and demand shock (isolation in many other countries), and a war on oil prices between Russia and Saudi Arabia began which could significantly harm the US oil industry and global investment in general.
Such enormous uncertainty and imbalances have not occurred globally since 2008. Because stock prices reflect future and growth prospects, they are most vulnerable to the current crisis. Investors are desperate to escape and realize huge long-term profits.
Under the worst-case scenario, the S&P 500 index could drop to 1
Over the past few months, investors have had a foretaste of what awaits us. Subsequent countries introduced isolation, hospitals were more and more burdened, and demand for some products and services dropped sharply. The three most important questions for investors are therefore:
- How much will corporate profits fall?
- What will be the profit multiplier during the crisis?
- What shape will the economic recovery take?
Due to the fact that pandemics of this type are extremely rare, all forecasting models for GDP can be thrown away. Instead, we undertook to develop two types of GDP paths. The first one assumes a slight shock leading to 0% GDP growth, followed by a rapid reversal of the trend in the upward direction. The second one predicts a 4% decline in economic growth over the next few quarters, followed by a slow recovery that will not translate into a growing trend. Many market participants believe in the baseline scenario. However, given the dramatic measures introduced in Europe and the possibility that COVID-19 will prove to be a seasonal phenomenon, the consequences can be much deeper and long lasting.

Based on data since 1954, we can assume quantile regression on quarterly changes and calculate the logarithm of earnings per share on a series of data on GDP growth. Both of our GDP paths assumed by us give the following profit paths per share:
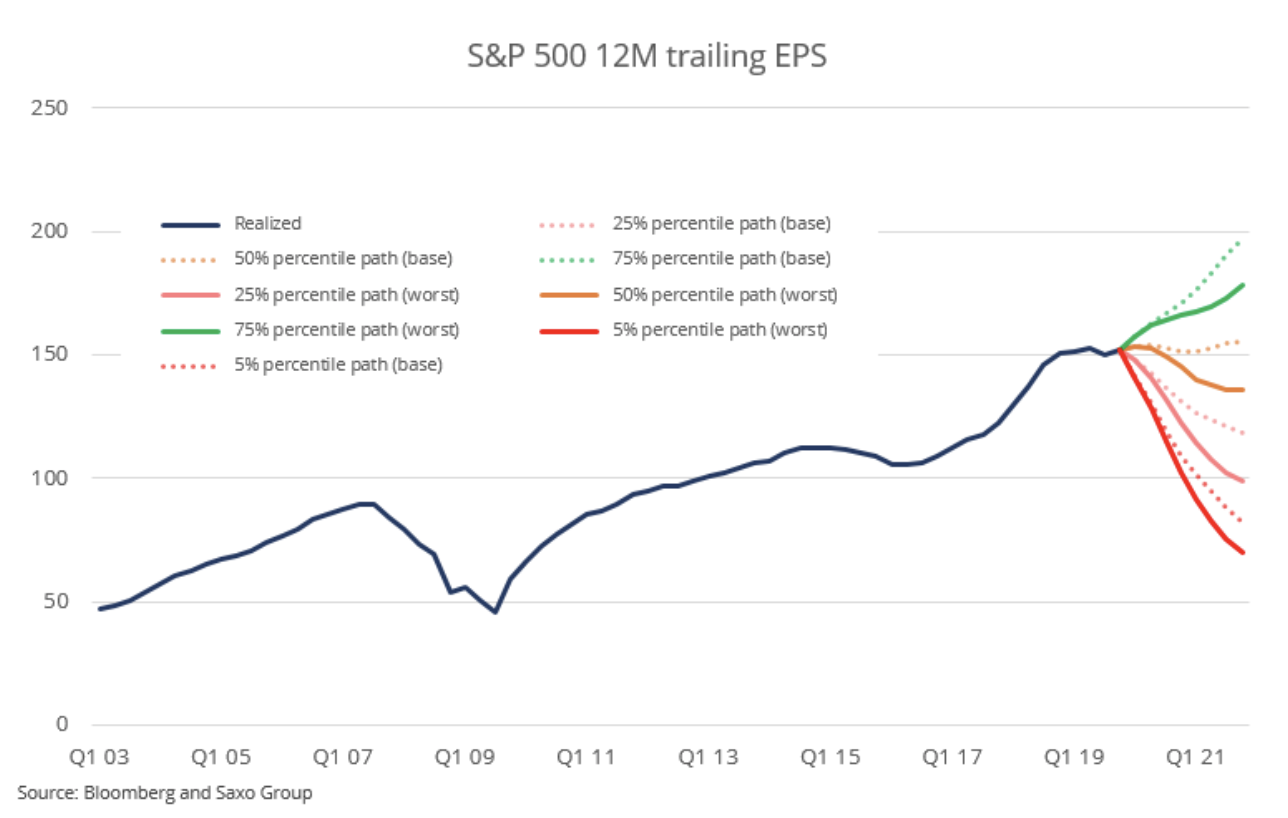
Given all the unknown variables associated with the COVID-19 pandemic, we tend to adopt the 25% percentile as more likely than the median paths in both scenarios. If we take the average of both scenarios ending in 2021 regarding profit per share for the S&P 500 index, we get $ 108,61, which is 28% below the current earnings. If we assume that the price / earnings ratio (P / E) drops to 15 points - which is a reasonable assumption given the level of profitability and the previous crisis - the S&P 500 index may drop to 1 600. These calculations are by no means precise and not accurate. they should be relied upon uncritically because too many variables are characterized by too much uncertainty. However, the above exercise is to present investors with the scale of the deterioration in the worst-case scenario.
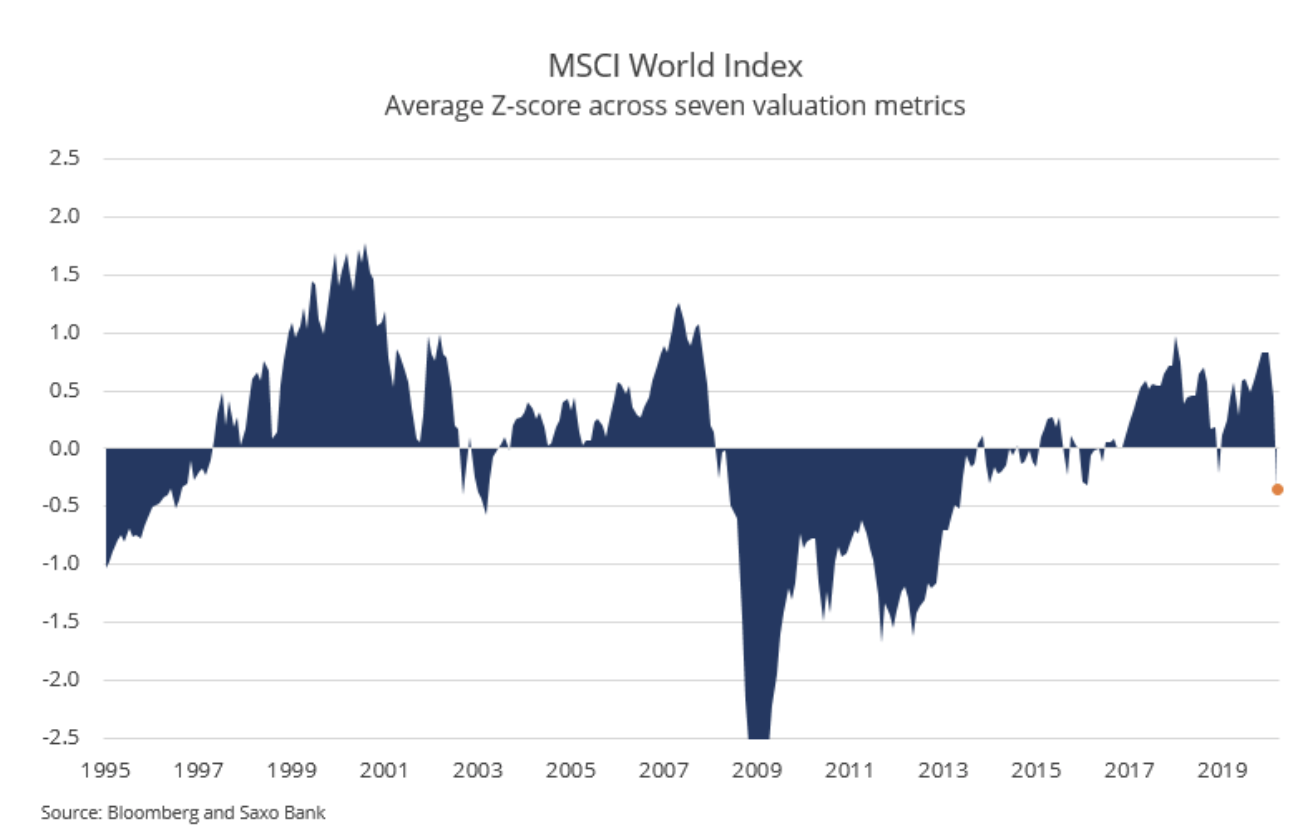
The current decline in global stock prices has brought valuations from the standard deviation of 0,84 (expensive) to the standard deviation of -0,35 (cheap), before the denominator (profit, sales and cash flow) decreased. This valuation picture means a significant possibility of further falls in the stock market. When the global stock market reaches the standard deviation of -1, investors should start increasing their investment in shares.
We are in a phase where policy makers provide the economy with many stimuli, including various loan programs from governments and the extension of tax payment deadlines (in fact, a change in cash flow over time). After two panic interest rate cuts through Fed to 0,25%, all major central banks now have zero rates. In our view, these incentives may improve moods and asset prices. However, as more economic data are released, investors will realize that more resources are needed and stock exchanges will go down again. Policy makers traditionally lag behind the curve.
Ultimately, however, the economy will receive enough incentives to regain balance. At this point, stock prices will come to the bottom.
Will the shares of energy companies get out of the abyss?
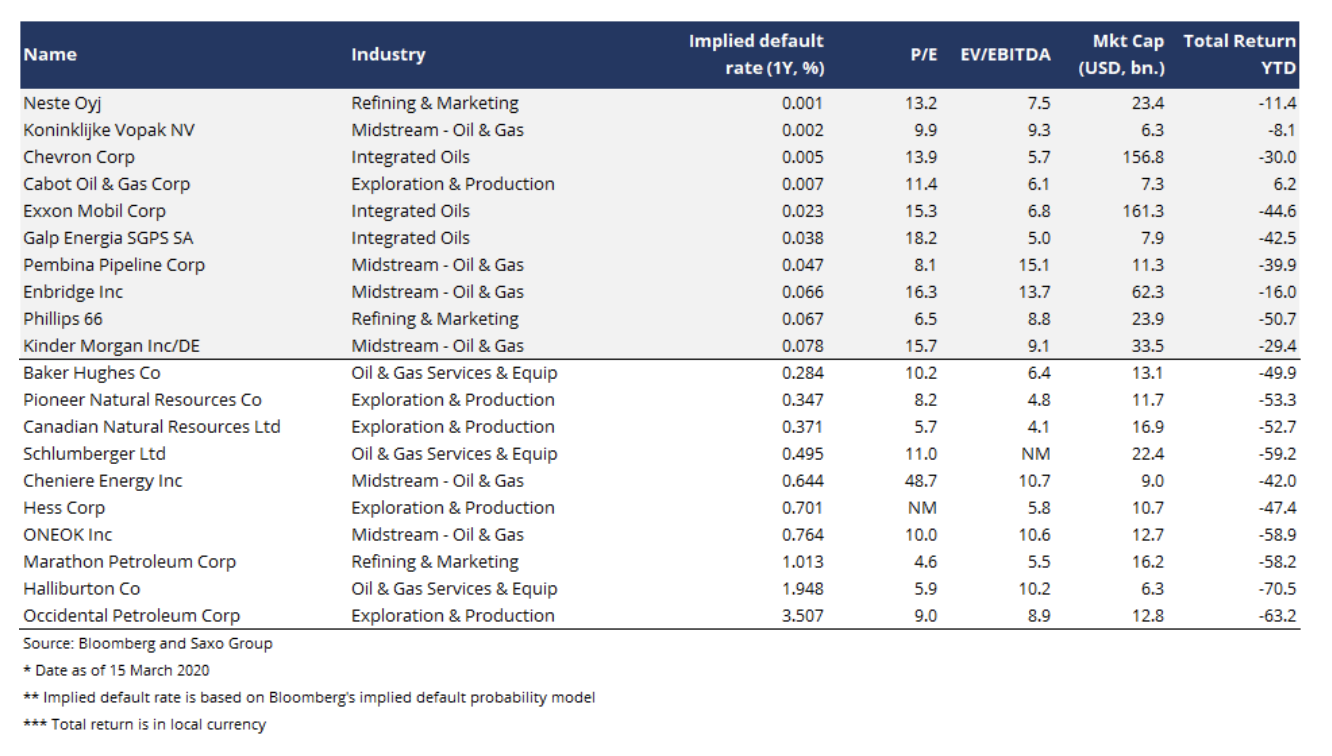
The energy sector has suffered as a result of both the supply and demand shock as well as the war on oil prices between Russia and Saudi Arabia, which could lead to the bankruptcy of many US shale oil producers. During the current US administration, government policy has changed and rescue packages for companies cannot be excluded to protect jobs and investment in the presidential election year. Among energy companies in North America and Europe, US entities recorded the largest increase in the implied probability of bankruptcy.
The energy sector is structurally weak after years of attempts to rebuild profitability and reduce the level of debt as a result of the collapse of oil prices in 2014-2015, thus eliminating some companies from the market will be inevitable. In our opinion, investors looking for exposure to the energy sector should choose the strongest entities and avoid the weakest (inspiration is presented in the list below).
However, even after the economic recovery, the energy sector will have to move away from fossil fuels - which was the theme of our forecast for the first quarter. This means that constant demand pressure on some end products of the oil industry will persist. In the long term, we are confident that the oil and gas industry will not offer excessive value to shareholders in the context of the stock market in the coming decades. Opportunities in this sector will be more tactical and short-term as the next stages of the business cycle pass.
What next for 60/40 wallets and risk parity?
The dramatic volatility and declines observed in the first two weeks of March significantly affected the 60/40 portfolios, and the risk parity portfolios will change the structure of assets investments in the future. Due to the predictions that in 2020 all major central banks will lower rates to zero, bond yields will be low in the coming years.
When the oil price war and the shocks associated with COVID-19 translate into a liquidity and credit crisis - along with the collapse of certain parts of the fund market - those responsible for allocating assets will be forced to include tail risk in their approach. More importantly, however, the portfolios will most likely include components of long volatility (for which the increase in volatility is favorable), because they are the only strategies that are able to realistically protect the investor in such crises.
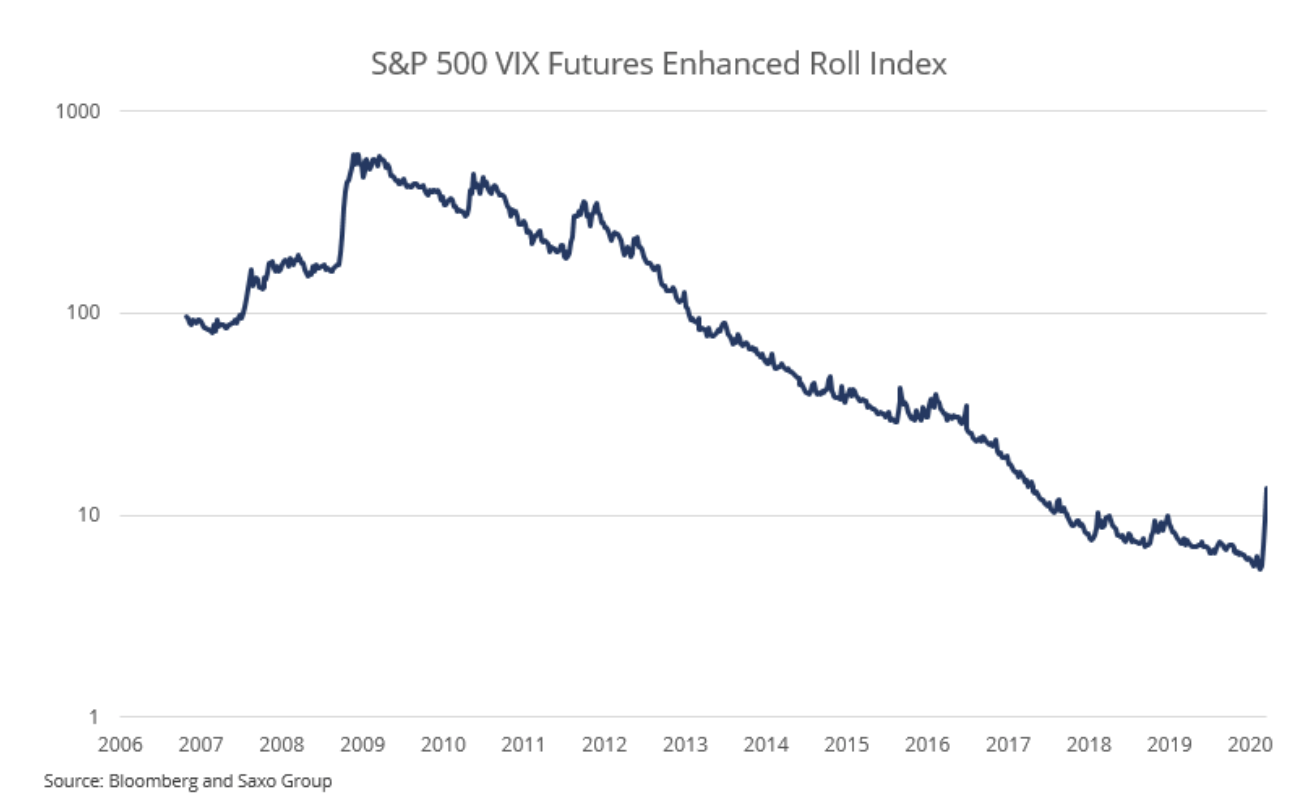
Long volatility can be played in many ways; one of them is the long position in VIX futures and rollover of these positions over time. Because the forward VIX curve is in contango (upward slope), the rollover profit is negative if you keep a long position continuously.
The S&P 500 VIX Futures Enhanced Roll Index has reported the gains and losses on such a position since late 2006. From the market bottom in early March 2009 to the week before the COVID-19 upswing, the annualized gain was -34%. After adjusting the portfolio by just 2% for this type of long volatility strategy, we will have a 0,68% annualized decline in profit in the non-crisis years. In 2008 and in the first weeks of the COVID-19 pandemic, an exposure of 2% would add 4,7% and 3,1%, respectively.
Since such reductions have a disproportionate impact on long-term results, in the context of asset allocation it makes sense to add a projected negative return stream due to its negative correlation in times of crisis.
All Saxo Bank forecasts for download at this address.
Source: Peter Garnry, director of stock market strategy at Saxo Bank


