


Price to Profit (P / Z) - Myths about the most famous fundamental indicator
 - Myths about the most famous fundamental indicator")
Price to profit is one of the most common measures of the multiplier pricing of listed companies. Unfortunately, many individual investors misuse and misinterpret the indicator. In today's article, we will deal with the main myths that linger in the use of the price-profit ratio (P / E, P / E). We invite!
Myth # 1: Low P / E ratio - it's cheap!
This is the most common mistake among investors. A low P / E ratio means that a given company is valued at several times its annual profits. In theory, this may appear to be a market opportunity. However, very often there are reasons behind such low rates. Sometimes it's a classic value trap. At first glance, the company looks very cheap (e.g. it has a P / E of 5), but the company maintains such a low ratio for many years. Among the most common reasons are:
- the company is very cyclical;
- the company's prospects are very weak (shrinking market);
- high inflation;
- high risk of fraud;
- lack of trust in management;
- special situations.
The cyclical nature of the industry can cause a company to be traded at a very low price-earnings ratio for a while. Most often it takes place at the peak of the economic situation, when the company boasts of very good results, but there are already signs of a downturn in the industry. As a result, the market begins to price in the slowdown. As a result, the company is traded at an "attractive" level, but when the macroeconomic situation worsens, profits suddenly worsen, causing the P / E ratio to jump up even if the share price remains unchanged. This situation is a classic value trap that beginner investors can fall into. Cyclical companies include companies operating in the raw materials and automotive industries.
Sometimes the low P / E ratio is due to the fact that the company is valued at a discount to the broad market, but this is due to the fact that investors have already discounted the worsening of the company's prospects. An example may be companies that operate in a declining industry. As a result, the coming years will be increasingly weaker for the company. Falling profits and cash flow will cause the company's valuation to decline. An example of such a company is a company listed on French stock exchange - Eutelsat Communication. In the 2016/2017 fiscal year (end June 2017), the company generated € 1 million in revenues and generated a net profit per share (EPS) of € 477. In May 1,512, the company traded at € 2018. This meant the price to profit at that time was 15,27. This was well below the average P / E for companies listed on the Paris Stock Exchange. In the last financial year (end June 9,90), it generated € 2021 million in revenues and achieved a net profit per share of € 1. The company is currently trading at € 234. This means the price to profit (P / E) is 0,93.
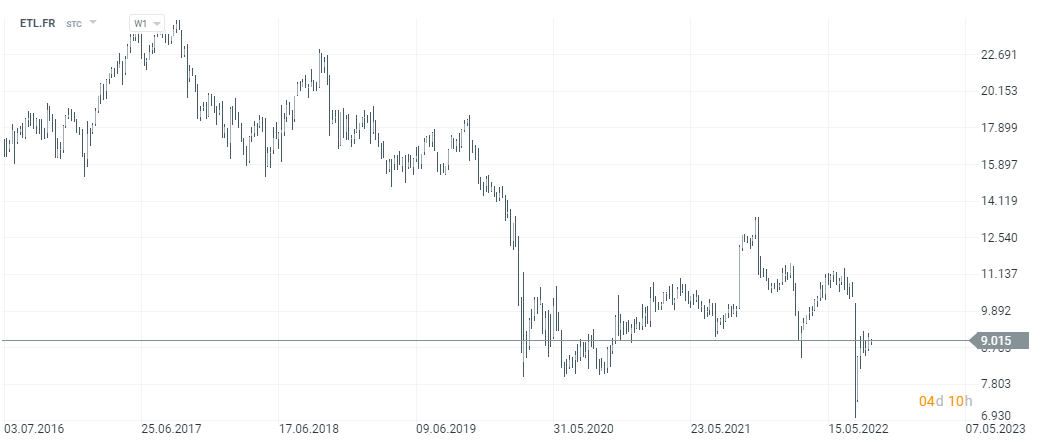
Eutelsat Communication Chart, Interval W1. Source: xNUMX XTB.
Sometimes the low price-earnings ratio is due to the macroeconomic environment. When the economy is struggling with high inflation and the central bank is forced to permanently raise interest rates, company multipliers often fall. A great example is the situation on the US stock market in the period of high interest rates. From 1978 to 1982 the price-profit ratio for the S&P 500 index then it had a single-digit value. The reason was the sharp rise in interest rates in the United States between 1978 and 1981. Looking at the macroeconomic situation is very important for those investing in foreign markets, especially in developing markets.
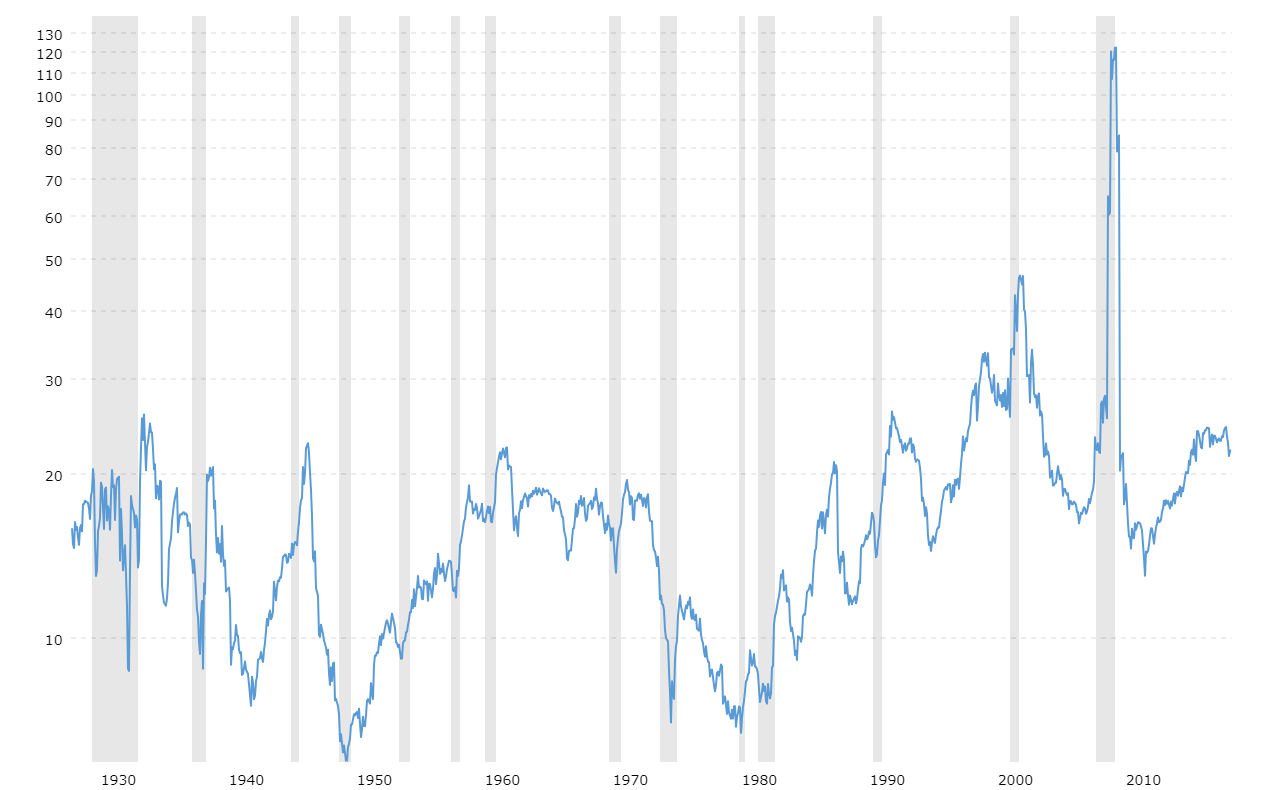
Source: Macrotrends.net
It happens that the low price to profit ratio results from a high discount that the market places on the company. This may result, for example, from the risk of fraud or rumors about creative accounting. Such a discount may result, for example, from the actions of short sellers who publish reports describing the "red flags" they found while analyzing the company. An example is the story of Herbalife, whose stocks fell 20% after being announced by Bill Ackman taking a large, short position on the shares of this company. As a result, the company was trading at a very low (single-digit) price-profit ratio.
Occasionally, a company may be valued at a low price-to-profit ratio due to market skepticism about management's actions. If the main owner has had periods of "cheating" investors in its history, the market usually remembers such situations. For this reason, before investing in a low-price-to-profit company, it is worth screening the board and the main shareholder for their integrity and respect for minority shareholders' rights.
 The special situation results from a special legal or regulatory structure, which means that the company cannot be valued with classical multipliers. One can give as an example Swiss Central Bank (Schweizerische Nationalbank), listed on Swiss stock exchange. As of September 2, 2022, the company was valued at 558 million Swiss francs, while in 2021 the company reported a profit of 26,3 billion francs. This gives a very low P / E ratio. The problem is that the central bank has a different accounting than the "typical" company (manufacturing or service). In addition, the company cannot distribute all profits to its shareholders as it is subject to the maximum dividend level, which is currently CHF 15 per year (6% of the par value of the shares). This is a typical special situation that should be taken into account when valuing a business.
Myth # 2: High price to profit - it's expensive!
This is the reverse of myth # 1. An investor gives up investing in a good quality company because he has a "high" price-to-profit ratio.
Among the most common reasons for the appearance of high price / earnings ratios are:
- a growing company with very good quality business;
- the company is cyclical;
- low interest rates.
Reluctance to buy companies with a high P / E ratio causes investors to lose the opportunity to invest in growing companies that can very well scale their business and care for the profitability of invested capital (ROIC). Of course, not all companies with a high price-to-profit ratio are such, but there are stories of great business rises with a high P / E ratio. An example of such a company is the American Pool Inc. At the end of 2013, the company was trading at a price to profit level of 25,7. It was a value much higher than the market average for American companies. However, between 2013 and 2021, the company's revenues increased by approximately 155%, while the operating profit improved by 400%. At the same time, earnings per share in 2013 amounted to $ 2,10, while in 2021 it was already $ 16,21. An investor with a conservative approach to multipliers would certainly dismiss such a company as "over the road".
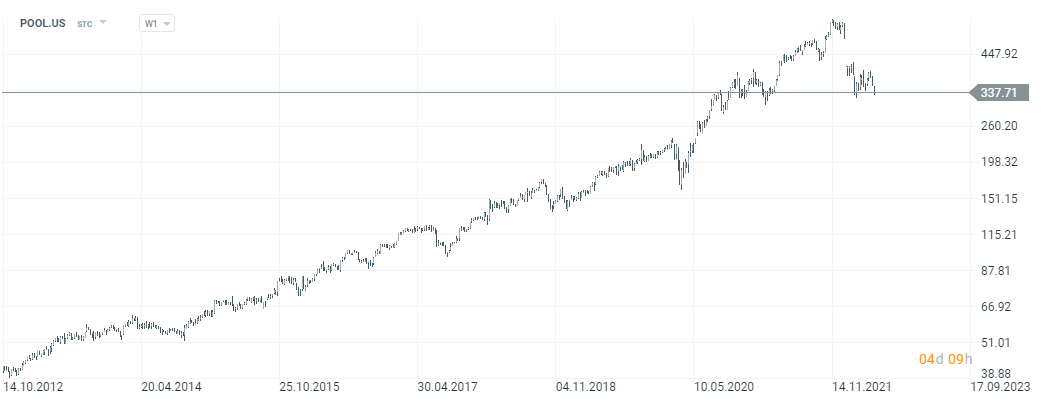
Pool Inc. chart, interval W1. Source: xNUMX XTB.
There are times when a high price / earnings ratio is a temporary phenomenon. This applies, for example, to cyclical companieswhich may generate marginal profits in times of economic downturn. In such a situation, the company may have a high price to profit ratio, even if the rate has already dropped several dozen percent. Sometimes such a "price-wise" company can be an investment opportunity.
Occasionally, low interest rates have contributed to the increase in the price-earnings ratios of listed companies. The low interest rate environment causes yield hunting to occur. Asset management companies, pension funds and investors are looking for opportunities to achieve higher rates of return, which causes asset prices to rise significantly. As a result, the inflow of capital to the stock market causes an increase in the price-earnings ratio of listed companies.
Myth # 3: Negative price to profit - avoid investing in such companies!
Another myth that lingers with many investors is rejecting immediately companies with a negative price-to-profit ratio. A company that generates losses is not always doomed to bankruptcy. Sometimes it is a deliberate decision of the board that wants to grow "at any cost". In this case, the generated revenues can be used to acquire new customers, expand the product offer or improve logistics (e.g. in e-commerce companies operating in the asset heavy model). An example of such a company is Amazonwhich in 2014 generated approximately $ 89 billion in revenues and reported a net loss of $ 0,03 per share. However, the losses were not due to a weak business model, but due to the company's emphasis on product development. R&D spending alone increased by $ 2013 billion between 2014 and 2,7. In 2021, Amazon generated revenues of approximately $ 470 billion and earnings per share was $ 3,30. Occasionally, negative earnings per share can be found in cyclical companies that are in the lows of their business cycle. In such a situation, an investment in this type of company may turn out to be a market opportunity, as the company's financial results may improve rapidly in the coming years.
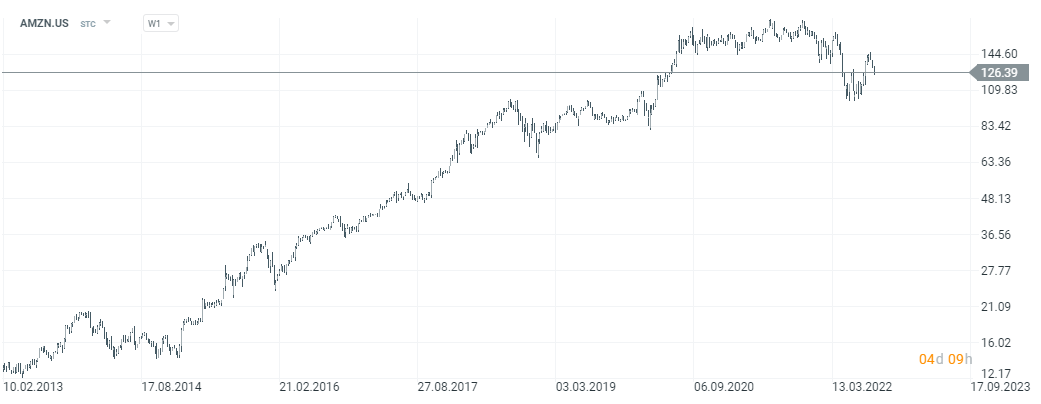
Amazon chart, interval W1. Source: xNUMX XTB.
Myth # 4: The price-profit ratio is a universal tool
Such thinking is a very big mistake because the indicator is based only on historical values. In turn, the behavior of the share price concerns how the market evaluates the future (both near and far). Another problem with analyzing companies for the price-earnings ratio is that enterprises are at different stages of development. Companies in the initial phase need a lot of capital to build their scale, therefore they do not focus on profitability itself, but on business growth. For this reason, such companies may have high price / earnings ratios or negative ones. In turn, companies operating in the declining industry either use a strategy of not investing, but generating the highest possible profits and returning them to shareholders, or changing the business model (entails high costs). The price / earnings ratio is also useless in this situation.
Another problem is that the indicator is on average suitable for comparing companies from the same industry but operating in different countries (different taxation) or have a different age structure of assets (especially important in the case of production companies, where depreciation plays a high role) or a different structure of asset financing. In the case of depreciation, let's imagine companies A and B. Both generate PLN 100 million in revenues and have operating costs (except for depreciation) and financial costs at the same level. However, company A spent PLN 20 million last year on the construction of a modern production plant. The plant will be financed by debt at a cost of 5% per annum. After setting the depreciation rate at 20% per annum, the depreciation costs suddenly increase by PLN 4 million. Thanks to the construction of the plant, the remaining operating costs are to decrease by PLN 3 million annually over the next 10 years. In turn, company B has an old machine park and does not intend to invest in new technological solutions. As a result, the company's operating costs will grow by 0,25 million annually. For the sake of simplicity, the CIT rate was adopted at the level of 20%.
| company A (million) | year 0 | year 1 | year 2 | year 5 | year 10 |
| revenues | 100 | 100 | 100 | 100 | 100 |
| operating costs (excluding depreciation) | 80 | 77 | 74 | 65 | 50 |
| depreciation | 0 | 5 | 5 | 5 | 0 |
| interest costs | 0 | 1 | 1 | 1 | 1 |
| gross profit | 20 | 17 | 20 | 29 | 49 |
| net profit | 16 | 13,6 | 16 | 23,2 | 39,2 |
| the number of actions | 10 | 10 | 10 | 10 | 10 |
| EPS | 1,6 | 1,3 | 1,6 | 2,32 | 3,92 |
| share price | 16 | 16 | 16 | 23,2 | 39,2 |
| multiplier | 10 | 12,31 | 10 | 10 | 10 |
Source: own study
As you can see, the investment in the production plant decreased the net profit in the first year by as much as 15%, to the level of PLN 13,6 million. If the stock price did not change, the multiplier pricing of A's shares would be higher than B's shares. This could give the wrong view that A's shares are "more expensive" than B's shares.
| company B | year 0 | year 1 | year 2 | year 5 | year 10 |
| revenues | 100 | 100 | 100 | 100 | 100 |
| operating costs (excluding depreciation) | 80 | 80,25 | 80,5 | 81,25 | 82,5 |
| depreciation | 0 | 0 | 0 | 0 | 0 |
| interest costs | 0 | 0 | 0 | 0 | 0 |
| gross profit | 20 | 19,75 | 19,5 | 18,75 | 17,5 |
| net profit | 16 | 15,8 | 15,6 | 15 | 14 |
| the number of actions | 10 | 10 | 10 | 10 | 10 |
| EPS | 1,6 | 1,58 | 1,56 | 1,50 | 1,40 |
| share price | 16 | 15,8 | 15,6 | 15 | 14 |
| multiplier | 10 | 10 | 10 | 10 | 10 |
Source: own study
Summation
As you can see, the price-reward ratio, despite its popularity, has many disadvantages. Moreover, there are many myths about the use of this indicator. Many first-time investors looking for companies in a "fundamental" way are afraid to "overpay" and therefore look for companies with low P / E ratios and avoid those with "high" or "negative" price-earnings ratios. This is a basic mistake, because the indicator itself does not tell everything about the company, its prospects and the quality of the management staff. There is no one-size-fits-all price-earnings ratio that tells you that a stock is cheap or expensive. It all depends on the industry in which the company operates and specific factors (the company's development phase, debt, development prospects, etc.).

, i.e. an indicator of consumer confidence")

 - Myths about the most famous fundamental indicator")
 - Myths about the most famous fundamental indicator")


