


Smart Money Concept – trough and peak. What is Pullback?

W previous article about Smart Money Concept (SMC) we focused on identification the last candle in motion, the so-called OSR. This is a very important SMC structure due to subsequent trend setting. This time we will focus on the importance of troughs and peaks in the trend.
At SMC we do not take into account some movements due to their low market importance. The filter we use to determine important high and low places in a trend is pullbacks.
READ: Smart Money Concept – an introduction to investment strategy
Pullback, that is "Kick Out and Return"
Not every trough and peak that the market presents to us is important. IN “classic” method of understanding the trend, there is a certain belief that we are dealing with a trend when:
- in an upward movement, each subsequent high and each subsequent low is higher than the previous one,
- in a downward movement, each subsequent low and each subsequent high is lower than the previous one.
In connection with the theory described above, it would be enough to classify individual lows and highs in a given movement and observe their breakouts to determine what trend we are dealing with and for how long. From the perspective of the smart money concept, not every peak visible to investors trading according to "retail" trading is an interesting bottom or an interesting peak. We will filter this place using a structure called pullbacks. To determine the pullback, we need OSR - i.e. the ability to determine the last candle in the movement. Therefore, if you did not manage to practice finding the last candle in the impulse, go back to the previous article to catch up. Okay, so let's talk about what this pullback is. As the name says, it's a movement that "something" it strikes and comes back. Tim “something” there is the last candle moving. Let's look at the pullback pattern in an up and down move.
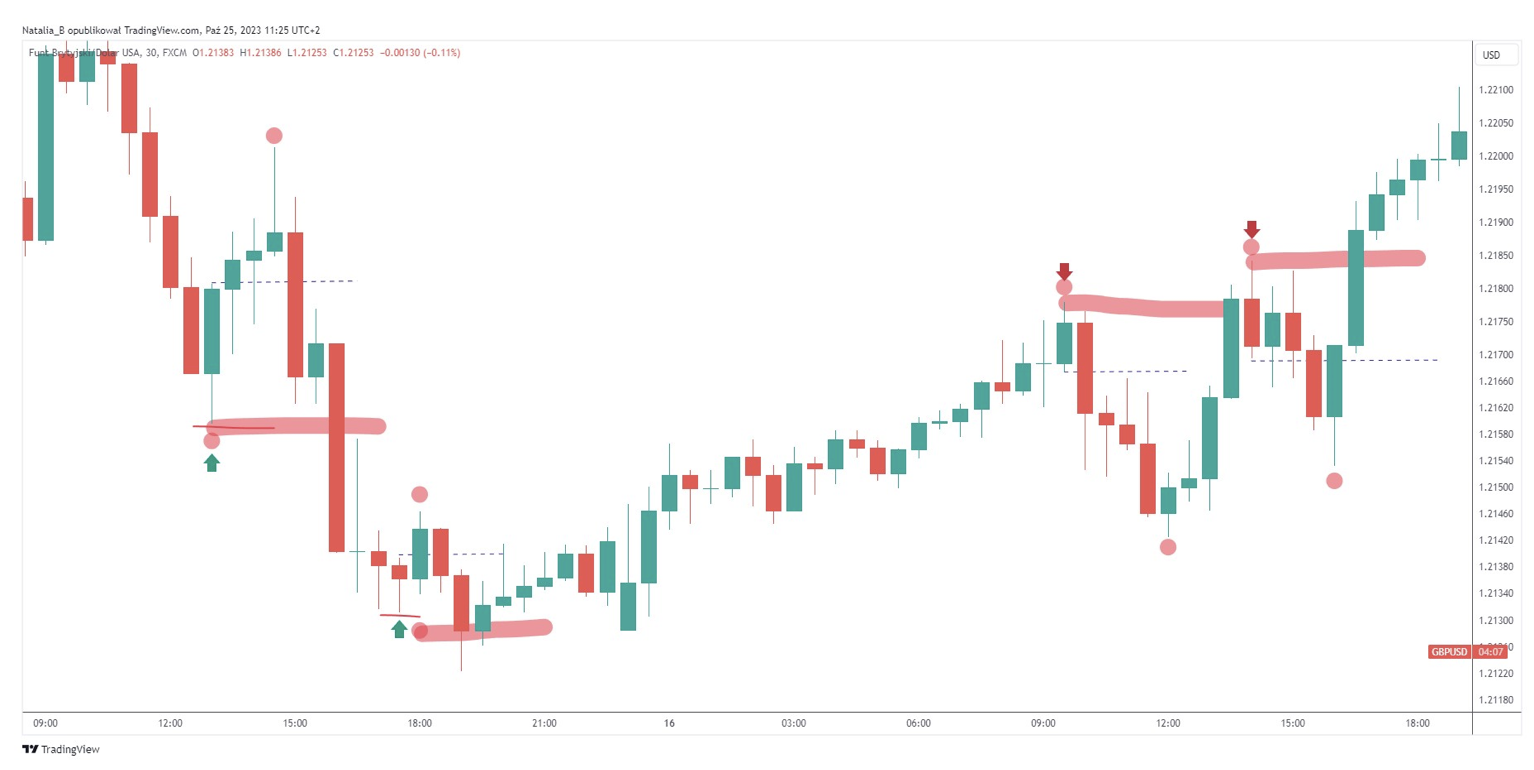
An example of a pullback on a chart. Source: platform TradingView.
In the chart above we have two examples of very nice pullbacks, both in a downward movement (looking from the left) and in an upward trend. I will first discuss the situation marked with green arrows. These indicate the last candle moving in a downward impulse. To be able to say that we have a pullback of this candle her high must be broken. The pullback lasts until the low OSR is broken, i.e. the beginning of creating a new impulse. High OSR is marked with a horizontal dashed line, and the end of pullback is marked with a red dot. Analyze these two examples carefully. Now let's move to the right side of the chart, where we have a pro-growth situation. Here, the last candle in the movement is indicated by a red arrow. To talk about pullback, we pay attention to the low break of this candle. If it is broken, we talk about a full OSR pullback. So what conditions must a pullback meet?
- we mark the last candle in the impulse,
- we check whether its low/high (depending on the move) is broken,
- it can be stamped by the body or wick, the color does not matter.

Why do we need pullback?
If the last candle in the movement has no pullback, we cannot talk about the formation of a trough and a peak in a given impulse. In other words, it is simply a move in a given trend. At SMC, we only pay attention to lows and highs that have been tested with pullback. Without understanding this phenomenon, we will never correctly determine the trend structure.
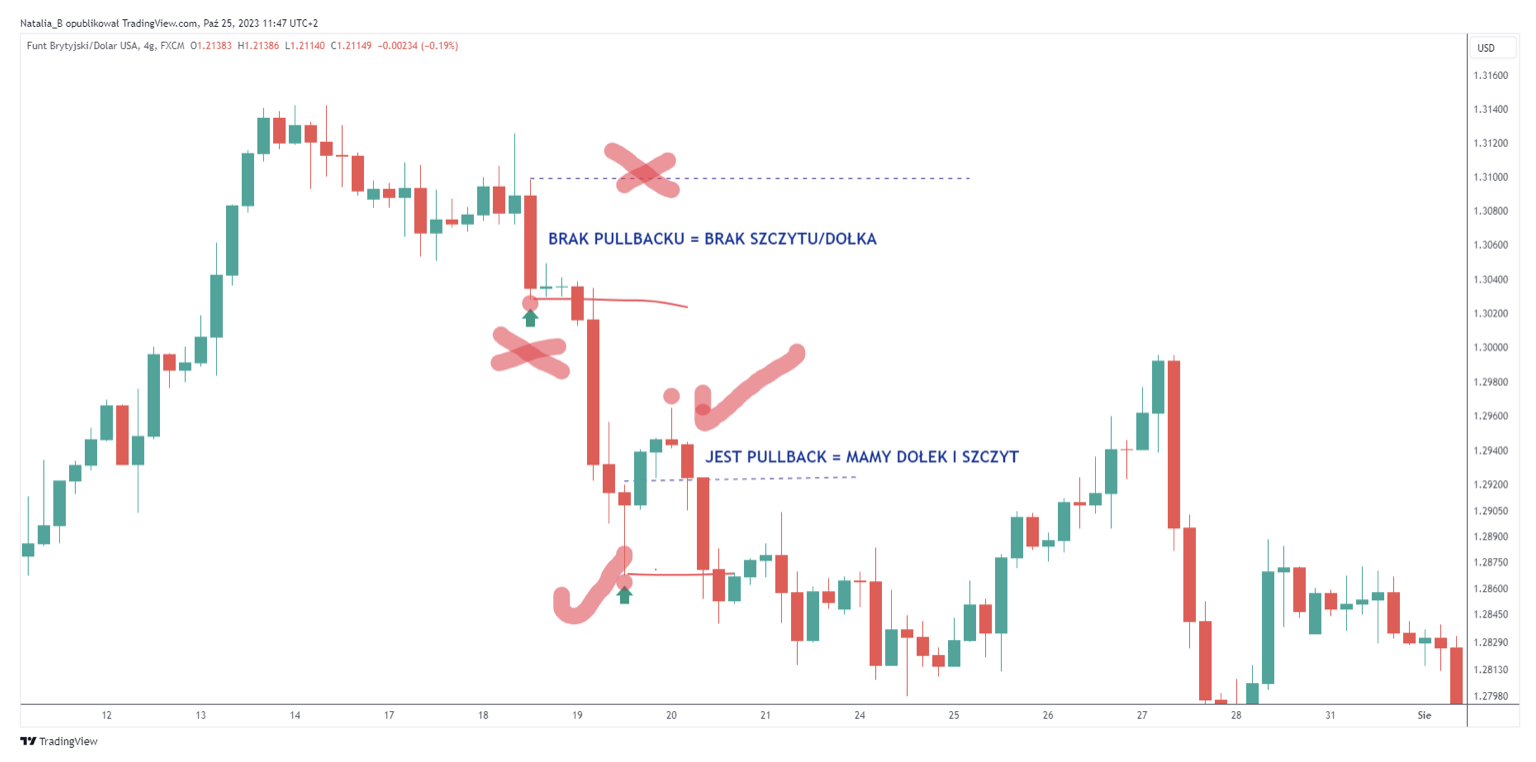
How to correctly identify pullback on a chart. Source: platform TradingView.
This can be simplified to the graphic above. In the first situation marked "X" the last moving candle (marked with a green arrow) has no pullback. Its price high (horizontal dashed line) has not been tested. Even though our eye “sees correction” – these few green candles after the OSR actually do not appear there from the SMC perspective, neither the bottom nor the top in the downward movement. Moving lower to the situation marked with "birds", we have the last candle in the impulse marked with a green arrow. Its high price has been broken and the impulse continues (a new low has been broken). There was a full pullback here. On such a correction, we can mark a peak at the maximum price and a trough at the OSR minimum price.


Leave a Response