


Smart Money Concept – Trend structure

I devoted the previous two entries to this identification of the end of the impulse, the beginning of the correction and a phenomenon called pullback, which allows us to determine whether we are dealing with a peak or a trough. Understanding the previous two articles is intended to help you identify the trend structure, which is today's topic of this post. The structure of a trend is "something" without which we cannot talk about it Smart Money Concept (SMC). Any search for demand and supply zones, inequalities between them, order flow or order block will require us to efficiently navigate the trend. An old stock market proverb says:
“The trend is your friend.”
And let's stick to it!
Trend structure
In the trend structure, we will distinguish several symbols that we will put on the chart. They will be helpful in determining when are the best places to enter the current trend and the precise place of its reversal. Let me first explain all structures in a theoretical way, and only then we will translate it into a schematic and real diagram.
Remember!
To be able to properly identify the trend structure, you need knowledge about troughs and peaks, which appeared in the previous article. To determine the trend correctly we need:
- SS – a quick top (we mark it in a downtrend, it is an OSR with a pullback of this candle),
- SD – a quick low (we mark it in an upward trend, it is an OSR with a pullback of this candle),
- ST – the top of the trend (in an upward movement: we determine it only after the SD pullback, then we mark KT on it, in a downward movement: ZCT will lie on it),
- DT – the bottom of the trend (in a downward movement: we mark it only after the SS pullback, then we mark KT on it, in an upward movement: ZCT will lie on it),
- ZCT – change in the nature of the trend (the place after which the body breaks through, the nature of the trend changes from e.g. upward to downward and vice versa),
- KT – trend continuation (the place after which the body breaks out the current trend continues).
My previous article (part two) was about pullback, which you can find here HERE. However, we talked about the pullback of the last candle in the movement. So let's say whether there is currently a pullback breaking out SS and SD. I have attached two diagrams below.
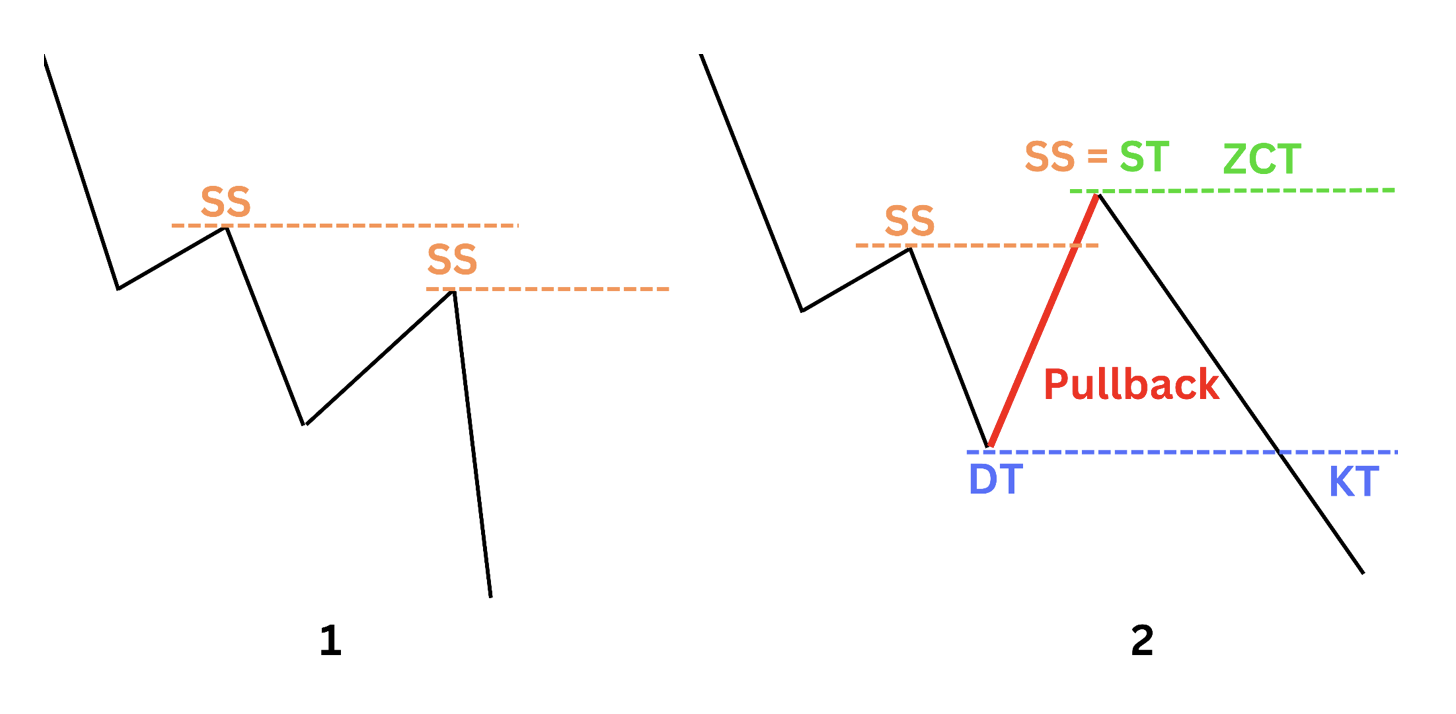
Note that a pullback (in the future it may also be called a quick pullback) is also called a market pullback (red traffic in the picture with example no. 2) making a lower low but a higher high (I'm only talking about a downward movement!).
Let's start with a simple example marked with the number 1. This is a "classic" trend. Each subsequent low and each subsequent high is lower than the previous one. If the last candle moving in a downward impulse has a tested high price (pullback OSR), we can place SS on such a high. Until the latest SS is broken (as in the second example), we cannot consider a given peak as the top of the trend. It is simply a peak in the impulse in a given trend leg, but not the most important one (ST) that we are looking for.

Let's take situation number 2 step by step. Many people would see a reversal of the trend on the breakout that I marked in red. Well, after all, according to his general theory, we have another peak that is higher than the previous one. Therefore, the trend turned upward. This is one of the main traps of SMT, i.e. retail plays.
According to SMC, a trend must have a certain pattern to be able to determine its most important points:
- top of the trend,
- trend bottom.
Not every peak and trough is important. So, analyzing the second example, it will look like this:
- strike of the first SS;
- the market goes lower, creates another low;
- returning traffic SS strikes;
- at the bottom of the movement striker (i.e. pullback) we can mark the bottom of the trend - DT;
- DT we mark when a fast peak is tested. DT is also a place continuation of the trend;
- if the market breaks KT, then I mark the peak from which the breakout movement took place as ST - the top of the trend and I put there ZCT - i.e. a change in the nature of the trend.
When it is broken, I consider the latest ZCT trend to be reversed. The above diagram concerns a downward trend. In the upward movement, we will rely on quick lows.
IMPORTANT: KT and ZCT must be minted at full price, i.e. body. Otherwise, when the market "closes" KT or ZCT only with a wick, we are talking only about capturing liquidity. You can find more about the trend structure in the video below and in live trading and weekly charts available on the YouTube channel.


