


Smart Money Concept – an introduction to investment strategy

Smart Money Concept (SMC) is a strategy that will particularly appeal to people who like it naked trading. By smart money, we understand a group of institutions referred to as "big fish" - i.e. investors who are small in number but have large capital. It is a concept that primarily uses two structures: liquidity and trend. In this series of articles, I will show you the basics of SMC step by step. I personally use this strategy with success in proptrading funds for several years.
Wprowadzenie
Let me say a few words here about supply and demand. There are actually a whole lot of strategies (especially in the broad sense price action), which identifies certain places on the chart as supply zone (short orders) or demand (long orders). It is important to distinguish concepts in understanding SMC. They will help you avoid later frustration due to a lower response to the zone and (from a psychological point of view) will save you from creating profitable expectations towards the position:
- demand supply,
- quantity of demand, quantity of supply.
You cannot put an equal sign between them. Demand and supply are simply phenomena that occur at a given price. They can be simplified to a certain scheme:
- at a low price, we have a limited number of sellers and many people willing to buy a given asset - in this case we are talking about excess demand. The price is rising.
- the price increases because more people are willing to buy, so there are more producers (sellers) who feel an interest in selling at a more expensive price - here an equilibrium may occur.
- the price begins to increase even more due to the increasing number of sellers, while the buying side is much smaller when prices are too high - there is a certain "saturation" and imbalance in the form of excess supply (more people want to sell than to buy). The price is starting to fall.
When talking about the volume of demand and supply, we determine the nominal value of these phenomena, i.e. to simplify it even more, we know how much there is. Demand and supply themselves are simply the reactions we expect (upward or downward), while their size (number of buyers/sellers) determines how strong the movements will occur. Therefore, using p/p zones based on the smart money concept, we will look for places where we expect a reaction.
Clean chart
We will look for any SMC structures on a clean graph. This means that the standard smart money concept does not use indicators. The first tools enabling the analysis of basic structures, which I will present to you in this series, have already been created on many online platforms. However, I warn against using them thoughtlessly. Many of them have errors that cannot be detected at the beginning of your adventure with SMC. By the way, believe me that training your eye at an early stage will later result in great proficiency and freedom in moving around the chart. As people connected with my community say – “it's already visible”. That's why I encourage you to train your eyes, at least towards “that vision”.
Why don't we use pointers? The reason is simple. Indicators are mathematical formulas. They show us the broadly understood price passed through specific patterns. Therefore we get hers “milled” picture. So, can we also use regular technical indicators when using SMC? Nobody will stop us from doing this. However, in practice, you may receive signals opposite to those you will see using the smart money concept. We call such plays (resulting from the signals coming from the indicator). retail'sself and/ or SMT (Smart Money Trap). I will show you this as the series develops using specific examples. This does not mean, of course, that every buy signal coming from SMC will be a sell signal on e.g. RSI, MACD or moving averages. This is absolutely not based solely on the inverse, although you will find many examples that may confirm this principle.
CHECK: "Demand and supply strategy in trading" [Book]
What is the Smart Money Concept (SMC) based on?
As I mentioned above, the basics of the smart money concept are based on the trend (its structure) and liquidity. In between, there are many structures that will help us identify inequalities between demand and supply or precisely determine where orders accumulate. The trend is the basis and we never take orders that are opposite to the current trend. The basic structures that we will determine in the trend are:
- fast hole (SD),
- fast peak (SS),
- trend bottom (DT),
- trend peak (KT),
- change in the nature of the trend (ZCT),
- trend continuation (KT).
You may be surprised (or maybe not?), but not every peak and trough in the impulse is important. We will identify them through the ability to recognize corrections and impulses - the basic structures of the trend. In the next article we will look at the precise identification of individual trend structures. Now we will focus on precisely determining when the moment of correction begins. Check out this theory. In a moment I will present it to you with a live example.
- upward trend – continues until a new high price is reached for each subsequent candle,
- downward trend – continues until a new low price is reached for each subsequent candle.
When a new high/low is not broken, the candle with the last high/low is called the candle ORS - the last candle in motion. Why will this candle be so important? I will say a few more words about this in the next article, but here I can only emphasize that without finding the OSR it is impossible to precisely determine the trend structure. It's also worth mastering it well. Here is an example of an up and down movement.
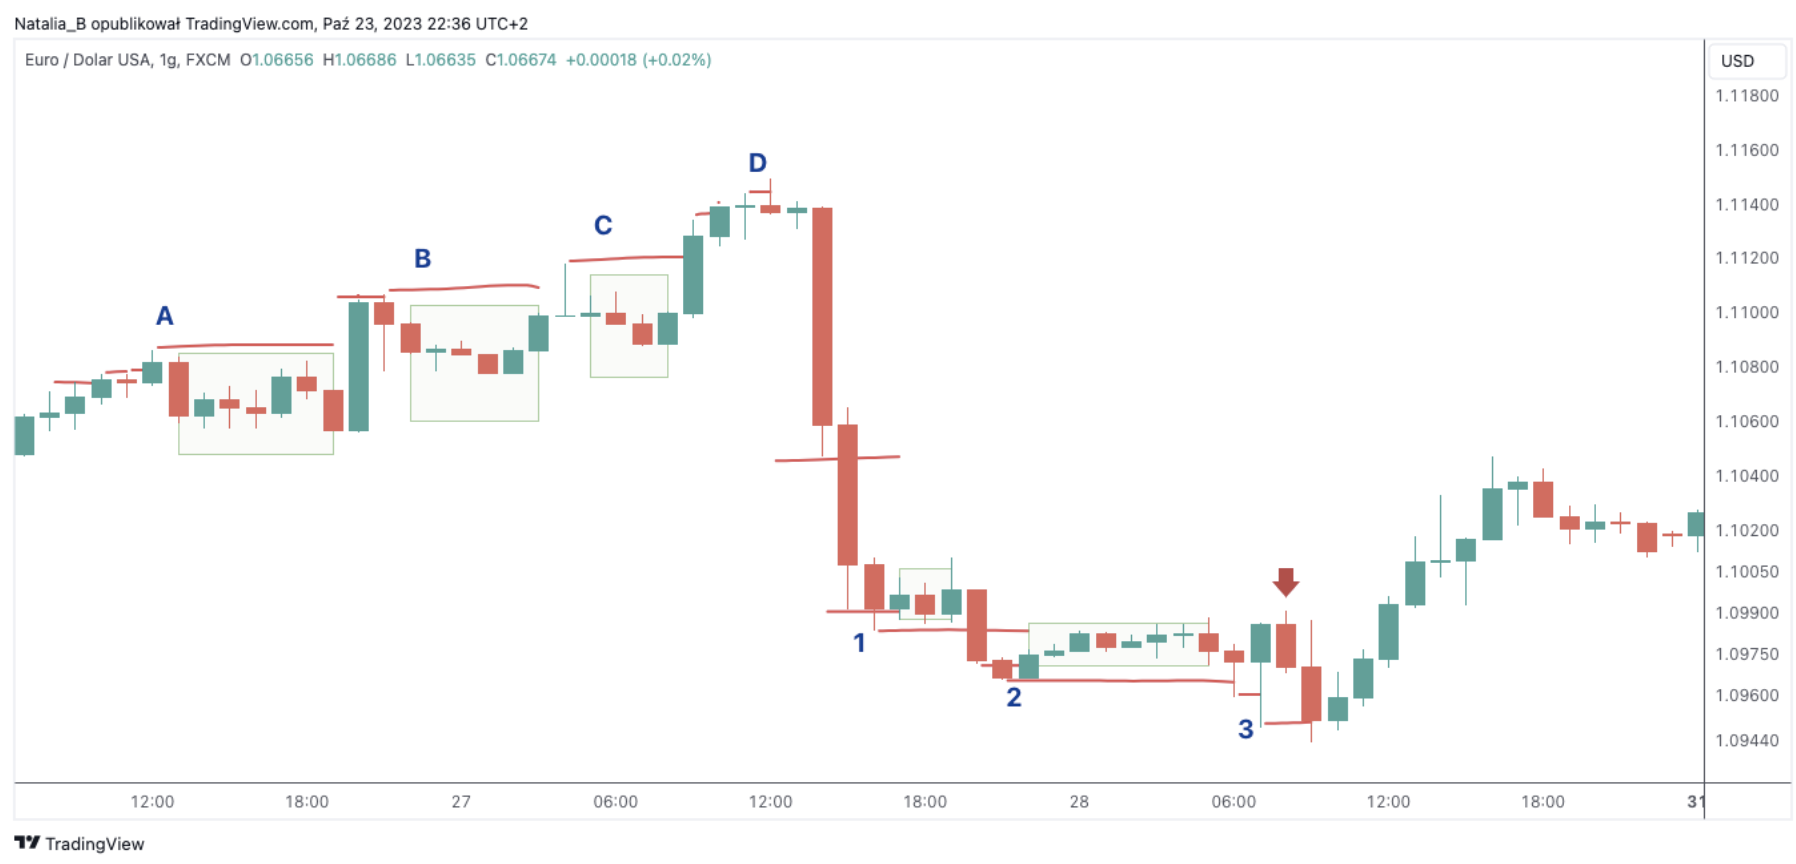
Example of Smart Money Concept (SMC) on a chart. Source: platform TradingView.
Let's start from the left side. We see that each subsequent candle hits its high (we are talking about an upward movement, so we pay attention to the high of the candle). Only a candle marked with a letter A is the last one whose maximum price has not been minted. We'll name her OSR. The area until this price breaks out (which only happens when the big green body does) is the correction area. A similar situation occurs in the case of B. As you can see, the color of the candle marked as OSR has no significance here. The only thing that matters is that the maximum price is not broken. The situation is similar with letters C i D. The high price of the last moving candles is not broken. We are talking about a continuation of the impulse only after it has been minted. The situation is exactly the same in the downward movement. This time we will consider the world marked with numbers. In a downward trend, we will look towards the minimum price - i.e. low. Please note that only in the situation marked no. 1, the low candle is not broken. The green area is the correction area. It is similar in number 2. A new impulse begins after breaking low OSR. One of the most interesting situations is marked No. 3. The green candle with a long shadow is OSR. However, the red candle marked with an arrow following it is a single-candle correction. Notice that the next candle breaks the low of the one from number 3 and continues the impulse.


