


Sokyu Munehisa Homma - the all-time trader - Part II

Theory of "Three Levels of Fluctuation"
This theory is very similar to Goodman's wave theory. In this theory, we draw our attention to the fact that the price never moves directly up or down. It tells us that for each market, the price moves in ten stages, where it alternately rises and then falls.
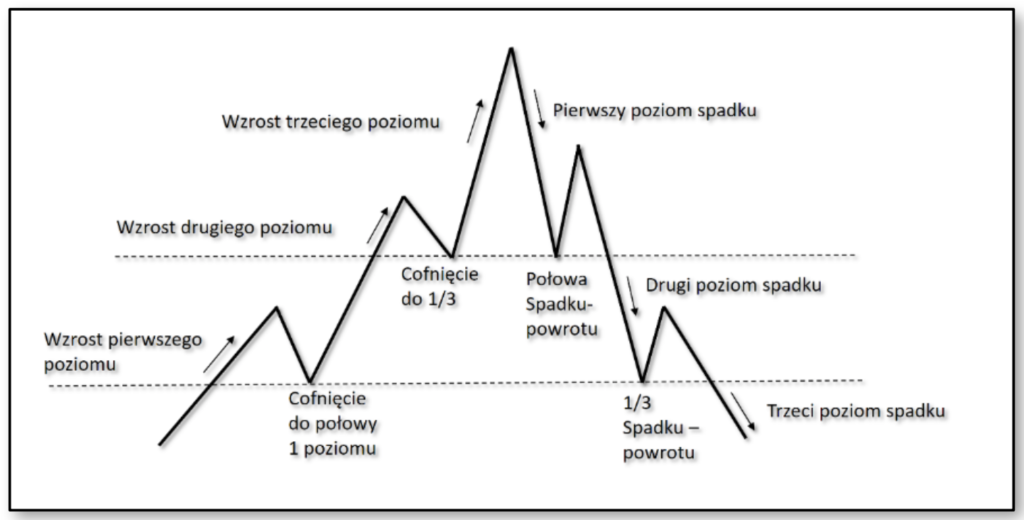
Note the levels this theory is talking about - 1/2 and 1/3. We will talk about these levels in the section describing advanced analysis candlestick charts. Regardless of whether the price is in an upward or downward trend, the moves occur in three levels.
Be sure to read: Sokyu (Munehisa) Homma - the all-time trader - Part I.
The theory of three levels of fluctuation is a Japanese theory, related to group movement and price behavior during the formation of ten elements, the difference in speed in the upper and lower trend and limited reaction. There are many unpredictable situations or circumstances that can distort or complicate our formation - bad or perfect economic reports, stock market crash, etc.
We need to adapt to the coming reality by analyzing many formation shapes and use only those that are most likely to succeed. This is what the candle charts are for. My task is not to predict the exact tops and holes, but to react quickly to confirming their formation.
"When the price makes a fast move, you should react quickly. To do this, you should create peace of mind and silently listen to the sounds coming from the market"- Munehisa Homma.
Japanese obsession with the number three
Since ancient times in Japanese culture, the number three has been considered mystical, that within it there is divine power.
There is a Japanese saying - "Sandome no shojiki" - "Three times lucky". Among other things, that's why "Sakata Constitution" i "Five Sakata Methods"have achieved their mysticism. The magic number three can also be found in Western trading techniques.
We have three types of trend (upper lower and lateral), three trend classifications (main, secondary and small), three types of triangle formation (symmetrical, ascending and descending), the fan consists of three trend lines. For some unknown reason, number three has a permanent and very important meaning in technical analysis.
Very often "Sakata Methods" are presented with the following simple trade philosophy:
- In the upward and downward trend the price will continue to change further in order to stabilize the direction.
- It takes more power to cause a price increase than a downward trend. This sentence is directly related to the saying that the market is falling because of its own weight.
- The market that rises as a result will decline and the market that has fallen will begin to increase.
Five Sakata methods
These methods determine all phases of market price changes.
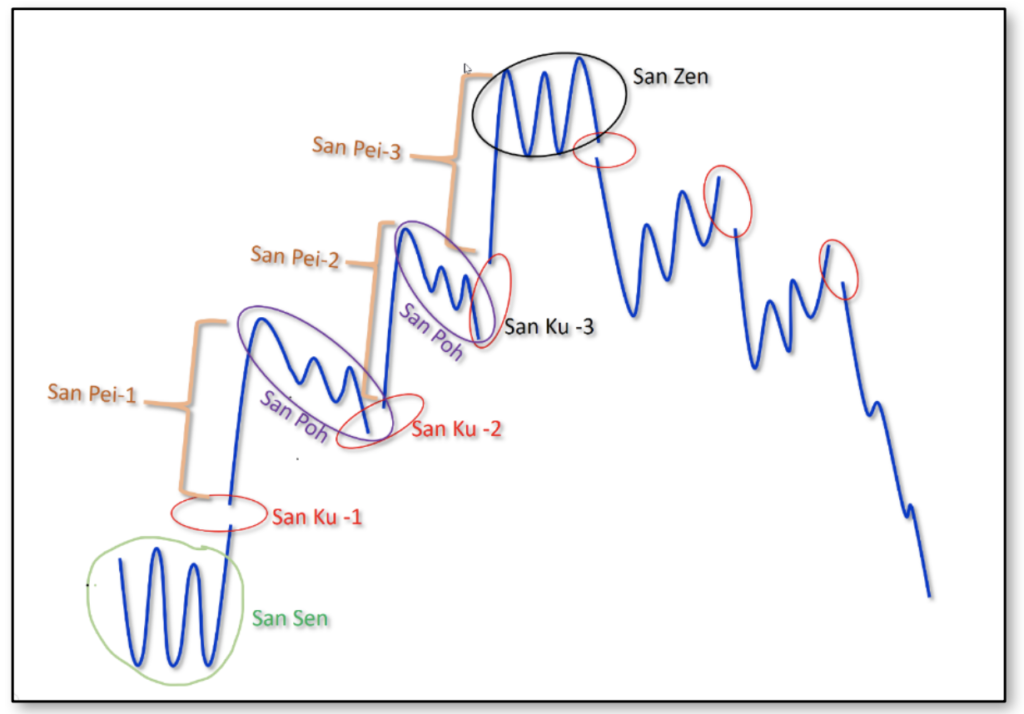
The Five Methods of Sakata consists of five elements:
- San Zan (Three Mountains) - changing the direction of the trend, triple mountain or head and shoulders
- San Sen (Three Rivers) - trend reversal, triple down, or inverted head and shoulders
- San Ku (Three Breaks - Japanese call breaks windows - Three windows), they are in an on-going trend.
- San Pei (Three Lines) - trading during the trend, three lines (candles) at the beginning of the trend
- San poh (Three Pause - Three Methods), a period of consolidation or the rest period of the market, the market makes a triple correction of the time / price relationship.
Each method begins with the word San. The Japanese word San translates as "three".
- The market can only be in one of five phases of the market structure.
- Each of these five market phases has a triple structure.
- Ending the trend requires three windows.
- For a trend to exist, at least three changes are required in the same direction.
- Consolidation is characterized by at least three lines in a given time interval.
Forex is a very dynamic market and works 7 days a week, 24 hours a day. Therefore, the third method - San Ku - occurs very occasionally. Time fluctuates one after another and without pauses, the closing price of one candle is the opening level of the next. Of course, there may be very small gaps, but there will not be three in a given trend.
Brokers disable market access for individual traders from Friday evening to Sunday. The interruption may show up when the broker re-enables access to market data. This break has nothing to do with the San Ku method. Depending on the broker, there may be very minimal differences in the size of several pips.
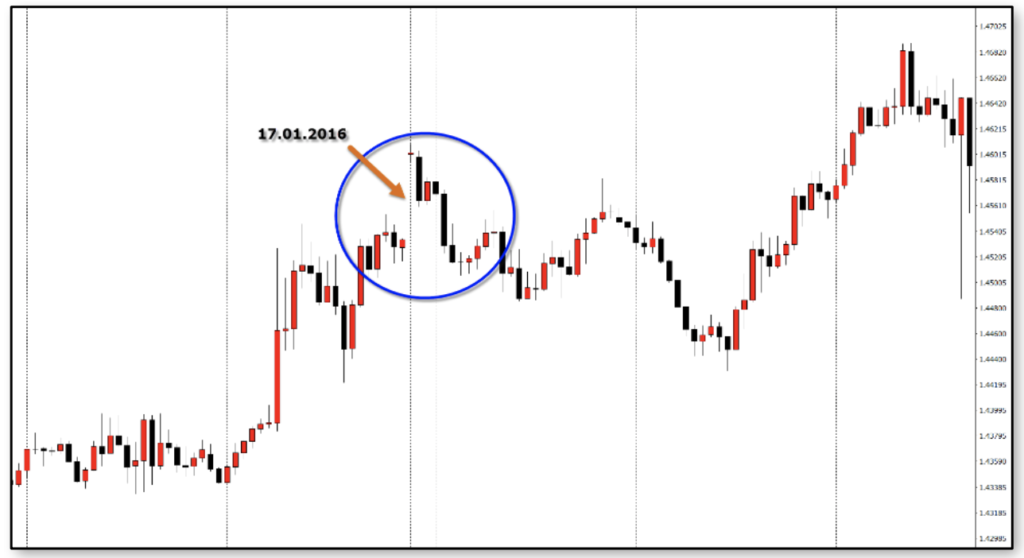
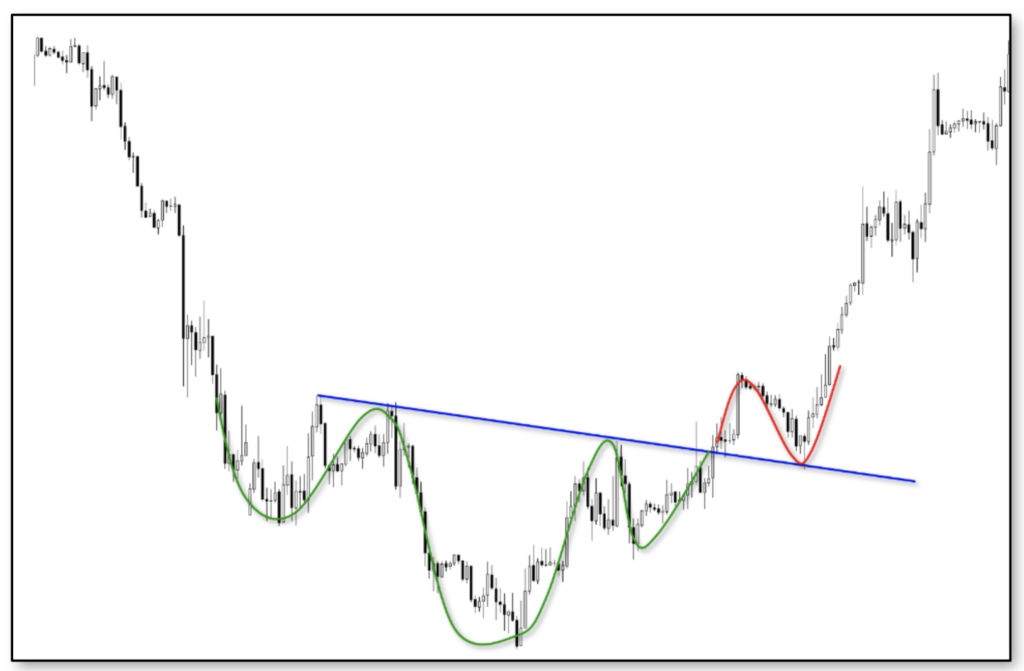
The market after the weekend on January 17, 2016 opened with a 60 pips gap. It was the weekend when negotiations on the withdrawal of Great Britain from the European Union were completed. Graphically presented theory of one phase of the trend according to Sakata Methods. The market cycle is repeated non-stop. Formations show upward and downward trends.
Look at your charts, try to find individual elements of the price change cycle presented above, which were determined many years ago by Japanese traders.
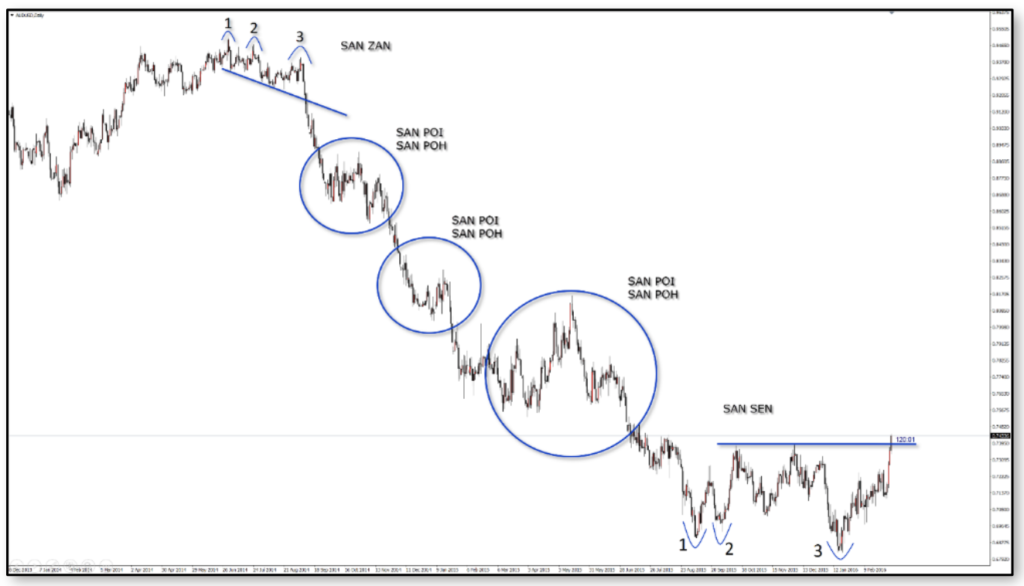
Here is a real example of the full phase of the market. On the daily steam chart AUD / USD, you can see the perfectly complete cycle of one phase of the trend, from the very top to the bottom, through three San Poi and three San Poh.
Each of the five methods, in and of themselves, can be used independently. This means you don't have to use all methods. You can specialize in one of them. It depends only on you whether you will use only one or all methods. It is very important for you to remember that they are trading tactics of the five fundamental market phases.
Munehisa Homma instinctively knew that each of the market phases opens the door to unique market knowledge. We should listen to the greatest trader of all time and remember his teachings. Based on this knowledge, it will be easy for us to determine the tactical opening / closing position. In addition, it will create and strengthen our operating principles.
Each of the five methods defines: the market phase, the trading method and very original rules. To this should be added a precise definition of the formation of candles, which we will talk about later in this book. Each of the five methods is used to confirm each other. Each of the five methods is related to each other. The same applies to candlestick formations. We always use the strongest of them.
Let's look at the rules for opening a position. Here are the key principles:
- Buy or sell a long range after it closes.
- Buy or sell after closing the last window.
- Buy or sell after closing the third subsequent line in the same direction.
- Buy or sell stamp from San Poh.
All these principles are contained in the five Homm methods.
In any case, it will pay attention to subsequent changes: triple up, triple down, a minimum of three windows (breaks) in the opposite direction to our position and of course we can not forget about the trend. After confirming our principles and the situation in the market, we will be able to open a position based on the precise formation of candles.
San Zan - Three Mountains
It is a formation of the Three Mountains. A triple treble or head and shoulders are formed when the market begins lateral consolidation, oscillates in three swings, waves that remain in the lateral range.
 Mountains form when the market changes from a rising trend to lateral consolidation. No price formation is as strong as Three Mountains. Triple treble means that the market is not able to continue the previously chosen trend. It goes into strong consolidation. Even if it does not mean a reversal - it is an indication of very strong resistance. Look at historical data at this level. You will certainly find confirmation of this resistance zone in the past.
The formation of the triple mountain can be found not only in the five methods of Munehis Homm, but also in many Western techniques created by traders. They confirm that the triple treble is a key formation on which we make short sales. For Homma, the triple mountain not only meant sales, but also indicates a certain phase in which the market is. Namely, the upper trend termination phase.
Remember: we want to trade on a triple mountain formation that has already formed, not on a formation that can take place.
An indicator of the end of this formation is a candle with a long body. The long candle bears the Japanese name - Marubozu or Bozu. In western techniques, however, it is called a thrust. In the rest of the book you will learn its details. This is a powerful signal that tells us that the formation of the triple mountain has just finished and we can open a sales position. The hidden power of a long candle is always a surprise for traders. Such a formation was and is recognized as a perfect signal by excellent traders - Gann or Wyckoff. Here it should be noted that in the traditional Japanese trend we trade data from the past and not from the future. Don't forget the theory of three levels of fluctuation. Munehisa Homma only mentions the triple mountain.
Let's now look at examples of real currency pair charts. Price formation, which appears very often not only at the very top, but also during the growing trend. In any case, when this formation is formed, it is worth paying special attention to it.
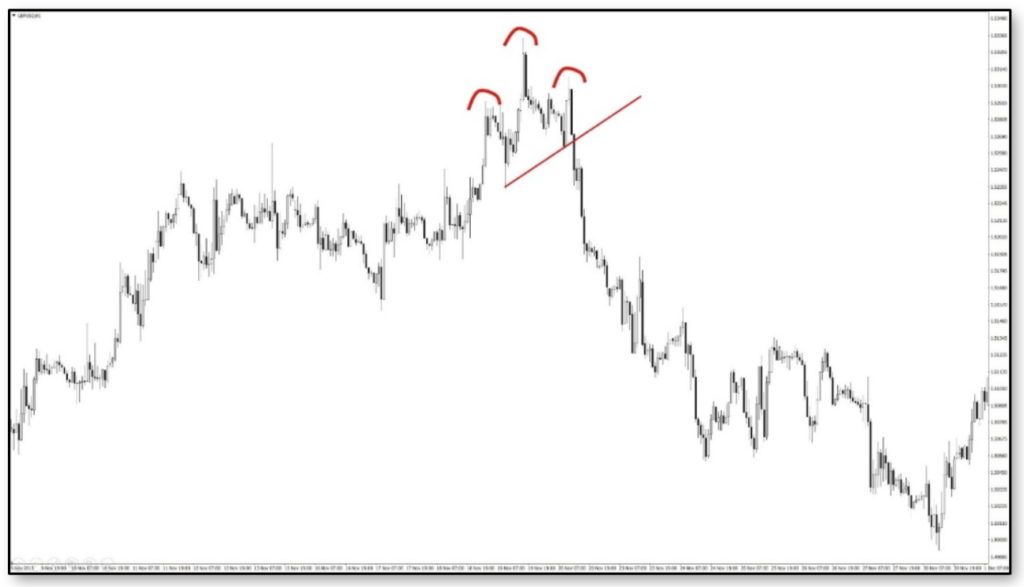
Before the triple high formation, the upward trend moved into a sideways trend and then broke through the previous resistance zone. A quick move up and then a triple attempt at another break was unsuccessful. A long candlestick appeared below the trendline. Extremely long candle Bozu (Marubozu with shadows) indicates the correctness of this formation and at the same time is a signal for a correct, with a very high degree of probability, opening a position.
Opening a short position should occur after closing the long candle below the previously drawn trend line. In the west, the exceptionally long candle that appears after the triple mountain formation has appeared is called a thrust.
The ongoing strong trend loses strength and goes into lateral movement - a triple treble. Each wave ends very quickly with doji formations. The last wave ends with an extremely long candle. This is a clear signal to open a short position. Below the trend line, the price is still trying to go up, but it does not have enough strength to do so. This attempt ends with a massive price drop.
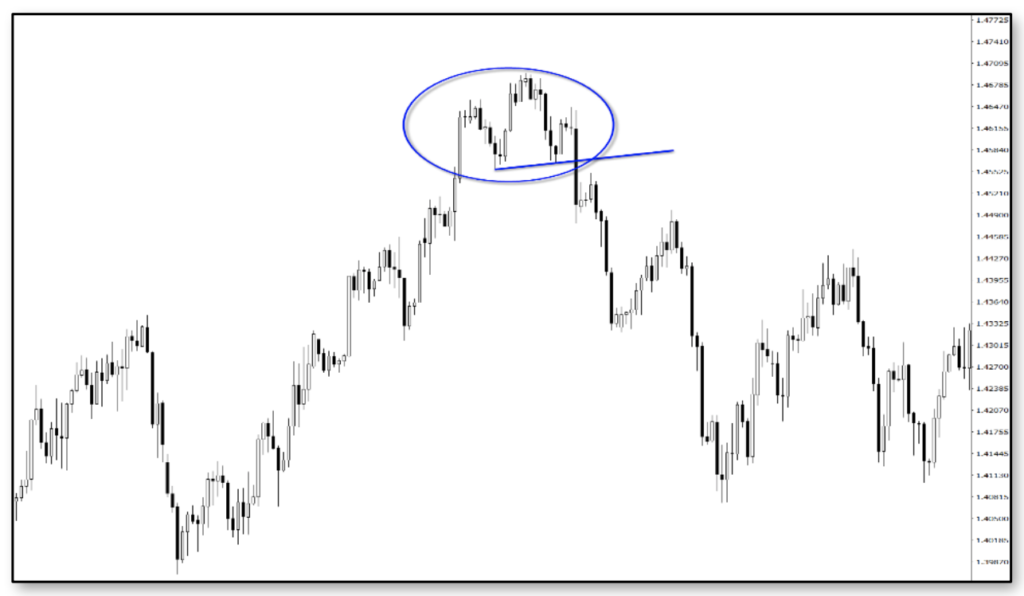
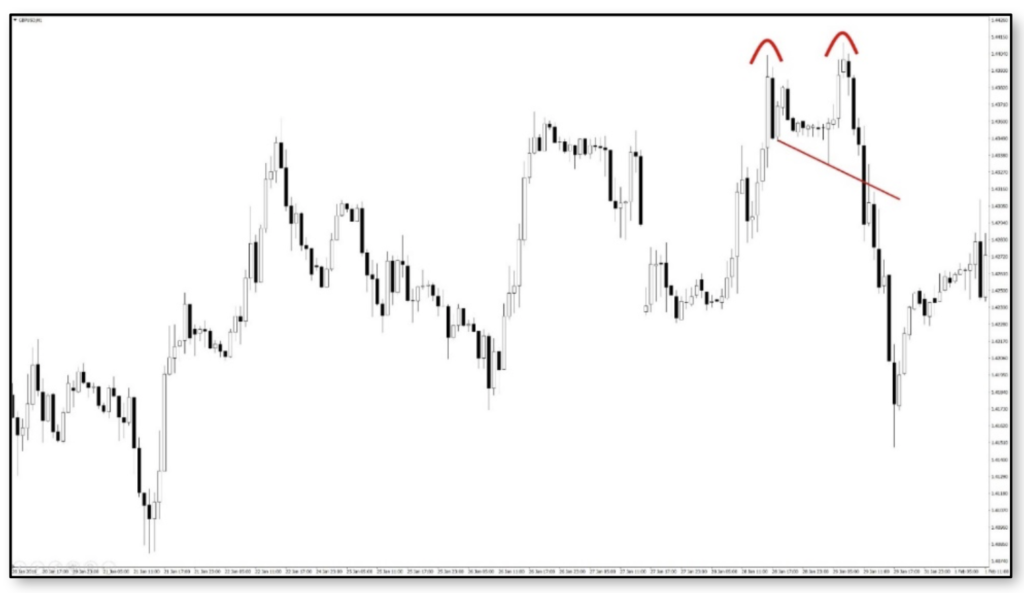
Double top
The double top (capital letter M) is a very common formation on the tops. Here, special attention should be paid to the preceding trend. A double top sometimes is just a formation of a continuation of a trend, and here very often traders make a mistake, because no matter where this formation arises, they try to trade on it, try to open positions in the opposite direction.
To successfully trade on this formation, you need to draw a trend line connecting the inner shoulder lines, this means the so-called Neckline. The sales position should be opened after the candle closes below the trend line. The longer the candle body, the greater the impact on price changes. In Japanese techniques, a very long candle without shadows at the top and bottom is called Marubozu.
In contrast, the same candle with one or two small shadows is called Bozu. The implications of changing trends are basically the same. It is also worth noting how the second mountain is formed. The more the second mountain needs candles, the slower it is created. This means that the impetus is slowly changing direction and is starting to accelerate in a downward direction.
San Sen (Three Rivers)
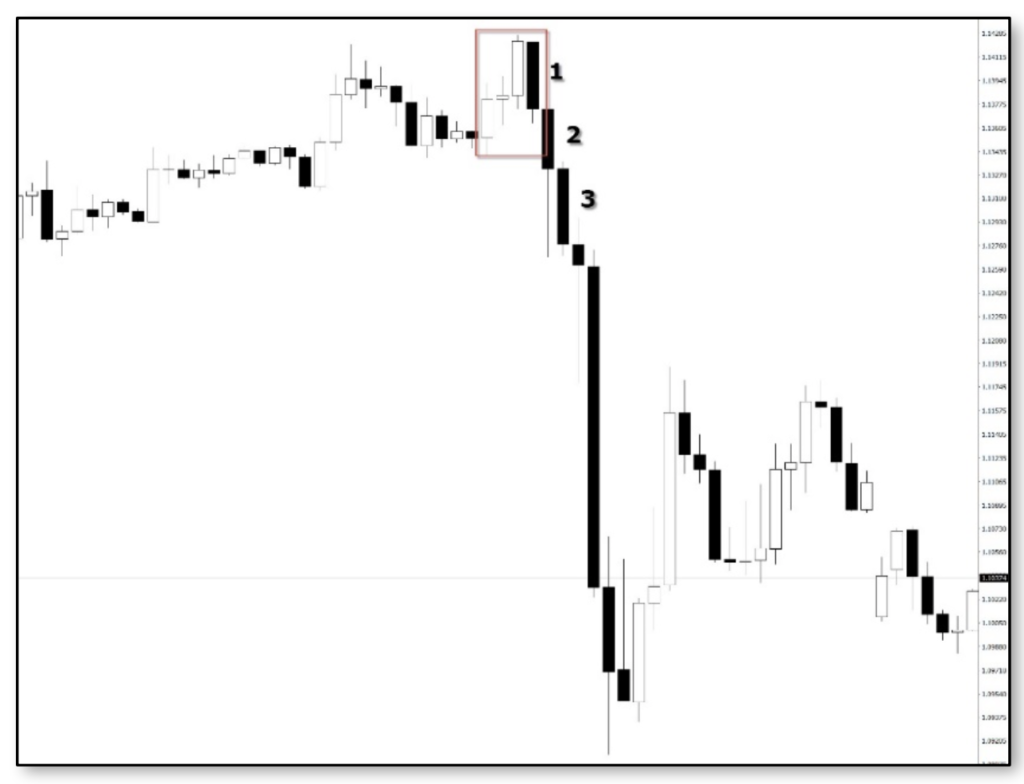
The formation of a triple pit or inverted head and shoulders, marking the holes by the price by creating formations, is a great help for us. After recognizing such a formation, we are able to react and properly open positions.
This is also the case with formations created at the very bottom of the charts. Here, the price shows us that the ongoing downward trend has just ended for some time and is reversed. The most common formation of the triple pit is inverted head and shoulders. Just like in the triple mountain, the same trade principle applies here. We draw a trend line, combining the so-called neck line. After closing the candle above the neck line, we can open the buy position. The neck line after cutting it by the price will create a support level, as shown in the chart above.
Double Hole
The second formation of reaching the hole by the market is a double hole. The formation is formed at the very bottom of the trend.
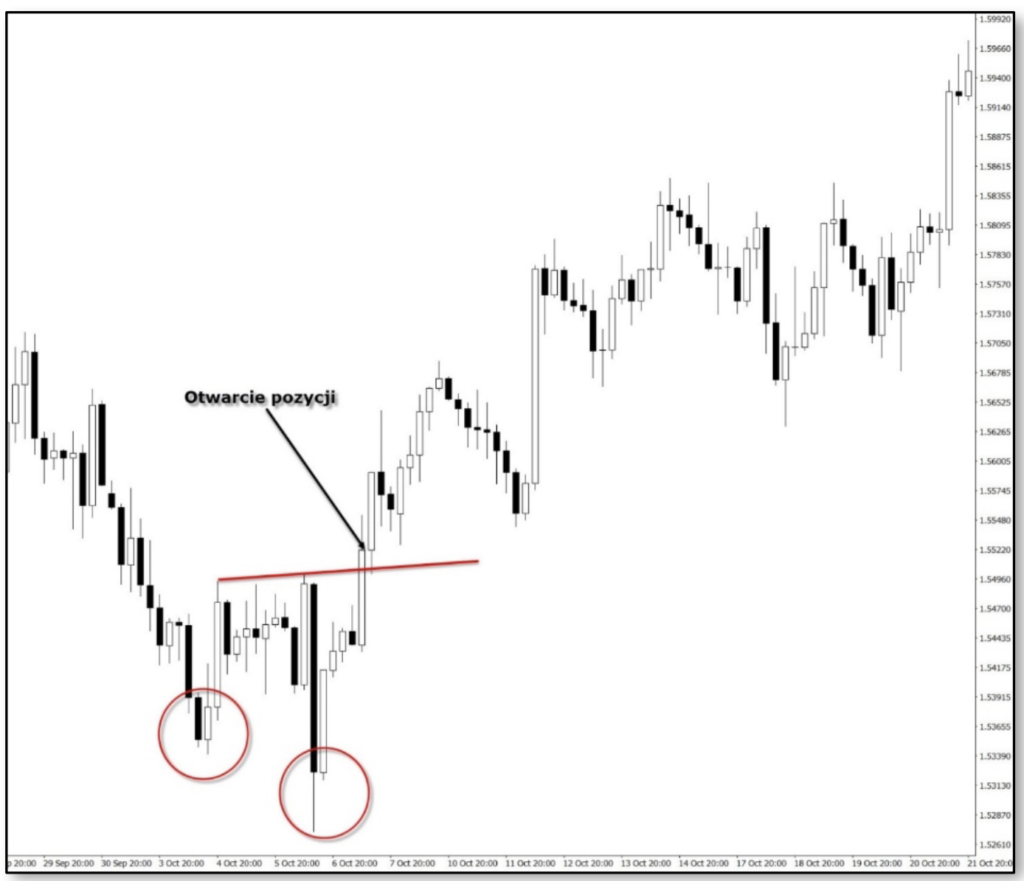
We are dealing here with a long candle (a sharp increase in impetus), which pierces the line connecting the two highest points in the middle of this formation. The place above the buy position should be marked on the chart above. You will learn about this candle formation later in this book. The candle, crossing the neck line, has small shadows - the candle of Bozu.
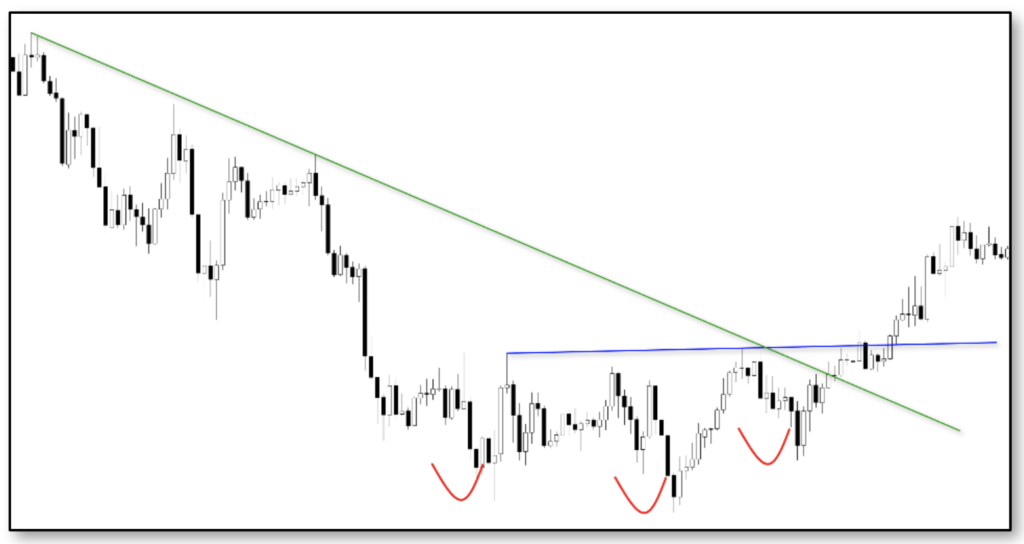
San Ku (Three Windows - Breaks)
The Japanese call breaks windows - Three windows, they are already in an ongoing trend. Ending the trend requires three windows. For a trend to exist, at least three changes are required in the same direction. Consolidation is characterized by at least three lines in a given time interval.
Forex is a very dynamic market and works 7 days a week, 24 hours a day. Therefore, the third method - San Ku occurs very sporadically. Time changes occur one after the other without breaks, the closing price of one candle is the opening level for the next. Of course, very small breaks may show up, but three will not show up in a given trend. Brokers disable market access for individual traders from Friday to Sunday. The interruption may show up when the broker re-enables access to market data. This break has nothing to do with the San Ku method.
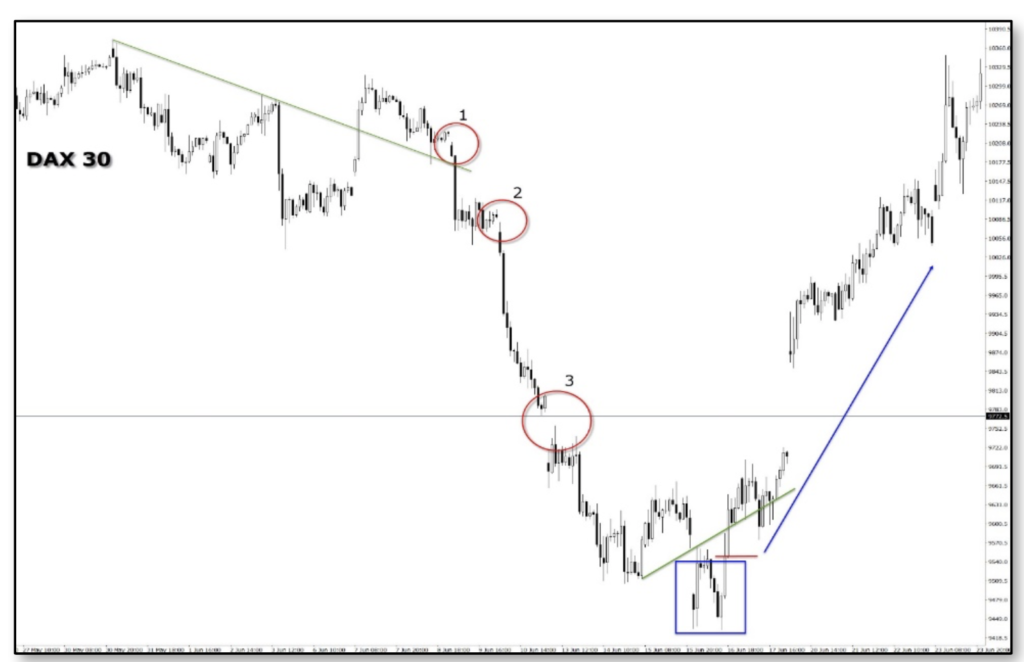
The DAX market chart was used to illustrate this formation.
There are notorious breaks on the DAX. After the third break, a double pit formation appeared. This is a signaling that a given trend direction is starting to change. The occurrence of a second double pit is a clear signal confirming the change in the direction of the price. The closing of the candle above the trend line is a great place to open a buy position. After the occurrence of SAN KU, we can expect a change in the direction of the trend.
San Pei - Three lines
The San Pei phase is the phase occurring during the trend. We have mini trends in this phase. When a triple treble or triple treble occurs, the trend should be confirmed. Sometimes it is not an easy task as it would seem to us.
Confirmation will be the next tilting points - Peaks in the uptrend (higher high peaks and higher low holes). In the downward trend, however, the next tilting points - Downs (lower high peaks and lower low holes). During the ongoing trend there will be side movements and consolidations. Here we should mention the method - San Poh.
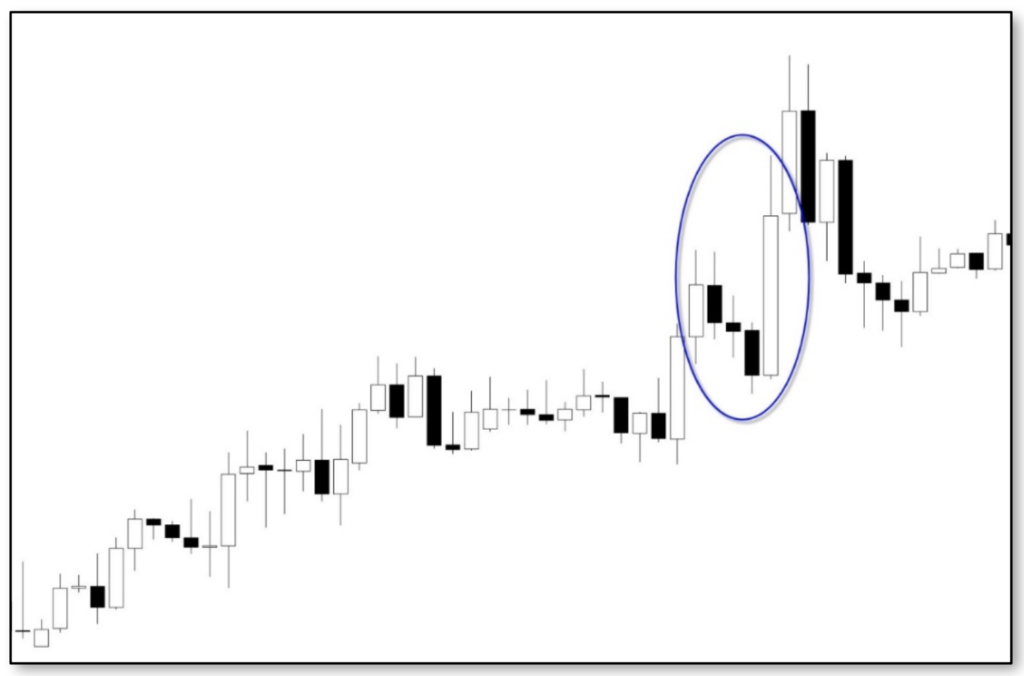
 Munehisa Homma gave us invaluable knowledge and the key, which is San Pei. Reduces ongoing trends to mini-trends! Creates a model of the smallest possible trends. Speaking in the modern language of chaos, trend fractals. Each trend has three phases - beginning, middle and end. In other words, they are three units or time / price candles. It consists of three consecutive candles with an increasingly higher closing price or an increasingly lower closing price. This is San Pei. The phase is so powerful that it can be used in itself to trade.
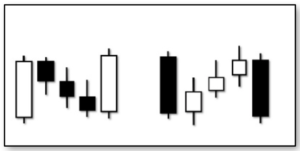
When San Pei is formed from three black candles, this formation is called "three black crows", while when it is formed from three consecutive white candles - it is the formation of three white soldiers.
This is the smallest trend in every market. The longer the candle bodies are in formation, the stronger the trend will be.
In San Pei we will find the quintessence of trading techniques in the trend. San Pei also gives us the main trading tool.
Three black crows
Three White Soldiers
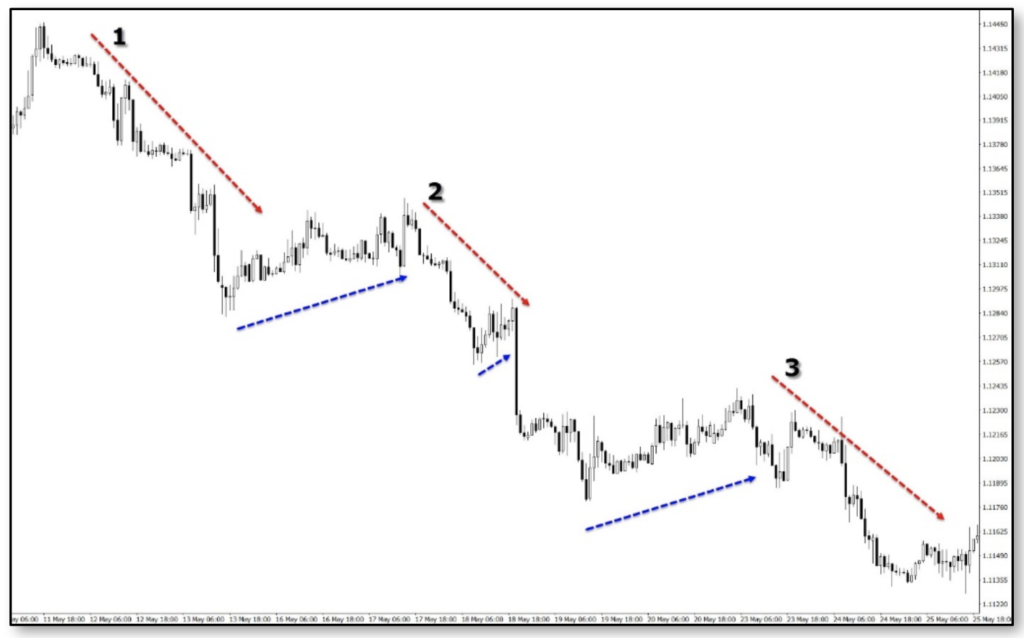
San Poi can also be applied to larger swings. The chart below shows three major trends - San Poi.
SAN POH
“... San-Poh (the three methods) in particular is a very unique technique and only a few people know it all over the world. If you sell or buy using only this method, you will make consistent profits, build a fortune, and never lose ... "- Munehisa Homma
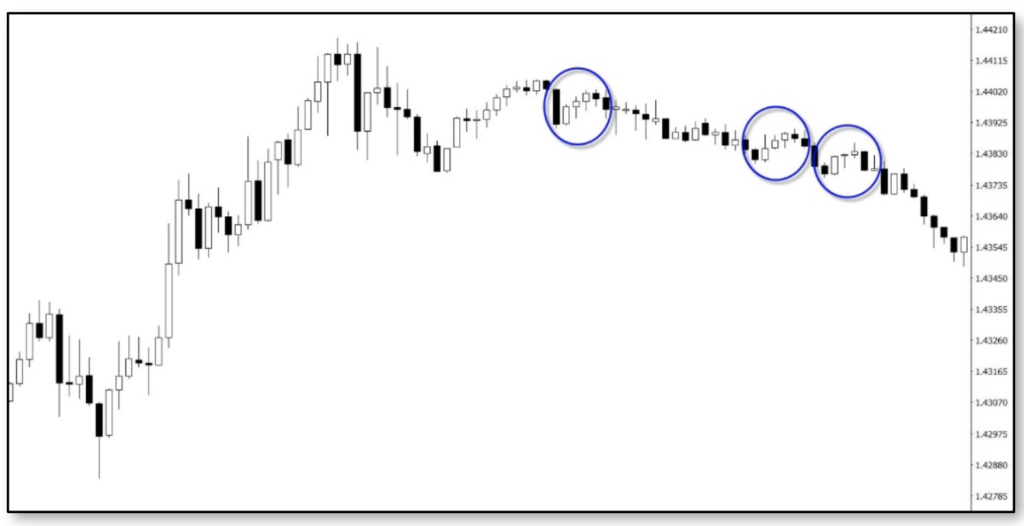
 San Poh concerns the market correction phase. This phase only occurs while the trend is in progress. It is the foundation for understanding the formation of market cycles. We should pay close attention to this formation.
Even with the strongest trend, the market must take a breath and wait a moment. This is a normal market reaction. Such formations can be found not only in Munehis Homm, but also in many Western publications. Both Livermore and Gann point to key reactions of slowing down the trend, where it is easy to open positions in an ongoing trend.
Easy recognition of this formation allows us to react quickly in market changes and build confidence in our reactions.
Trader and market cycles
Know yourself is the main task for a trader in achieving success. This is a ridiculously simple truth and not some psychological phrases. This is very specific knowledge - who we are in the course of trading. This applies to our trader's personality. When we trade, emotions, perception and our desires come into play.
They all have an impact on reality and can lead to success or failure. If we want to trade correctly, we should find out why we want to be a trader and accept the reality of trading in relation to ourselves. Unfortunately, most people expect excitement in what they call trading. This is a very bad approach to this trade. Trading means a huge amount of learning and work on your own personality and discipline.
Are you ready? If not, then give up trading.
Trading means much more than just buying and selling. Buying and selling are the tip of the iceberg. We need to get knowledge about the whole iceberg and not only about the very top. Sanmi No Den teaches us about two cycles - the trader's cycle and the market cycle itself. In other words, Sanmi No Den explains to us that we need to understand and understand the market cycles in depth. But we also need to learn about and explore the cycle of our behavior in relation to trading. The market cycle is objective and independent of the trader. The market will go through all its phases no matter what you think about it and what you do. Our goal is to integrate both cycles together. Only then will we achieve success. The success he writes about Munehisa Homma - all-time trader.


