


Swing Trading EMA - Strategy based on averages

On the internet, we can find a lot of strategies that can often trigger mixed feelings. The fact is that we are looking for the ones that will be the most effective. We rarely focus on one that is suited to our time capabilities, knowledge and capital that we can invest. Today I want to present to you a strategy that is intended for people who intend to spend about an hour a day trading.
Check it out: Investment styles on the Forex market
Swing trading, i.e. a position for a few days
Swing trading provides a time horizon for investments for a few to a dozen or so days. Therefore, we focus on the analysis of the higher intervals. By speaking higher I mean mainly H4 and D1. Some trading platforms also allow you to go down to H3 or H2, where they turn out to be useful mainly for finding convenient entry points. Of course, the time of running a position is heavily dependent on whether we hit the "favorite" moment of traders on the chart, ie the period of consolidation. Nevertheless, the enormous advantage of this strategy is the relatively small amount of time it takes to analyze the chart. It absorbs much less our attention. Here, too, there may be a problem due to the results that you need to wait longer.
Be sure to read: Swing trading with an advantage over day trading?
The key EMA tool
EMA is an exponential moving average and also one of the most popular among traders. It is created by calculating the average price of a given financial instrument from a given period. Of course, we can choose candle periods ourselves by modifying the appropriate settings. At the beginning, after adding a few averages to the chart, it may seem to us that we have just created a mass of analytics from the created web. Nevertheless, the assumptions are very simple, because they are based only on the intersection of averages. Depending on how medium penetrates, these places will generate buy or sell signals. In their standard parameters, the following settings are used: EMA 80, EMA 21, EMA 13, EMA 5, EMA 3, which are additionally set to the closing of the candle, ie "Close". If we would like to add each one in turn "manually" and not using the immediately added web, in the place "period" one should enter the number in sequence 80,21,13,5,3.
Source: platform xStation, XTB.
Signals from EMA
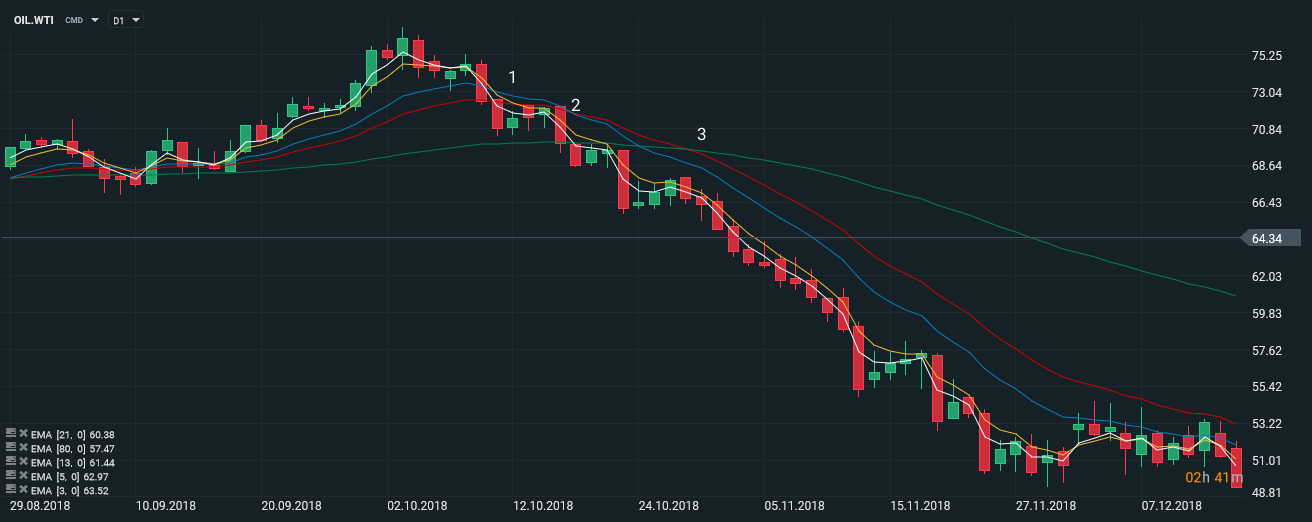
In general, signals are generated from the intersection of averages. The most reliable is when all 5 intersect at a similar point. It is known that 2 the fastest medium (3 and 5) will generate a large number of variable signals, so they can be treated more objectively.
In the above chart, I have marked 3 with important places where we have included a short position. As you can see, the generators generating this signal intersect. The opposite situation would have been in the case of a cut from below. In the graph I have marked 3 with potential inputs that differ from each other by the strength of potential signals and risk.
Looking at the chart, as I mentioned earlier, we can see three potential moments of entry. The first of them lies at the intersection of 5 and 3 with the mean values of 13 and 21. This is the moment when we can decide to conclude a transaction or wait for the second signal, this time the intersection of EMA from higher periods.
The second potential entry moment appears at the intersection of the fastest average with 80 periodic EMA and 13 with 21. The most reliable signal is of course the 3 stage, in which all lines connect with each other.
Exit and conducting the position
As in the case of transactions, you can adjust the exit from the position. There is also a second way, which consists in "collecting" supply / demand from the average with the highest period.
Source: platform xStation, XTB.
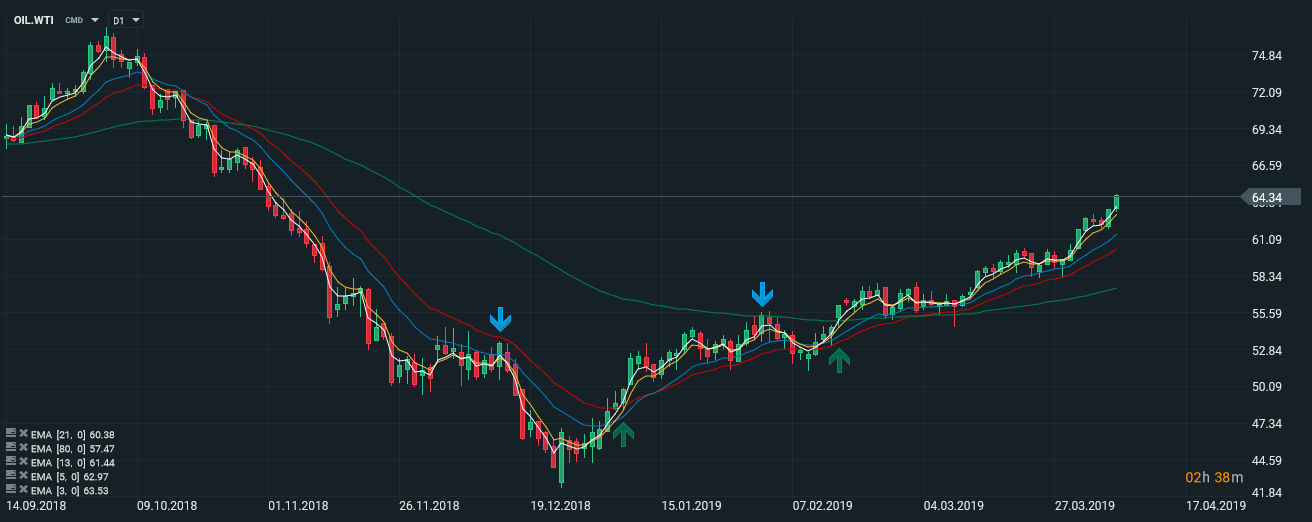
In the chart above, I marked the blue arrows with moments in which we may have concerns that the downward trend is going to burn out. Why do we choose mediums with higher periods? The signals flowing from them are more reliable. They occur less often, and the EMA itself is calculated from the greater amount of candle data closing. Let's look at both situations. In the first of them, the green candle with 21 test of the periodic average was quickly "pulled". A slightly different situation occurs when testing the most important EMA 80. Previously, the green arrow shows the first inverse signal to the current short position.
The second "download" of the demand candle is not as strong as with EMA 21. What's more, the price begins to halt again. More or less here, we should leave the position.
You can have a more conservative approach to building strategies on medium. Namely, instead of looking for smaller and riskier signals, we focus only on the intersection of all EMAs in one place.
Swing Trading EMA - Summary
Swing EMA can be supplemented with classic technical analysis indicators. I mean mainly RSI, be Stochastic. Nevertheless, it is a fairly simple strategy that does not require too much time to analyze the chart. The approach described above is very general. If I had to look at the whole strategy more subjectively, I would recommend focusing on a smaller number of mediums, due to the fact that EMA 3 and EMA 5 generate very similar signals. What's more, building an average band can be interestingly varied Price Action method. In my opinion, it's a simple strategy, but for patient traders. Additional difficulty can be caused by consolidation periods, where the more decisive averages (21,80) are relatively close to each other and can generate a few conflicting signals within a few days.


Is the EMA indicator ready for tradingview with these values ready?
On TradingView and the vast majority of other platforms, you can add many EMA to your chart with the values you choose.