


RSI indicator - a powerful and underrated tool [JIM PONIAT]

RSI indicator (from Relative Strength Index) is probably one of the most dynamic and powerful indicators available to the trader. It is available on all popular transaction platforms, and in recent years is clearly gaining popularity.
RSI is often misinterpreted
Unfortunately, the title RSI is also the most misunderstood, misused and undervalued indicator. MIt can be used as a completely independent technician or as an additional aid to the investment system.
What does it do
As a completely independent trading technique, RSI can be used to identify:
- the direction of impetus,
- support and resistance,
- divergence,
- changes in momentum (but not trend strength),
- reverse swings,
- setting target prices Price Targeting).
The most important issue: settings and levels must be edited.
Andrew Cardwell's method
Below is a method designed by Andrew Cardwell, author of the book "Relative Strength Index: Forecasting and Trading Strategies" and world-renowned RSI specialist. The Cardwell course cost me 10,000.00 USD. Was it worth the price? Yes of course.
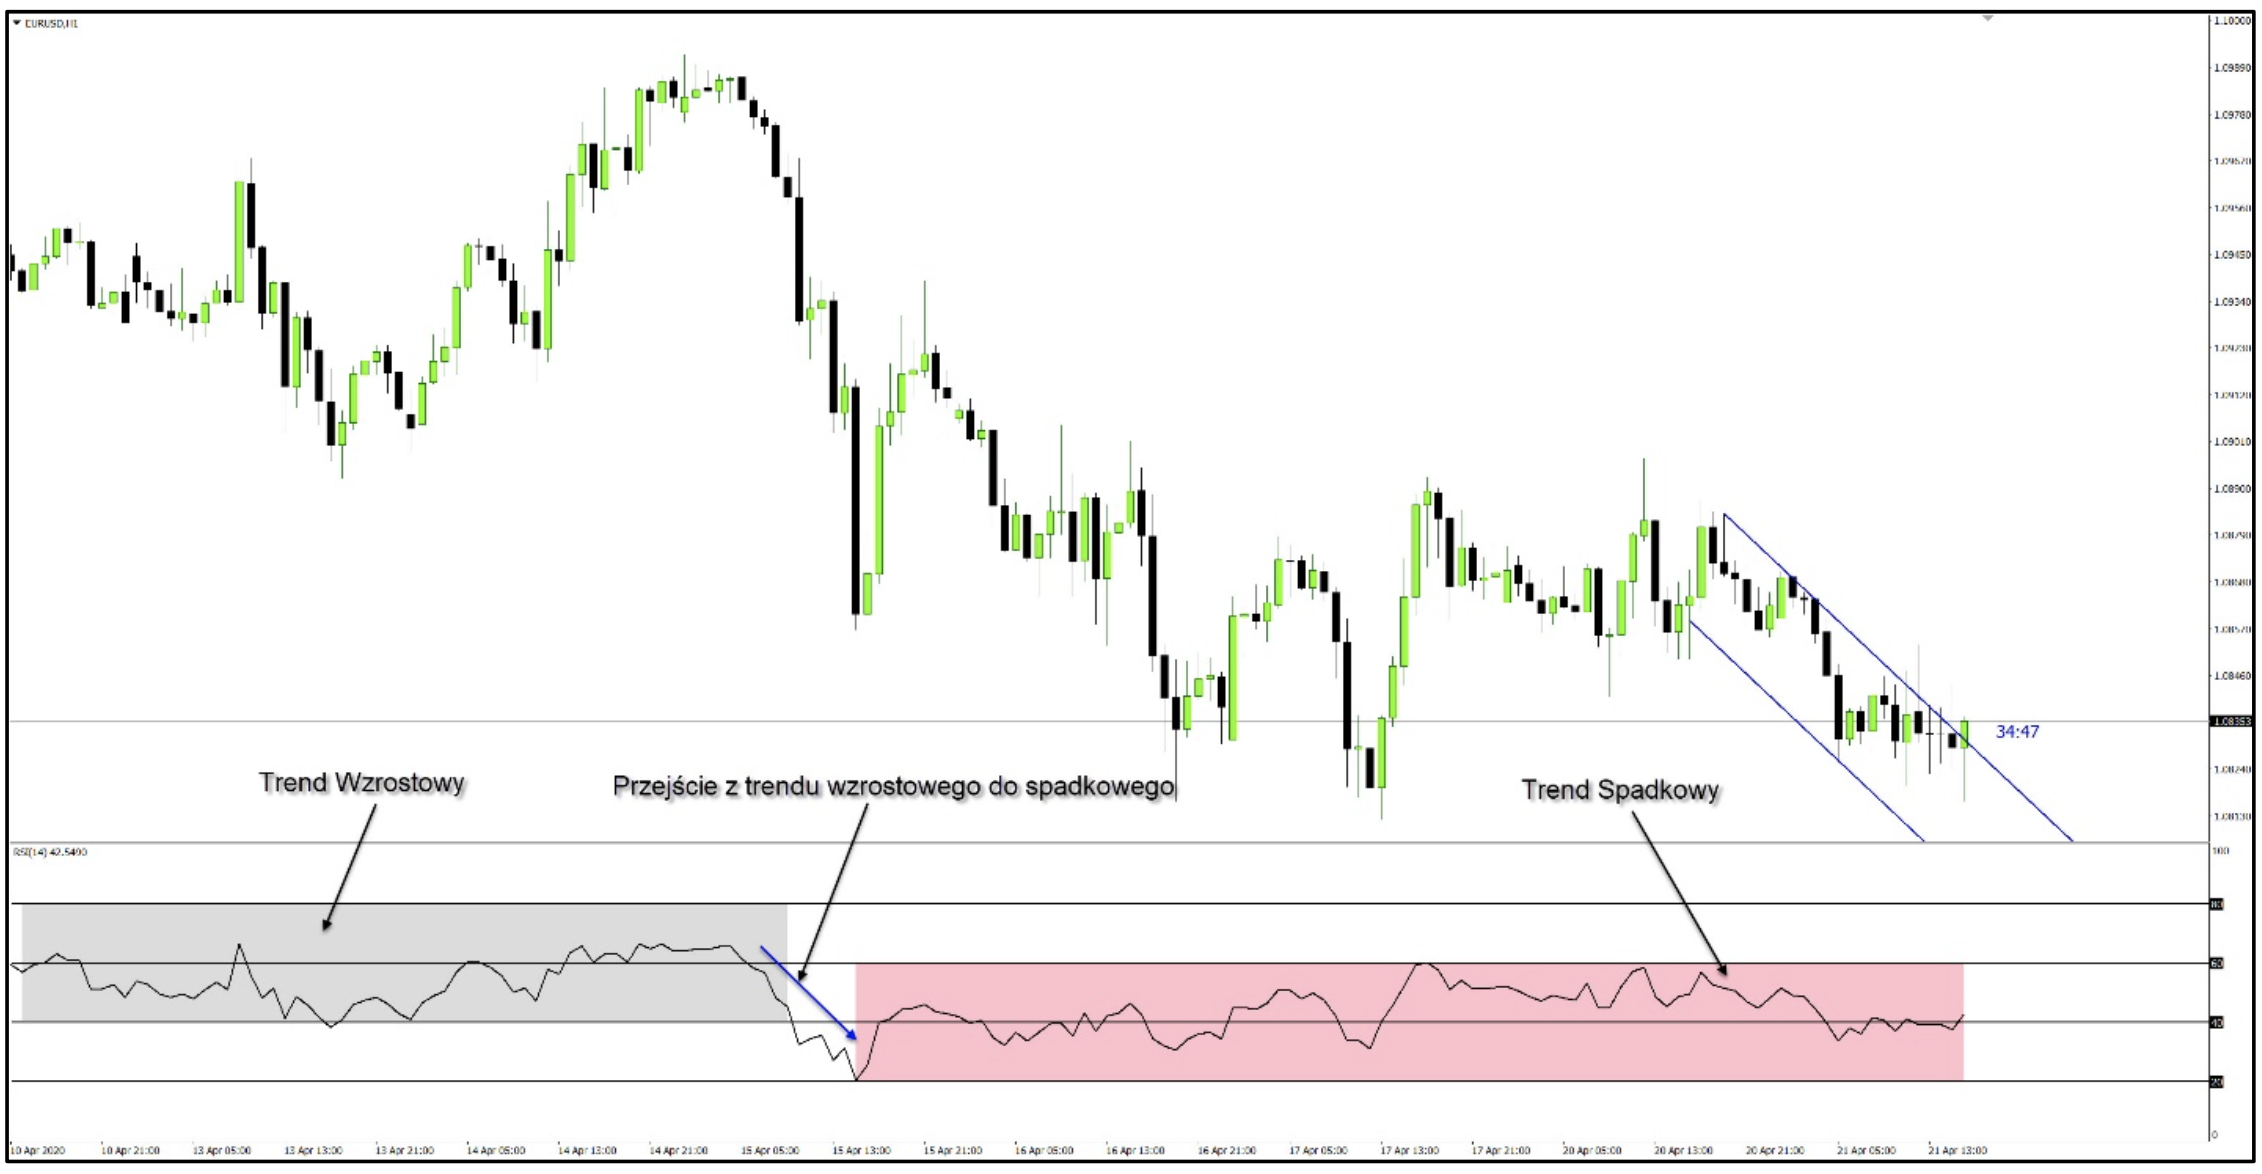
I used the Cardwell method for many years with excellent effects. Cardwell noticed completely different levels at which RSI (14) stops or changes directions. Levels 80-40 mean the strength of upward momentum, and 60-20 means downward momentum.
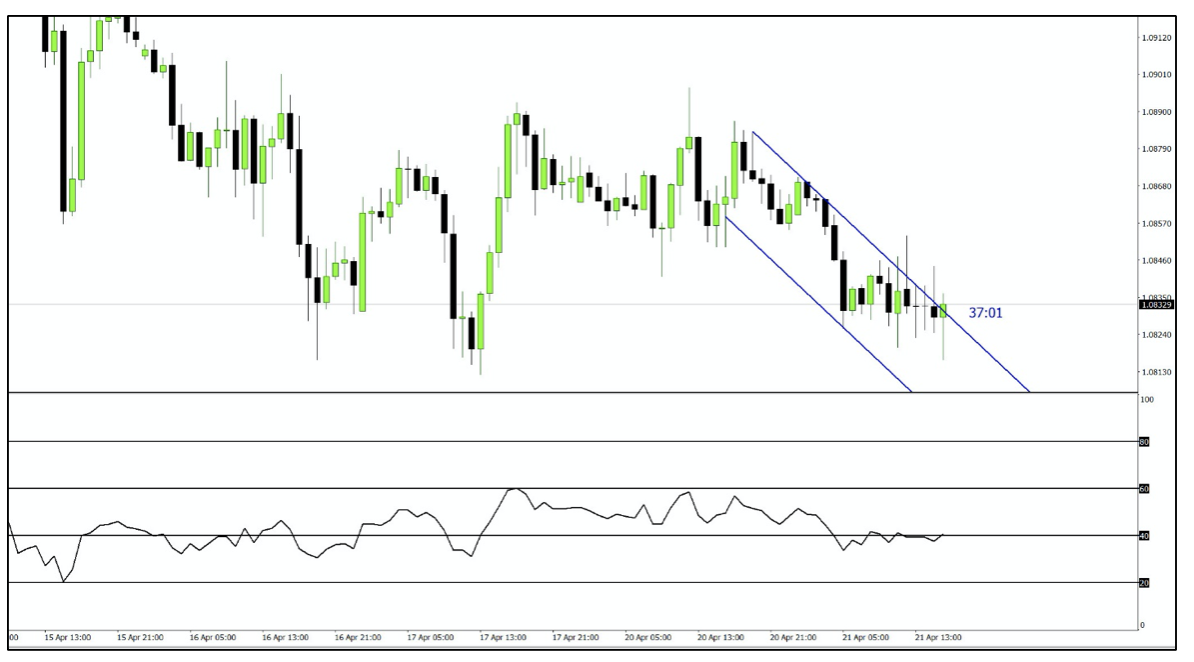
If we look more closely, it can be seen exactly how RSI (14) indicates these impetus forces in the chart below.
Of course, divergences are a bonus here, which works great. Remember, however, that not every divergence is suitable for trading. You can write forever about divergences and we will come back to this issue in one of the following paragraphs.
Construction of the RSI indicator
Wells Wider (Trend Research, Hendersonville NC) is the author RSI. The indicator was created in the seventies. It was designed as an indicator and oscillator momentum. Works in levels 0 and 100. It is extremely easy for novices to start trading with the recommended settings and without any education or delving into the construction of a given indicator - the desire to earn profits is stronger than gaining additional knowledge.
RSI is also one of the most misunderstood and misused indicators. Wilder created RSI as a tool to indicate the strength of the impetus and weakness of financial markets. RSI above level 70 was taken as an overbought zone and below 30 as a sell-off.
The built-in RSI function is the resistance that occurs at levels 33 and 66 (Wilder rounded them to 30 and 70). But does this justify the conclusion that these levels signal that the market trend is over?
Cardwell noticed that RSI (14) very often goes above level 70 and below 30. Hence new levels (80, 60, 40 and 20) that reflect the actual market situation.
Table of resistance coefficient occurring on the RSI
| RSI value | Coefficient of resistance |
| 90 | UP / DOWN = 10/1 |
| 80 | UP / DOWN = 4/1 |
| 75 | UP / DOWN = 3/1 |
| 66.6 | UP / DOWN = 2/1 |
| 50 | UP / DOWN = 1/1 NEUTRAL BALANCE |
| 33.3 | UP / DOWN = 1/2 |
| 25 | UP / DOWN = 1/3 |
| 20 | UP / DOWN = 1/4 |
| 10 | UP / DOWN = 1/10 |
This table clearly shows that the RSI value meets with increasing resistance when approaching the extreme values of 0 and 100. An increase of 10 points in the RSI from 75 to 85 must correspond to the upward movement, which is much more significant than the upward movement corresponding to the 10 point shift of the RSI from 50 to 60.
The drag coefficient effect in RSI becomes clearly visible above level 66.6 and below level 33.3, where RSI must move in an increasingly steep slope. So you can see perfectly well that the more impetus the RSI (14) increases much higher than the recommended levels Widera.

The chart above shows how the momentum behaves, and hence the price. For a long time, the price remains in a sideways trend, then there is a drop in price to 20 and a sharp rise to 80. As you can see, the recommended levels by Wider do not apply here.
important: At extreme levels, we pay special attention to candle formations. Here these formations work perfectly.
divergences
divergence it is a divergence of price and impetus that helps identify extreme conditions in a market situation. Most traders fall prey to the divergence concept and see it as the end or reversal of the prevailing market trend - nThere is nothing more wrong.
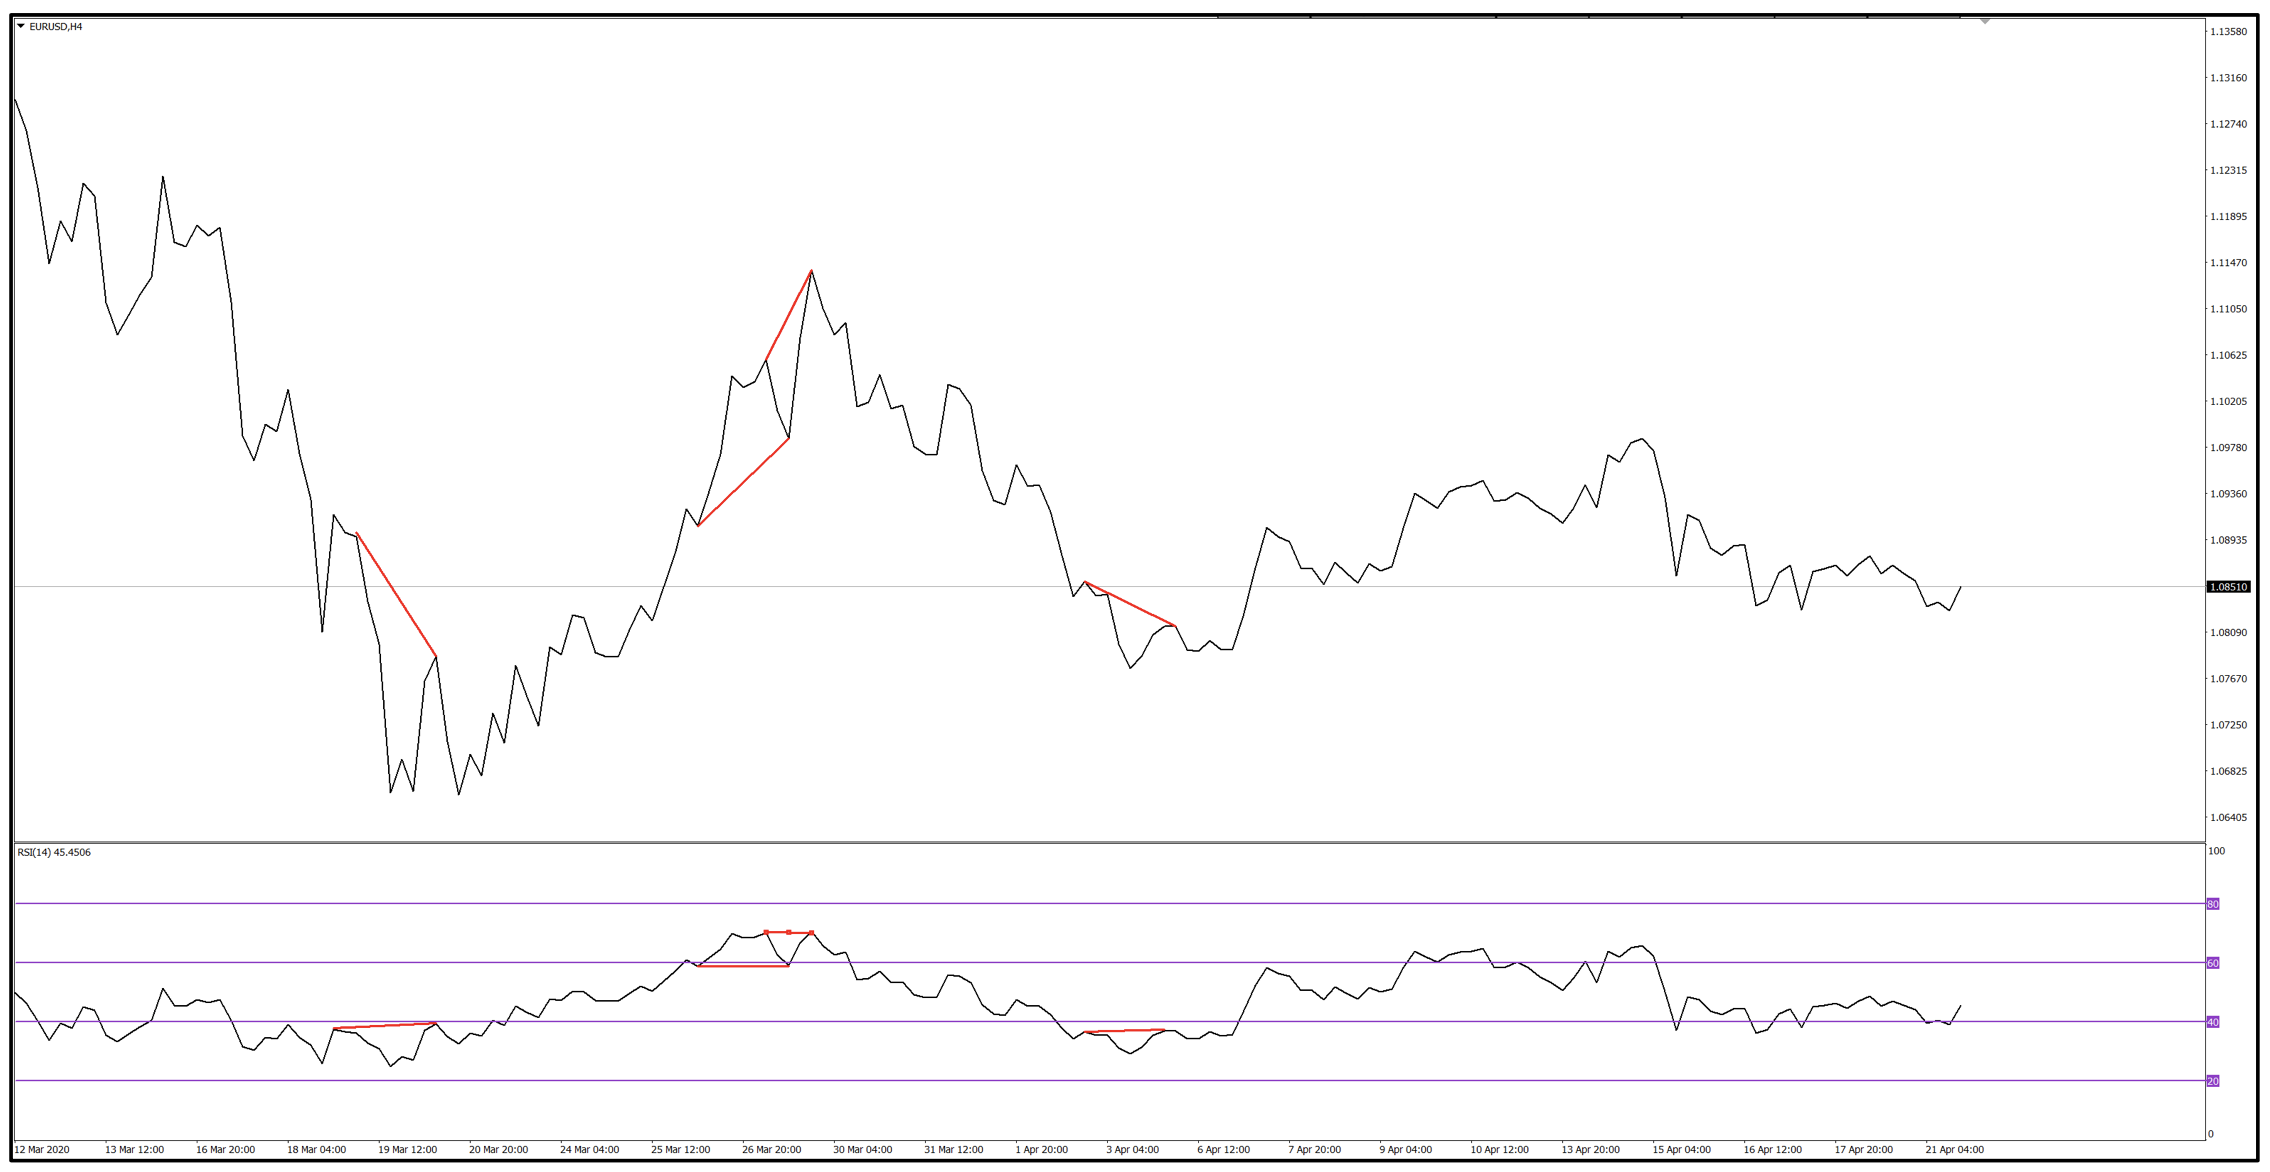
I have determined several divergences on the chart above. Wouldn't it be great if any divergence meant a reversal of the price trend? Unfortunately this is not the case. As you can see, not every divergence reverses the price trend. The line chart is determined at the closing price. so when we compare RSI (14) with the graph, we compare exactly the same parameters and of course it is much easier to observe divergences.
The impetus and price corrections, when they become reality, are usually sharp and violent. After these short breaks, the market is ready to resume the normal upward (downward) trend. With each subsequent level emerging high (low) and divergences, restless investors are ready to go in to reverse the trend.
However, many discrepancies can develop on strong market trends that only lead to a correction of the market situation. If a trader tried to take positions based solely on divergences, he would need a deep pocket and would eventually exhaust his capital.
Impulse reversal signals are sometimes strong and fast. Hence, drawing trend lines at the tops and holes gives much earlier signals of trend reversal. Cardwell also uses moving averages for RSI (14), which gives additional information about the reversal of momentum.
JP Spectrum ©2020
Determining previously "invented" levels on the RSI is wrong. We should not tell RSI where to stop or change direction, but RSI should show us how and where we should pay attention to signals. My JP Spectrum technique uses the full Spectrum capabilities offered by RSI, which indicates the signals before the price makes any changes.


