


Timberland REIT - a piece of forest in the investment portfolio

REITs operate in various industries. Although Real Estate Investment Trust are mainly equated with office buildings, shopping malls and data centers, there are also REITs related to less known industries. An example is "forest" REITs.
READ NECESSARY: What is a REIT and how to invest in it? [Guide]
Their activity is the management of forest assets. This means that they plant, care for and cut trees. Part of the cut wood is sold to external wood processing plants. However, some companies have their own plants for the production of e.g. panels. The Polish equivalent of companies from the forestry industry is the State Forests National Forest Holding.
REITs
In the United States, the largest wood-related REITs are:
- Weyerhaeuser
- PotlatchDeltic
- Rayonians
Below is a description of the two largest REITs:
Weyerhaeuser (ticker: WY)
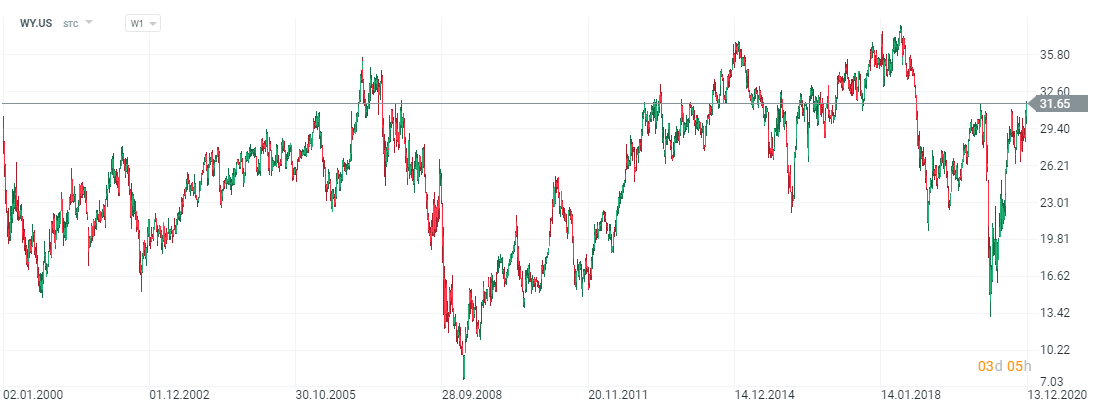
Weyerhaeuser (WY) stock chart, interval W1. Source: xNUMX XTB.
The company is one of the world's largest private forest owners. Weyerhaeuser owns approximately 11,5 million acres (1 acre equals 0,4047 hectares) of forest in the United States and manages approximately 14 million acres of forest in Canada (the company has long-term leases). The company is also one of the largest manufacturers of wood products in North America. In addition to construction timber, the company also offers specialist wood products. Weyerhaeuser has approximately 9 employees. The company's capitalization exceeds $ 400 billion.
Since 2010, the company has been operating in the form of a REIT. Due to its structure, the company pays federal tax on corporate profits classified as TRSs (Taxable REIT Subsidiaries). The TRSs includes the entire "Wood Products" segment and some segments "Timberlands" and "Real Estate & ENR ". Weyerhaeuser is therefore a vertically integrated company.
Forest segment
The company has forests in 19 states, incl. (Oregon, Washington, Alabama, Texas, Montana, and Virginia). In Canada, assets are located in Alberta, British Columbia, Ontario and Saskatchewan.
The total timber stock is estimated at 595 million tonnes. However, not all wood is suitable for processing. Much depends on the quality of the wood, age and species. Depending on the region, a different type of tree dominates. In the case of Oregon and Washington, Douglas fir species and trees classified as SPF (Świerk-Sosna-Fir) are dominant. Trees are felled both for sale and for personal use (wood processing).
Real Estate, Energy and Natural Resources Sources segment ("Real Estate & ENR")
The company also sells some land for residential developers and recreational activities. The enterprise, however, does not generate too much income from this activity. In 2019, they sold 113,3 thousand. acres of land at an average price of 1,85 thousand. per acre This resulted in approximately $ 209 million in revenue. The second type of activity is the granting of rights to exploit resources (rock, sand, oil and gas) or to build wind or solar farms. In 2019, the company generated $ 89 million in revenue from this activity.
Wood Products segment
Weyerhaeuser also deals with wood processing. The company's products include OSB boards, plywood and construction timber. For this reason, the company usually benefits from a recovery in the construction market. In the last 3 years, the company in this segment generates from $ 4,6 billion to $ 5,3 billion annually. Below is an overview of the sales structure in the segment:
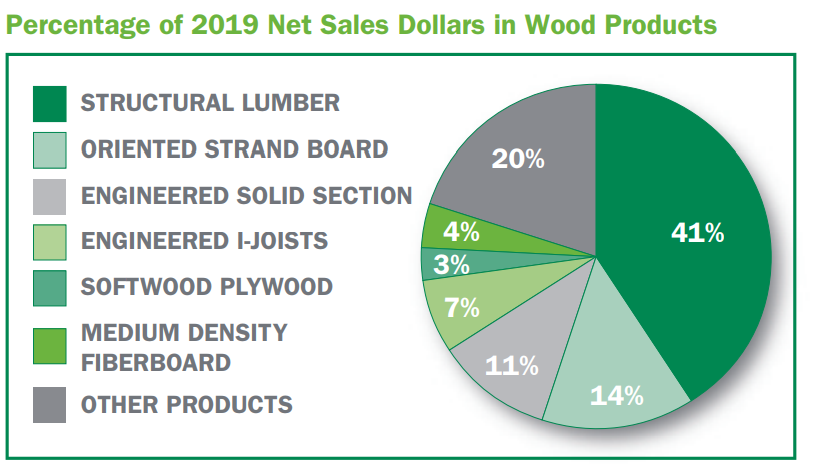
Source: Weyerhaeuser Annual Report 2019
Financial results
Due to the fact that the company's financial results depend on the economic situation on the construction market and wood prices, the company's results should be looked at in the long term. Data in millions of dollars:
| Weyerhaeuser | 2015 | 2016 | 2017 | 2018 | 2019 |
| revenues | 5 246 | 6 365 | 7 196 | 7 476 | 6 554 |
| Operational profit | 755 | 998 | 1 415 | 1 374 | 615 |
| Operating margin | 14,39% | 15,68% | 19,66% | 18,38% | 9,38% |
| Net profit | 506 | 1 027 | 582 | 748 | -76 |
The fall in wood prices had an impact on the company's operating result. It was the lowest in the period considered. The net loss resulted from the impact of a one-off event (recognition of non-cash costs related to liabilities due to pension plans).
| Weyerhaeuser | 2015 | 2016 | 2017 | 2018 | 2019 |
| Cash flows from operating activities | 1 075 | 735 | 1 201 | 1 112 | 966 |
| CAPEX | 519 | 510 | 419 | 427 | 384 |
| FCF | 556 | 225 | 782 | 685 | 582 |
| FFO | 974 | 1 716 | 1 239 | 1 359 | 582 |
The company continues to generate positive FCF (free cash flow). The FFO indicator also confirms that Weyerhaeuser has no problems generating cash from his business.
Dividend payment and financial liabilities
| Weyerhaeuser | 2015 | 2016 | 2017 | 2018 | 2019 |
| Dividend | 663 | 954 | 941 | 995 | 1 013 |
| Net purchase | 484 | 1 942 | -128 | 314 | 47 |
| Funds transferred to investors | 1 147 | 2 896 | 813 | 1 309 | 1 060 |
| Dividend / FFO | 68% | 56% | 76% | 73% | 174% |
Like all REITs, the company was very generous in sharing its profits with shareholders. Due to large share buyouts and dividend payments, which were much higher than the cash generated by the company.
| Weyerhaeuser | 2015 | 2016 | 2017 | 2018 | 2019 |
| Interest debt | 5 302 | 7 121 | 6 503 | 6 646 | 6 377 |
| cash | 1 011 | 676 | 824 | 334 | 139 |
| Net debt | 4 291 | 6 445 | 5 679 | 6 312 | 6 238 |
| EBITDA | 1 234 | 1 563 | 1 936 | 1 860 | 1 125 |
| Net debt / EBITDA | 3,48 | 4,12 | 2,93 | 3,39 | 5,54 |
As a result, there was an increase in net debt, which translated into a deterioration in the ratio of net debt to EBITDA.
Rayonier (ticker: RYN)
Rayonier is a company that can be called "pure play". In 2014, the company separated a business specializing in cellulose-based products as Rayonier Advanced Materials. The remaining assets (forests) remained in Rayonier Inc.
The main activity of REITs is forest asset management. The company is the 5th largest private owner of forest land. It is also the second largest REIT listed on the US stock exchange. Unlike Weyerhaeuser, the company is not vertically integrated. This is because they do not have wood processing facilities. The main recipients of the company's wood are producers of paper, pulp and wooden products.
At the end of 2019, the company owned approximately 2,6 million acres of forests (including 0,4 million acres the company leases). Rayonier has the most forest assets in the southern states of the USA (including Texas, Alabama, Mississippi, Florida), where it has 1,8 million acres of forests. The company also has a presence in New Zealand where it owns 0,414 million acres. It is also present in the northeast of the USA (Oregon, Washington), where the forest area amounted to 0,379 million acres. In mid-2020, Rayonier took over 114 thousand. acres of forest from Pope Resources. The company estimates its inventories at SGT 91,2 million (short green tons). 74% of the inventory is in the southern US. New Zealand accounts for 18% of all stocks. The sale of wood generated 73,3% of total revenues.
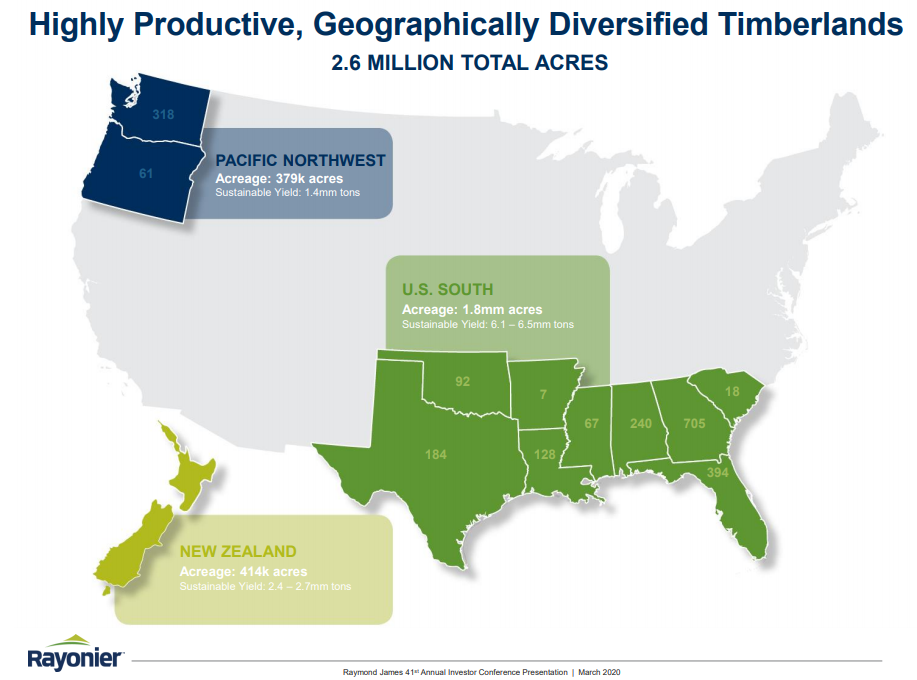
Source: Rayonier.com
The company also has a business branch related to the sale and lease of forest land. As a rule, it sells smaller-sized non-strategic land. In 2019, Rayonier sold a total of 17,15 thousand. acres of forest for $ 74,9 million in revenues. A year earlier, the company sold 33,6 thousand. acres and generated revenue of $ 138,6 million on this account. The company's capitalization is approximately $ 4 billion.
Financial results
Due to the fact that the company's financial results depend on the economic situation on the construction market and wood prices, the company's results should be looked at in the long term. Data in millions of dollars:
| Rayonians | 2015 | 2016 | 2017 | 2018 | 2019 |
| revenues | 568,8 | 815,9 | 819,6 | 816,1 | 711,6 |
| Operational profit | 83,2 | 254,2 | 212,1 | 169,3 | 109,5 |
| Operating margin | 14,63% | 31,16% | 25,88% | 20,75% | 15,39% |
| Net profit | 46,2 | 212,0 | 151,7 | 108,1 | 73,5 |
Falling timber prices and lower plot sales in 2019 negatively impacted revenues, which fell by over $ 100 million. The operating margin also deteriorated and fell to its lowest level since 2015. Nevertheless, the company remained profitable.
| Rayonians | 2015 | 2016 | 2017 | 2018 | 2019 |
| Cash flows from operating activities | 177,2 | 203,8 | 268,0 | 321,8 | 226,4 |
| CAPEX | 159,3 | 440,3 | 330,1 | 129,4 | 213,1 |
| FCF | 17,9 | -236,5 | -62,1 | 192,4 | 13,3 |
| FFO | 172,4 | 338,8 | 290,1 | 269,9 | 199,9 |
Much of the cash generated from operating activities is used for capital expenditure (CAPEX), which significantly reduces the voluntary cash flow (FCF). The main reason was forest purchases. The "maintenance" CAPEX alone is around $ 65 million.
| Rayonians | 2015 | 2016 | 2017 | 2018 | 2019 |
| Dividend | 124,9 | 122,8 | 127,1 | 136,8 | 141,1 |
| Net purchase | 100,0 | -152,4 | 0,1 | 2,9 | 12,7 |
| Funds transferred to investors | 224,9 | -67,6 | 127,2 | 139,7 | 153,8 |
| Dividend / FFO | 72% | 36% | 44% | 51% | 71% |
For 3 years, the company has been increasing the amount of dividend paid (in nominal terms) every year. During this time, the level of FFO worsened, which resulted in a significant increase in the dividend to FFO ratio. This means that unless the FFO level improves, the company has limited room to increase funds allocated to dividends.
| Rayonians | 2015 | 2016 | 2017 | 2018 | 2019 |
| Interest debt | 830,6 | 1 065 | 1 022 | 975 | 1 057 |
| Cash | 51,7 | 85,9 | 112,6 | 148,4 | 68,7 |
| Net debt | 778,9 | 979,1 | 909,4 | 826,6 | 988,3 |
| EBITDA | 196,9 | 369,4 | 339,7 | 313,4 | 237,7 |
| Net debt / EBITDA | 3,96 | 2,65 | 2,68 | 2,64 | 4,16 |
Despite the dividend payment, the company controls the level of net debt, which does not exceed $ 1 billion. The increase in the net debt / EBITDA ratio results from the deterioration of the operating result. This resulted in a decline in EBITDA.
ETFs related to the wood market
If an investor does not want to wonder which REIT is a better choice, he can invest in an ETF that includes companies from the forestry sector and the wood industry. The disadvantage of such a solution is that the investor will also purchase a basket of shares of companies from the paper and packaging industry. So it is an exposure to more industries. Timberland REITs are a minority in ETFs. The advantage of this solution is a much wider geographic and sector diversification.
CHECK: What are ETFs - Introduction to Investing
The most popular ETF related to the timber market is iShares Global Timber & Forestry (WOOD). The ETF has approximately $ 260 million under management. As of November 30, it consisted of 25 companies. The benchmark for the ETF is the S&P Global Timber & Forestry Index. As of September 30, 2020, the ETF achieved a 10-year average annual rate of return of 6,62%. Total Expense Ratio is 0,46%. The fund is geographically diversified. American, Swedish, Canadian and Japanese stocks dominate. Below is the list as of November 30, 2020:
| Country | Participation |
| USA | 34,60% |
| Sweden | 16,25% |
| Canada | 11,18% |
| Japan | 10,93% |
| Finland | 9,56% |
| Brazylia | 7,84% |
| Irlandia | 4,05% |
| Great Britain | 4,04% |
| South Africa | 1,24% |
| Other | 0,31% |
In terms of sectors, shares of paper and forestry companies (52,03%), REITs operating in the forestry industry (24,05%) and the packaging industry (19,82%) dominate. Below is a list of the top 10 positions in the ETF:
| REIT | Participation |
| Svenska Cellulosa | 8,50% |
| Rayonier REITs | 7,71% |
| Weyerhauser REIT | 7,68% |
| Potlatchdeltic | 7,53% |
| West Fraser Timber Ltd | 6,59% |
| International paper | 4,28% |
| westrock | 4,26% |
| Suzano S.A | 4,19% |
| Holmen Class | 4,16% |
| Smurfit Kappa | 4,05% |
Another ETF is Investco MSCI Global Timber (CUT). It is not a very popular ETF, it has under $ 85 million under management (state on 30 November 2020). The benchmark for the ETF is the MSCI ACWII IMI Timber Selected Capped index. As of October 31, ETFs will achieve a 10-year average annual rate of return of 5,42%. Total Expense Ratio is 0,67%. This ETF is dominated by American, Finnish, Swedish and British companies. As of November 30, 2020:
| Country | Participation |
| USA | 44,72% |
| Finland | 12,22% |
| Great Britain | 7,31% |
| Sweden | 7,27% |
| Brazylia | 5,32% |
| Irlandia | 4,53% |
| Canada | 4,21% |
| Japan | 3,84% |
| Switzerland | 2,57% |
| China | 1,13% |
The ETF owns many more companies than the Ishares Fund. As of November 30, it had 76 of them. Below the top 10 positions in Investco MSCI Global Timber ETF:
| REIT | Participation |
| UPM-Kymmene Oyj | 5,12% |
| Avery Dennison | 5,03% |
| Weyerhauser REIT | 5,01% |
| International paper | 4,96% |
| Packing Corporation of America | 4,90% |
| westrock | 4,76% |
| Amcor | 4,75% |
| Mondi plc | 4,66% |
| Smurfit Kappa | 4,53% |
| Stora Enso Oyj | 4,28% |
ETF brokers
| Broker |  |
 |
|
| Country | Poland | Denmark | Great Britain |
| The amount of ETF on offer | approx. 400 - ETF approx. 170 - CFDs on ETFs |
3000 - ETF 675 - ETF CFDs |
397 - ETF CFDs |
| Min. Deposit | PLN 0 (recommended min. PLN 2000 or USD 500, EUR) |
0 PLN / 0 EUR / 0 USD | PLN 5 |
| Platform | xStation | SaxoTrader Pro Saxo Trader Go |
MetaTrader 5 |
CFDs are complex instruments and come with a high risk of losing money rapidly due to leverage. From 72% to 89% of retail investor accounts record monetary losses as a result of trading CFDs. Think about whether you understand how CFDs work and whether you can afford the high risk of losing your money.
Summation
Wood-related REITs are a solution for investors looking for stable companies that regularly pay dividends. Looking at the historical financial results of the aforementioned enterprises, they cannot be classified as increasing. Due to the activity performed, business scaling is much more difficult than in the case of companies of the type "Asset-light". US "forest" REITs are linked to the US construction market boom. The greater the number of single-family houses built, the greater the demand for wood, OSB boards and plywood. However, the industry is exposed to the risk of natural disasters (fires, hurricanes) and has no influence on the global wood prices (they are price takers). The investor can also invest in ETFs that have companies related to the wood and pulp and paper industries in their portfolios.


