


More emotions in the markets due to Powell's hawkish speech and the problems of the SVB bank

In the past week, more emotions returned to the markets due to Powell's hawkish speech, the problems of the SVB bank, or further data on the US labor market.
On Tuesday after Powell's speech, the market began to price in another rate hike this month at 50 basis points (unthinkable just a few weeks ago).
On Thursday it turned out that the bank SVB (Silicon Valley Bank) has to save itself through an unannounced share issue (the shares of the bank's owner, SVB Financial Corporation, fell by 60% on Thursday).
Even before the problems of SVB, the markets closely followed developments in the US labor market, which seemed to be the last jigsaw puzzle before the end of the cycle of interest rate hikes by the Fed.
Anyway, we are getting closer to the end of the cycle (which can be understood as a series of rate hikes by the Fed). And usually FED it raises interest rates "where it can", i.e. too high - which usually ends in a recession in the economy, or some unpleasant event in the financial markets (and sometimes we have both).
More emotions returned to the markets
In the past week, the S&P500 fell 4,5%, and several events directly contributed to such a drop, as presented in the chart below. Powell's speech before the Senate committee "cost" the S&P 500 about 1,5%, while SVB bank's problems another 3%. On Friday we also had a report on employment, which was rather of secondary importance for the stock market compared to the situation related to the SVB bank and its final closure by the US regulator on Friday during the session (the case probably went faster than with Lehman in 2008).
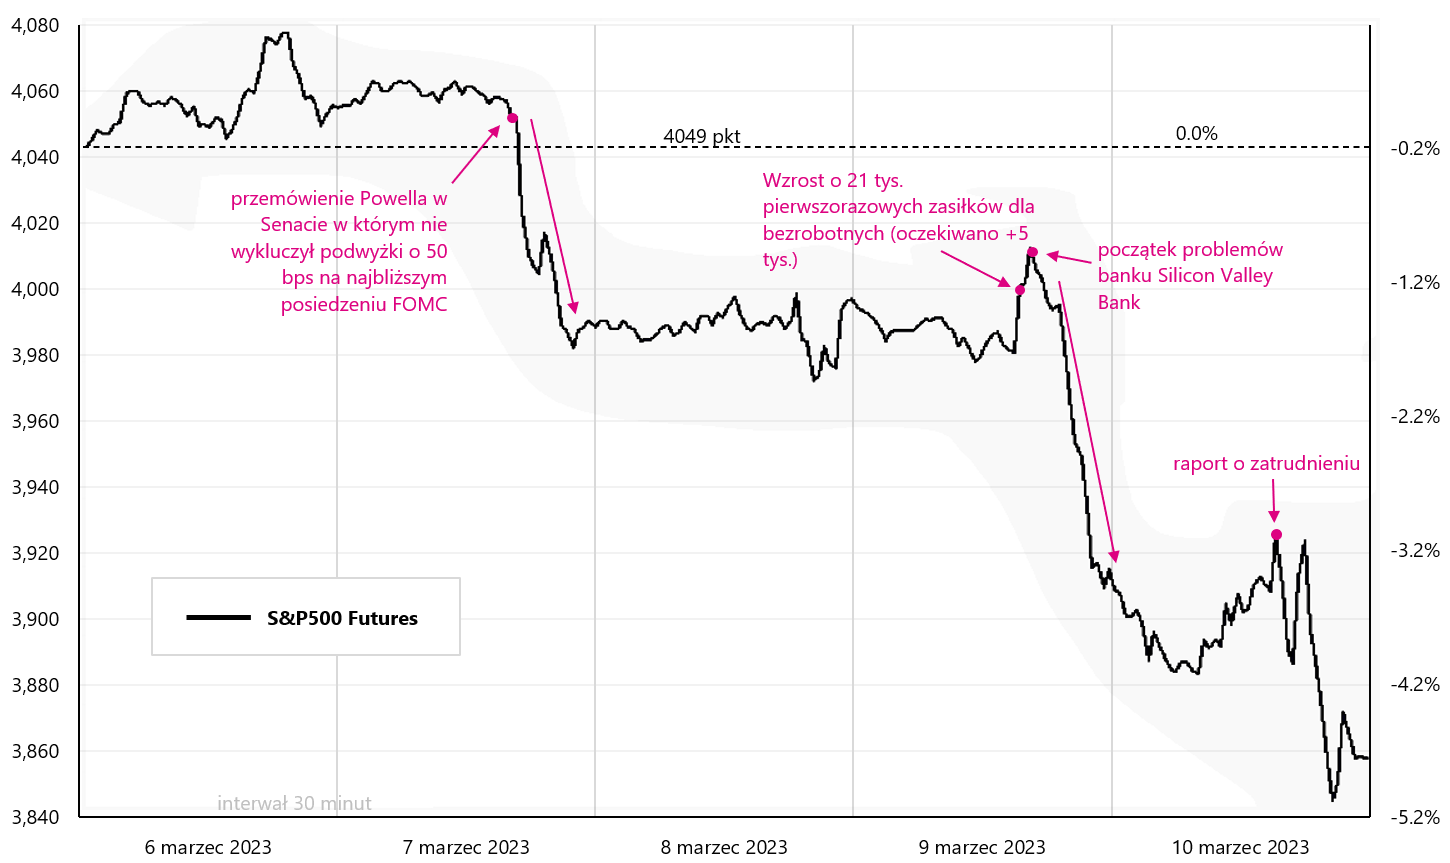
W. 1 S&P500 futures in the past week. Source: own study, stooq.pl
The rapid withdrawal of deposits from the SVB bank (around USD 42 billion in "a few hours") brought it to a close in practically one day. This is basically the most serious such case since the collapse of Lehman Brothers in 2008. The situation affected the quotations of other banks, including, of course, other American regional banks in the first place.
There is an ETF available in the US that invests in US regional banks: SPDR S&P Regional Banking ETF. The chart below shows the behavior of this ETF in the past week. SVB Financial Group had the largest position in this ETF (over 2,3% even before the decline). It is worth watching the behavior of this ETF to see if the situation of SVB does not transfer to other banks (including regional ones). No bank can withstand the withdrawal of most deposits in "one" day.

W. 2 SPDR S&P Regional Banking ETF in the past week. Source: own study, stooq.pl
American stocks cannot count the past week as successful. Of course, due to the closure of the SVB bank the financial sector lost the most and the iShares S&P500 Financial Sector ETF fell 8,6% last week. The S&P500 fell 4,5% and the Nasdaq100 -3,7%. Small companies also fell quite sharply in the past week (iShares Core S&P Small-Cap ETF down 7,6%).
Since the beginning of the year S & P500 is in the black by only 0,6% (Nasdaq100 +8,3%). However, as of February 3, (date of publication of the US employment report for January) US shares are in the correction of the upward wave started in October 2022. From February 2. The S&P500 is down 7,6% and the Nasdaq100 down 7,5%. Details are presented in the table below.

If we look at individual sectors in the S&P500 index, the industries that fell the most in 2022, i.e. Information Technology (iShares S&P500 Information Technology Sector ETF +9,3% in 2023), Communication (iShares S&P500 Communication Sector ETF +8,2%), and Consumer Discretionary (iShares S&P500 Consumer Discretionary Sector ETF +6,9%). These returns can be compared to the S&P500 index, which has only increased +0,6% this year.
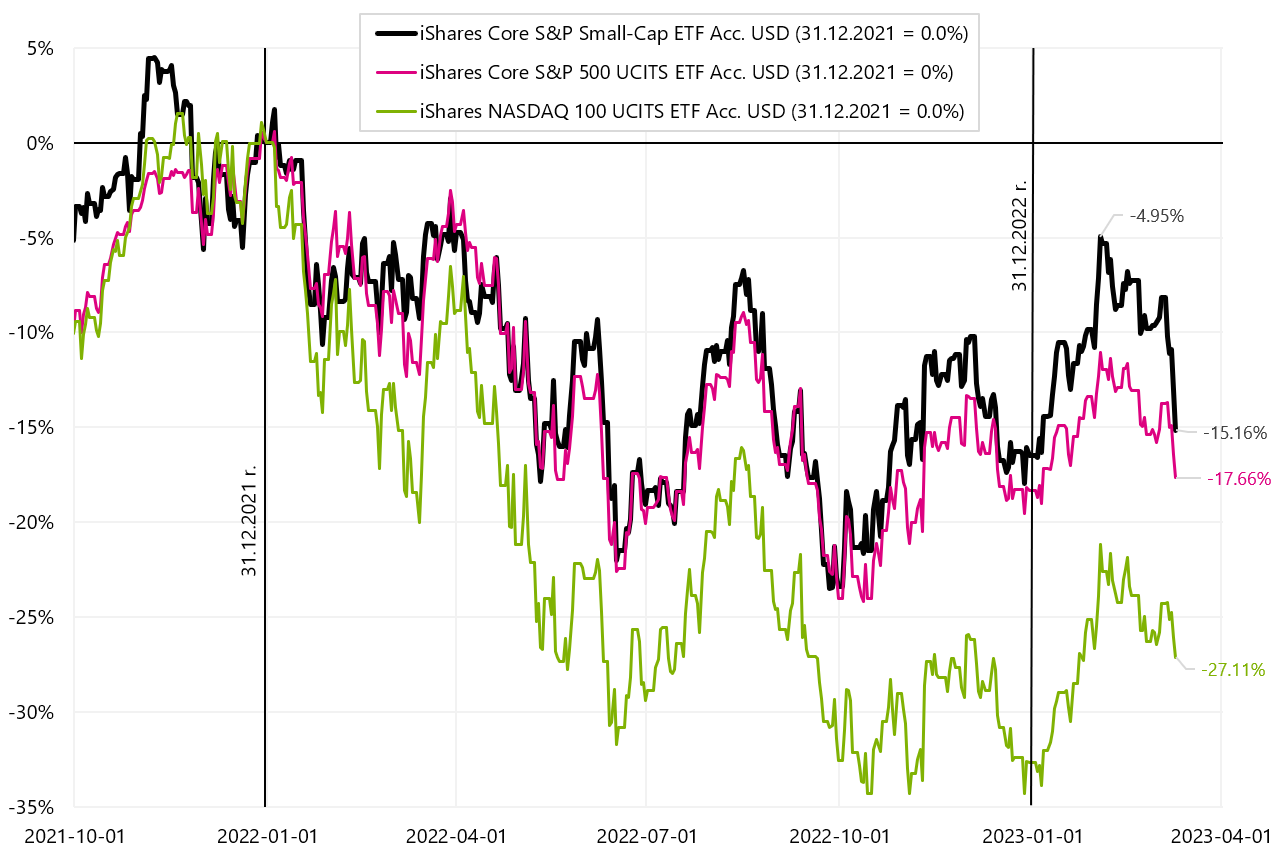
W. 3 iShares Core S&P Small-Cap ETF, iShares Core S&P500 ETF, and iShares Nasdaq 100 ETF until January 10.03.2023, XNUMX. Source: own study, ishares.com
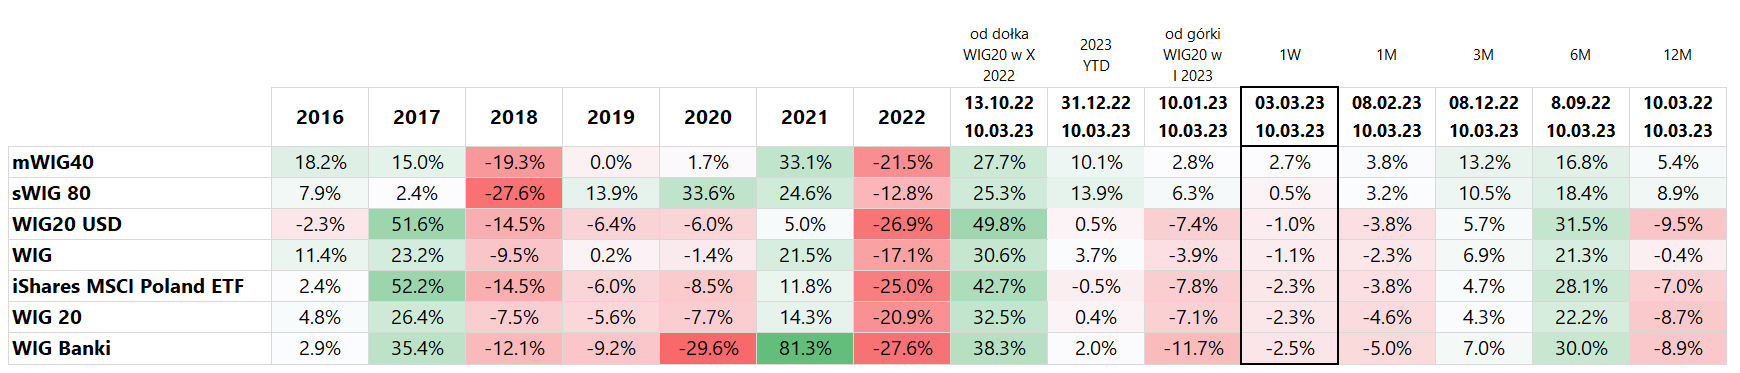
In the past week, apart from small and medium-sized companies, all major Polish stock indices fell, with WIG Banki (-2,5%) and WIG20 (-2,3%) falling the most. Of course, on Monday, Polish indices may align the declines with American indices, which fell more strongly on Friday after the close in Poland. Small and medium-sized companies are still doing best in Poland. sWIG80 has increased by 13,9% since the beginning of the year, and mWIG40 by 10,1%. Similarly, these two indices closed the past week in the black. Of course, these are market segments with lower turnover: for example, on Friday the turnover on sWIG80 amounted to PLN 35 million, on mWIG40 it was already PLN 123 million, and on WIG20 as much as PLN 669 million.
The WIG20 set its last peak on January 10 this year. and has been down 7,1% since then, while WIG Banki has fallen 11,7% over the same period. This correction does not disturb small companies, which continue their growth despite the declines of large companies (sWIG80 increased +6,3% since January 10 this year). Details are presented in the table below.
The situation on Polish indices since the beginning of 2022 is presented in the chart below. It can be said that sWIG80 is currently "playing" in a different league and was even in the black for a while last week (counting from December 31.12.2021, XNUMX).
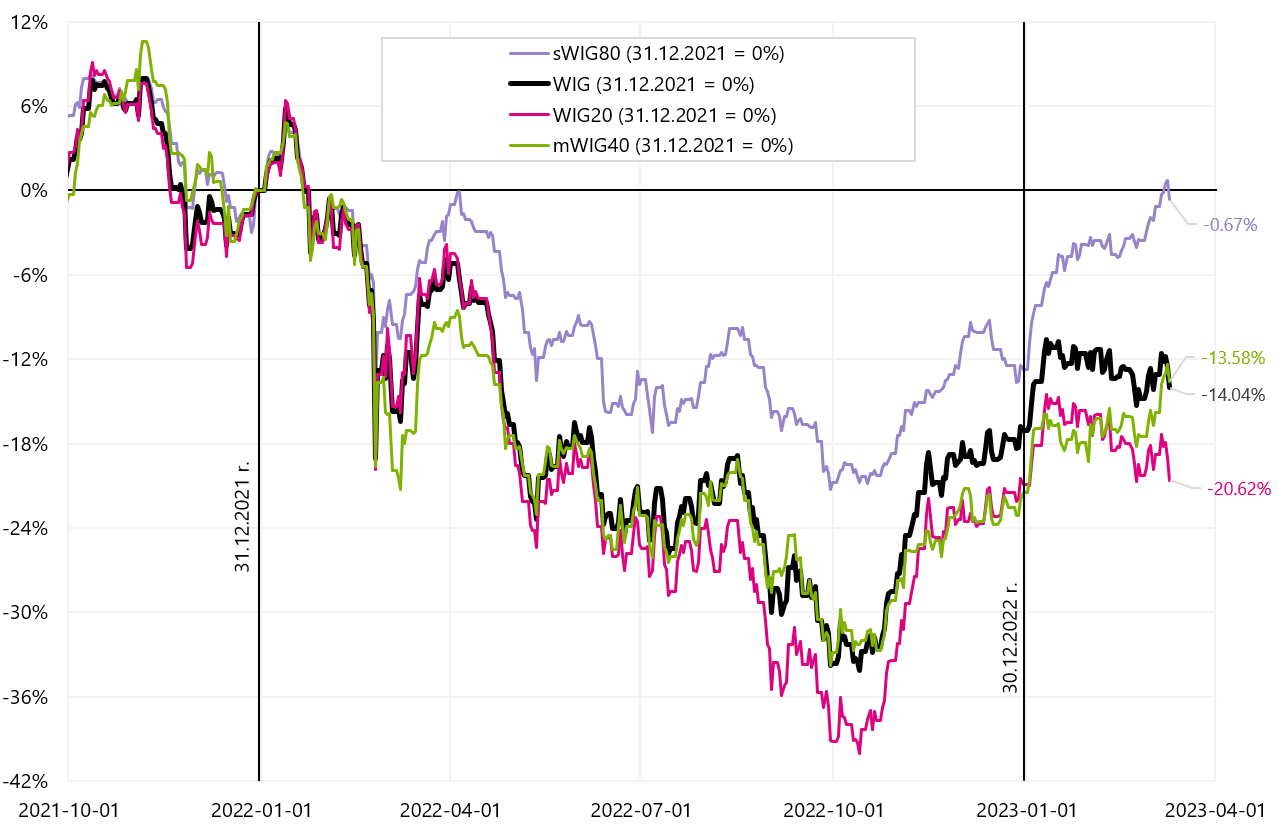
W. 4 Polish indices until December 10.03.2023, XNUMX. Source: own study, stooq.pl
It is also worth looking at how debt ETFs behaved last week, because real "miracles" happened in this market segment. First, due to Powell's hawkish speech, 2-year bond yields jumped to 5,08% (+20bps) before falling to 4,59% on Thursday and Friday, down almost 50bps in 2 days !
The last time such things happened was after the bankruptcy of Lehman Brothers in 2008. The decline in yields could also have been slightly affected by employment data in February (among others due to rising unemployment rate and participation rate). The results of selected debt ETFs are presented in the table below.
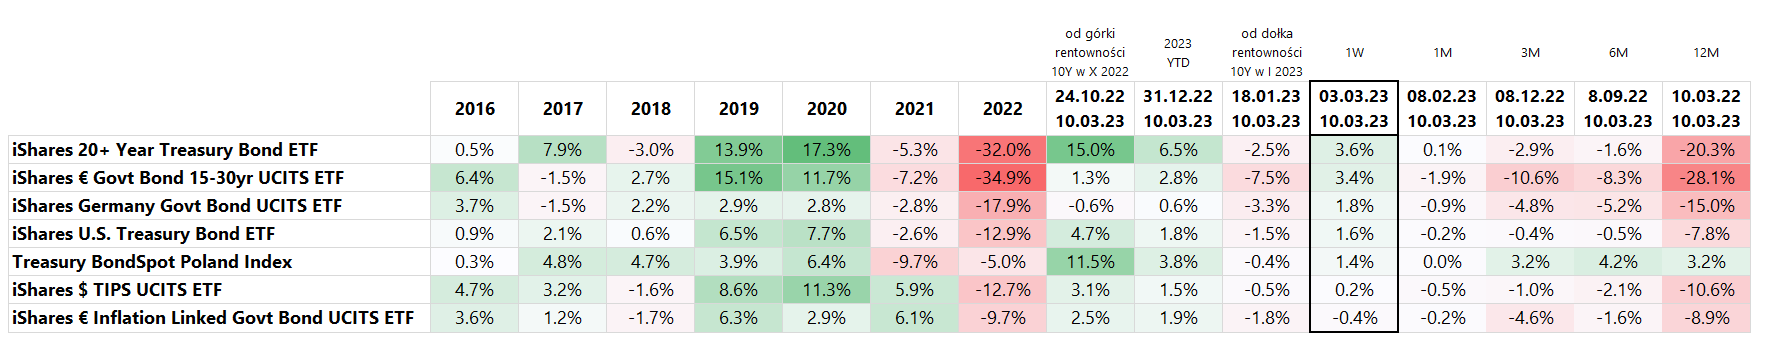
In the past week, he brought the biggest profits iShares 20+ Year Treasury Bond ETF (+3,6%) and iShares Euro Govt Bond 15-30yr ETF (+3,4%). Generally, the longer the duration of a given ETF, the higher our rates of return. The next chart shows the above two ETFs in the period from early 2023.

W. 5 American, European and Polish treasury bonds until March 10.03.2023, 2023 (from the beginning of XNUMX). Source: own study, ishares.com, stooq.pl
More about current cycle and how it differs from previous ones we wrote a week ago. In general, due to the rapid rise in inflation, the stock market "started" the cycle of declines too early compared to the classic cycle. This may have significant investment consequences, for example the construction of the market in January and February this year. the “soft landing” or even “no landing” narrative could not be more wrong. The charts below show the recent cycles of interest rate increases by the FED with the moment when we had a bullish peak on the S&P500 index marked.
As a rule, the peaks occur after the end of the cycle of interest rate increases, and not before, as in 2022. The S&P500 peaked in 2000 9 months after the first rate hike, in 2007 it was 40 months after the first rate hike, and in 2020 the peak occurred only 50 months after the first rate hike.
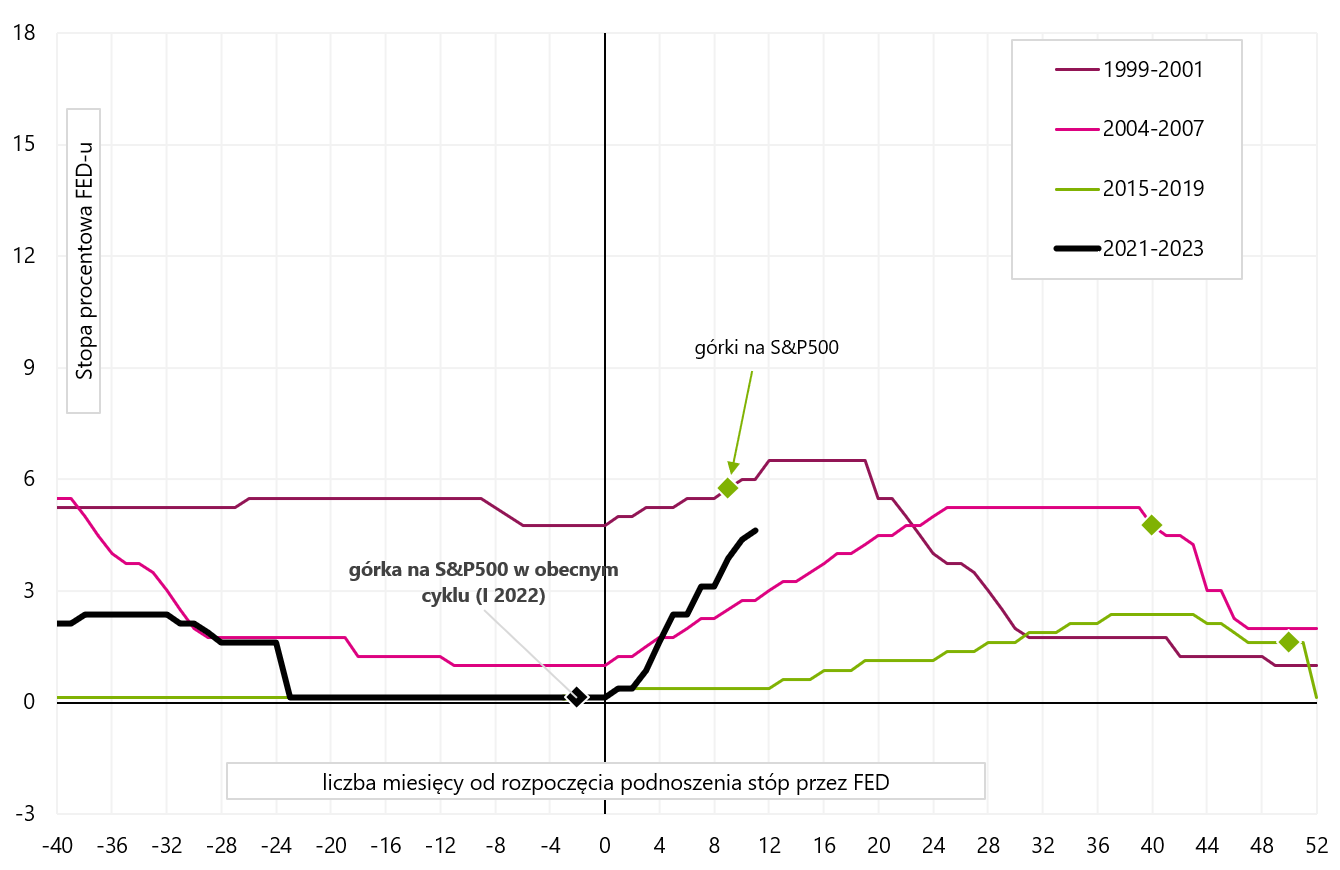
V.6 Last 4 cycles of rate hikes by the Fed. Source: own study, FRED
The S&P 500 in the 70s set the hills faster after the start of the rate hike cycle. As for 1980, it was very specific, between two recessions, with high Fed rates and rapid cuts and hikes (also not very representative). In contrast, two cycles of rate hikes, started in 1967 and 1972, resulted in an increase in the S&P 500 only 11 and 16 months after the first increase (these cycles are similar to the current one due to high inflation).
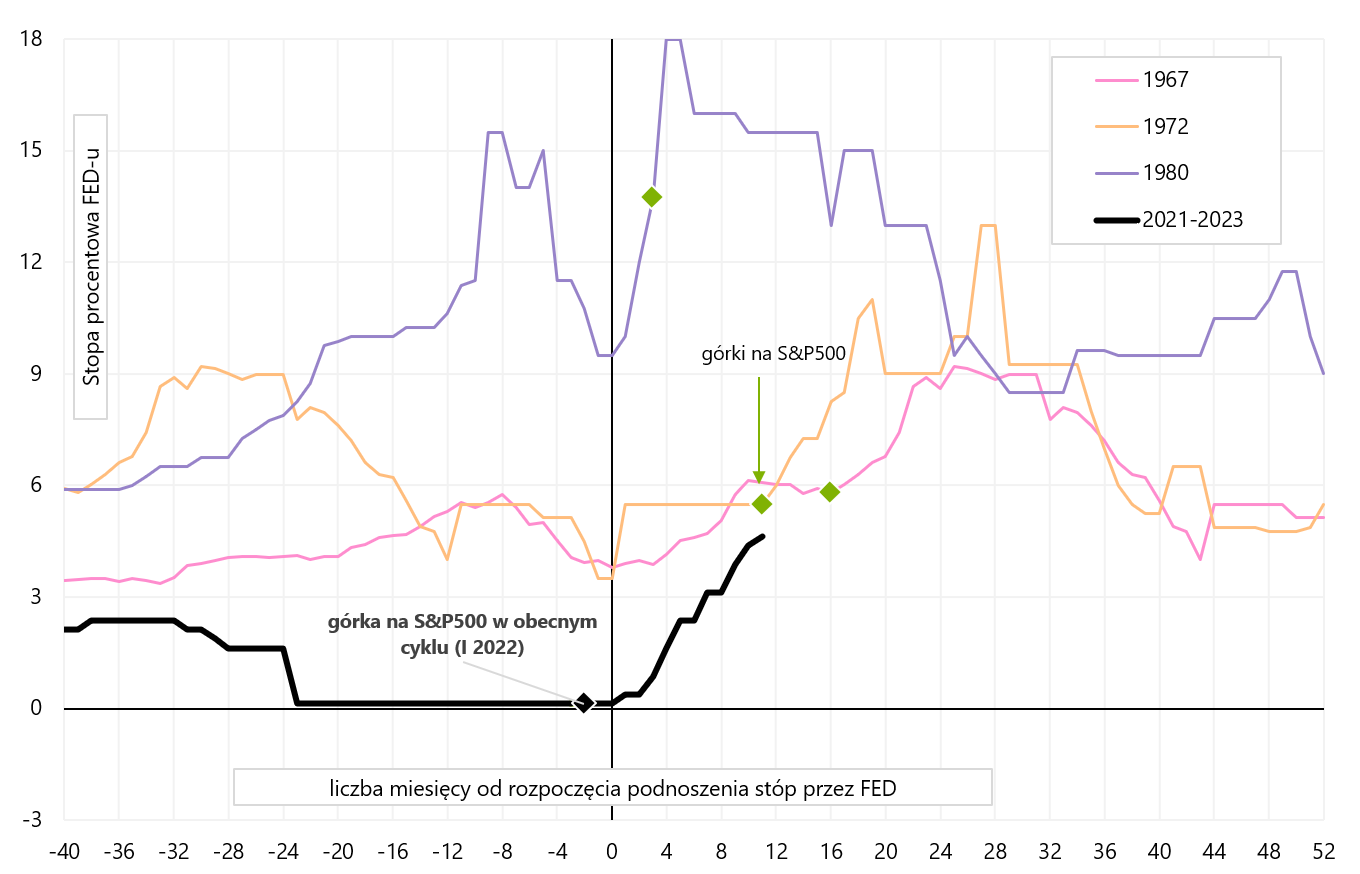
W. 7 Fed rate hike cycles in the 70s. Source: own study, FRED
One of the main consequences of the "early" fall in stocks in this cycle may be that the stock market bear market may last longer than average (stocks have to "wait" for the actual cycle in the economy). We had a somewhat similar situation in 2000, when the S&P 500 peaked 12 months before the formal start of the recession. This is one of the reasons why the 2000-2002 bear market was the longest in post-war history (and in fact twice as long as the average bear market).
A comparison of the current stock market cycle to 2000-2002 is presented in the chart below (the median decline during the bear market and the median length of the bear market were calculated based on all bear markets after 1948, defined as falls in the S&P500 index above 20%, at closing prices). We are currently approaching the median length of the bear market. As in the cycle from 2000-2002, at the current stage of the bear market, the decline of the S&P500 from the top of the previous bull market is similar (about 17-19%).
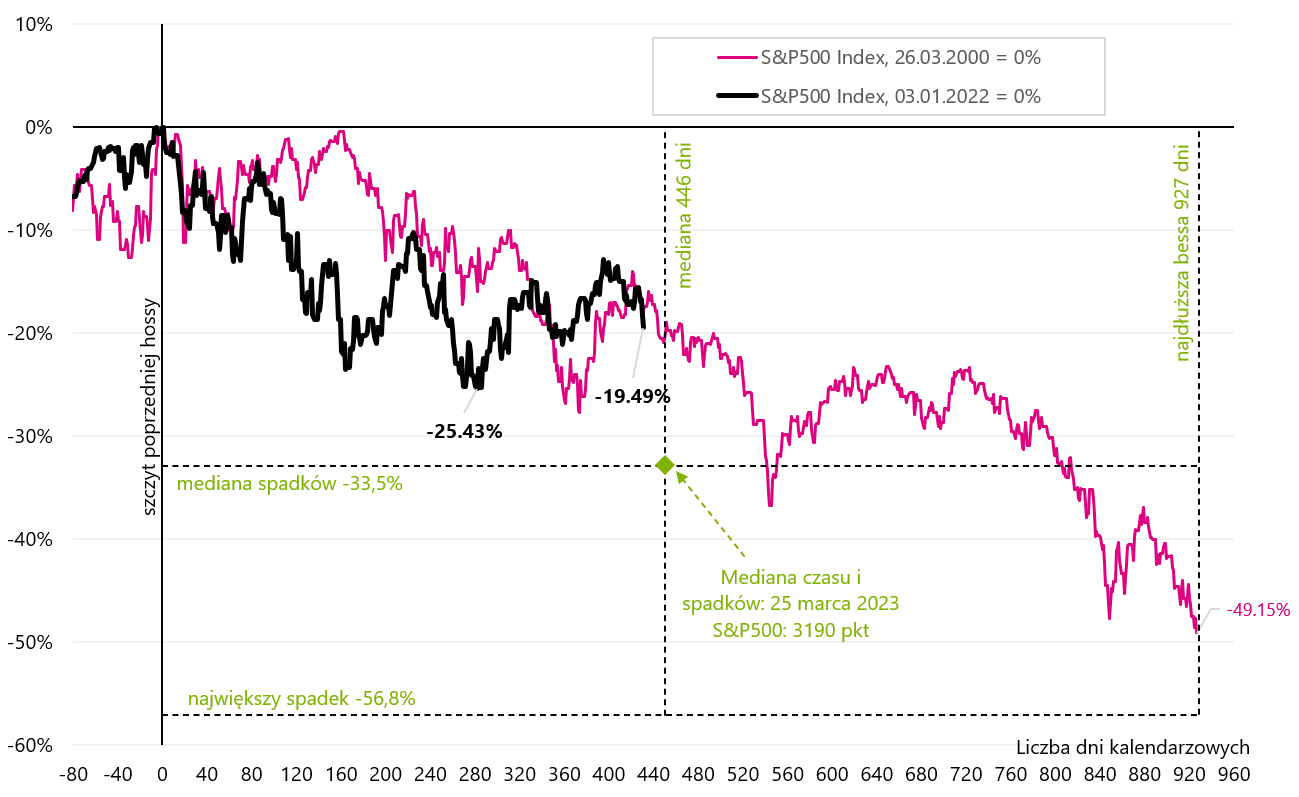
W. 8 Cycle 2022 compared to the bear market of 2000-2002. Source: own study, stooq.pl
US labor market
It can be said that the strong labor market in the US allows the Fed to raise interest rates further. And indeed, February 2023 is another month when the labor market added many more jobs than analysts expected (this is the 10th month in a row when analysts' expectations were exceeded). According to the Establishment Survey, as many as 311 new jobs arrived in February. jobs (225 expected). The 3-month average employment change slightly increased to 351. per month (in February it was 344 thousand). J. Powell looks at the 3-month average, also from his perspective employment growth is accelerating.
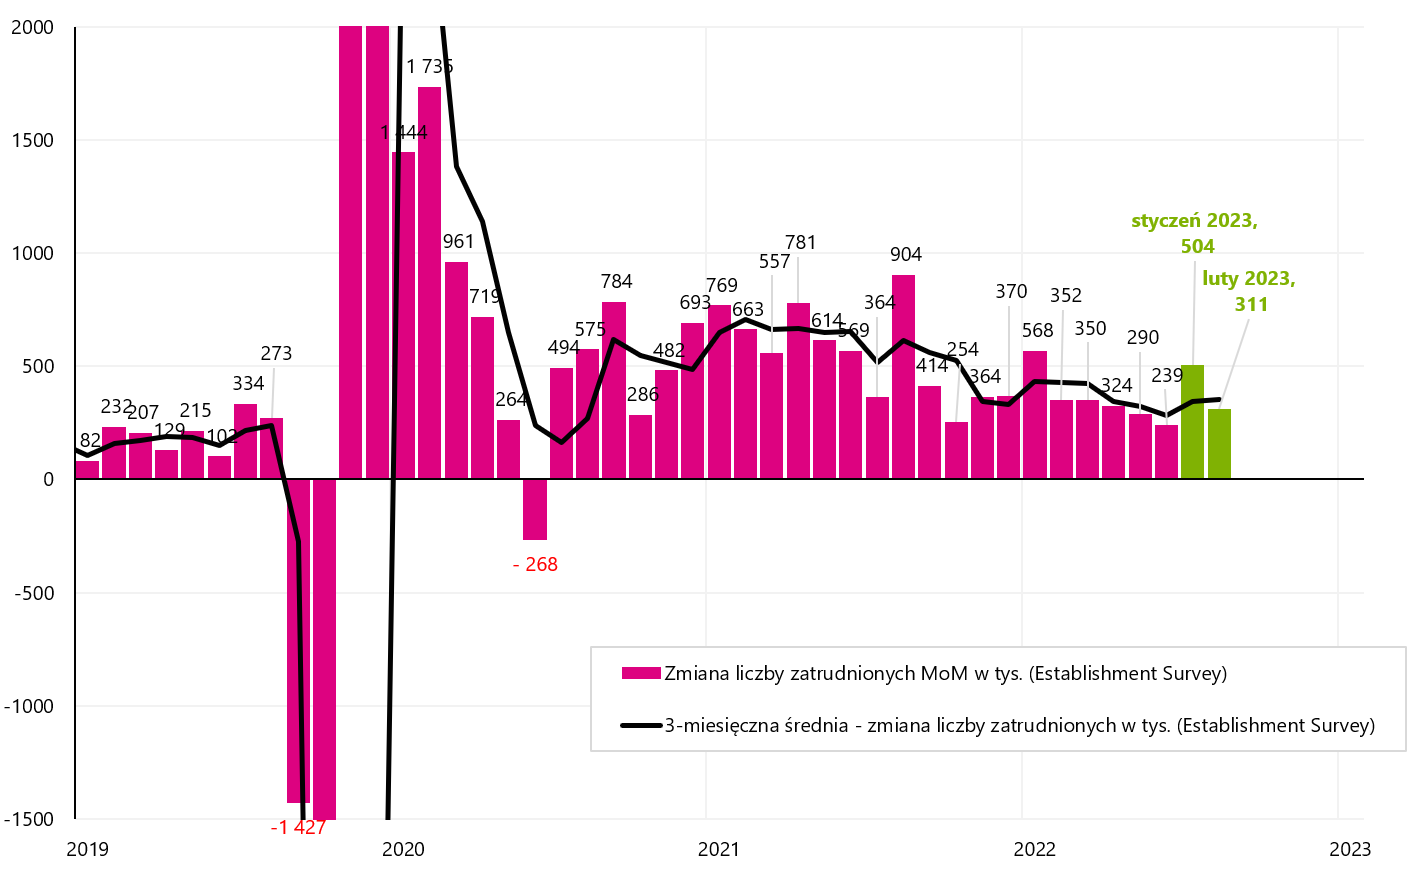
W. 9 Monthly employment change according to the Establishment Survey (and 3-month rolling average). Source: own study, FRED
Nevertheless, the employment report shows the first more clear signs of a slowdown in the labor market. namely the unemployment rate rose to 3,6% (from 3,4%) confirming the recent spike in first-time unemployment benefits (so-called initial claims), which, according to recent data, jumped to 211. from 190 thousand A jump in the unemployment rate by 0,2 point (after the previous 3 months of declines) may be the first signal that interest rate hikes are finally starting to affect the labor market (paradoxically, in the current market regime this may be good news for stocks, as it means fewer rate hikes ).
A signal of an impending recession often found in various analyzes is an increase in the unemployment rate above the 12-month moving average (also calculated for the unemployment rate). The February average was 3,58%. We present it in the chart below.
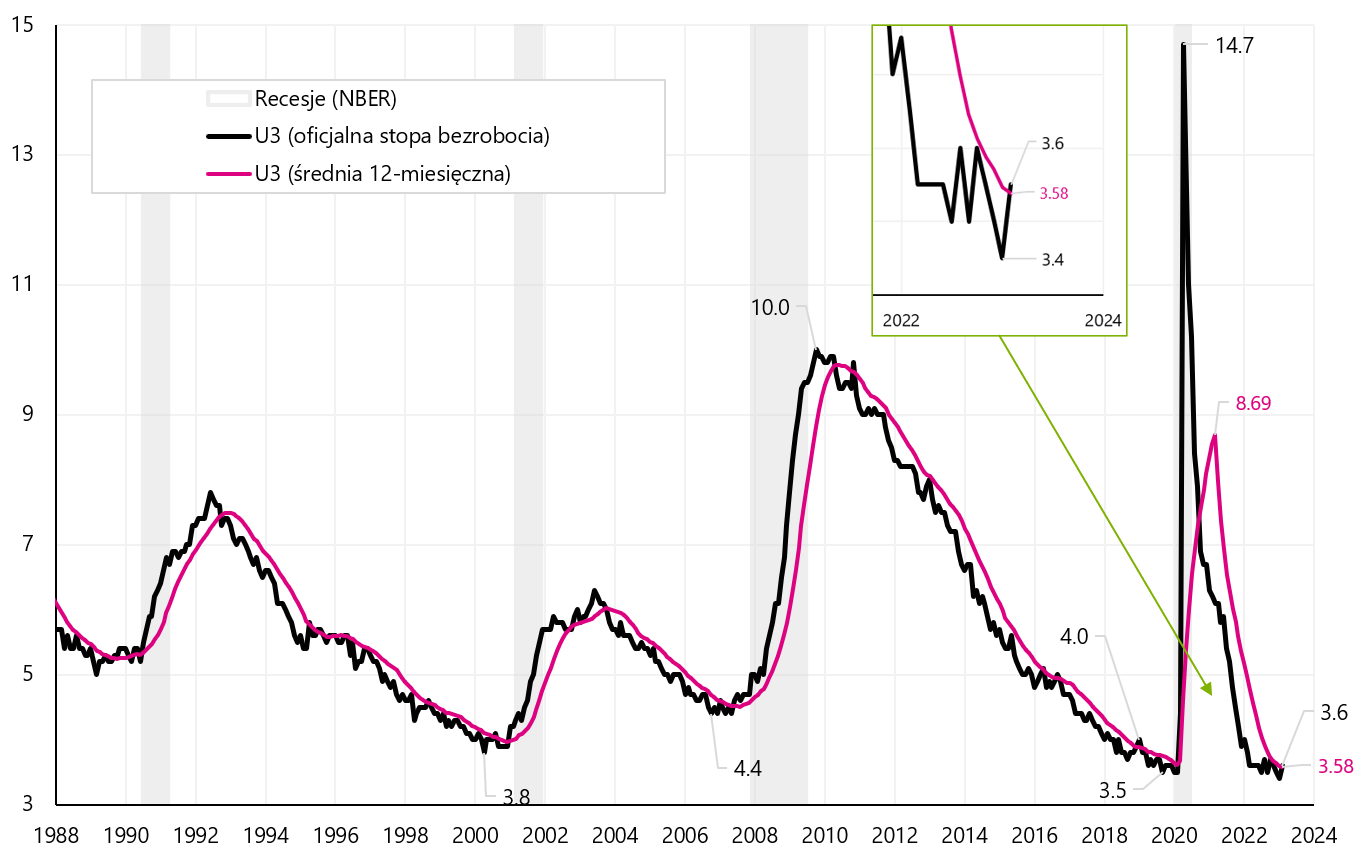
W. 10 Unemployment rate (and a rolling 12-month average). Source: own study, FRED
Formally, therefore, we have an upward breakout of the 12-month average. In previous cycles, this signal worked well, with an average of 10 months left until recession (see next chart).
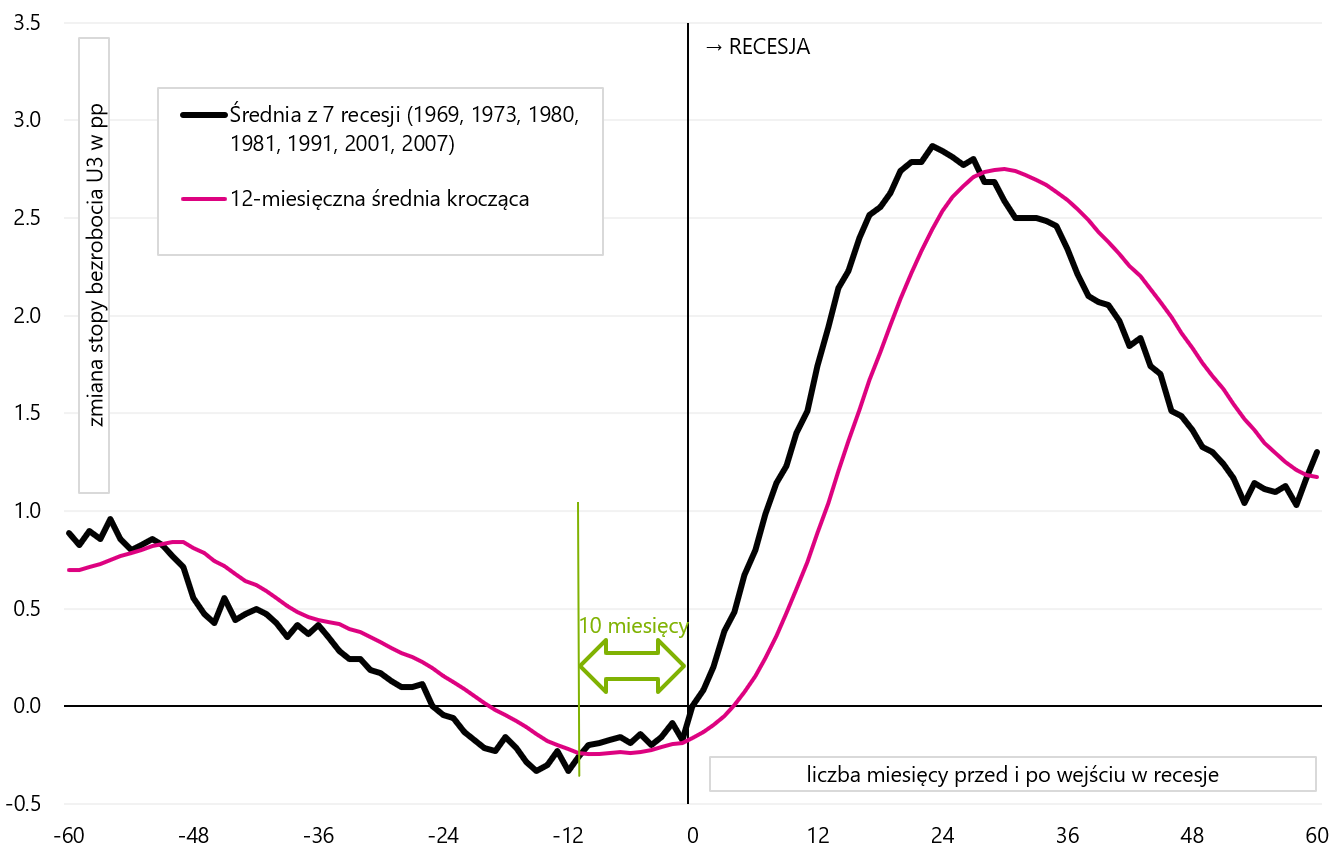
W. 11 The average path of the unemployment rate before and after the economy entered recession (and 12-month rolling average change). Source: own study, FRED
Of course, you should wait for confirmation both in the growing unemployment rate (e.g. for the next 2-3 months), but we can also get such confirmation by tracking weekly data on unemployment benefits (initial claims and unemployment rate "walk" together). Formally, the unemployment rate was 3,60%, but the BLS (Bureau of Labor Statistics) gives the unemployment rate rounded, so it's best to calculate it yourself, which is presented in the table below.
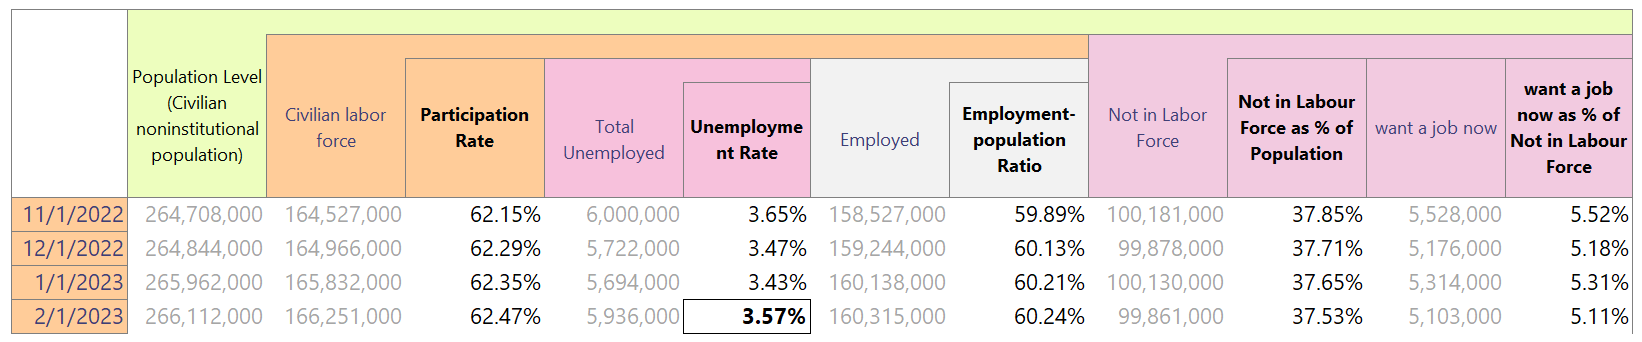
The unemployment rate is obtained by dividing "total unemployed" by "civilian labor force". More precisely, the unemployment rate increased in February this year. by 0,14 points and amounted to 3,57% (i.e. below the 12-month moving average - but it is not of great importance because one should wait for further increases in the unemployment rate in the coming months anyway). A further increase in the participation rate to 62,47% is also a good signal (in favor of smaller rate hikes). The participation rate is obtained by dividing the "civilian labor force" by the "population level".
We also received a good signal in the form of a growing "employment-population ratio" and a falling number of people outside the labor force ("not in labor force"). A potentially bad signal is the declining number of people outside the workforce who would like a job now. This may mean that in the future fewer people will return to the labor market (lower labor supply).
Let's also look at two more graphs, which are also looked at by J. Powell. The first graph is supply vs demand. The supply of employees is the size of the labor force, while the demand on the labor market is the sum of job openings and the level of employment. The imbalance in the labor market improved in February – which is an argument for smaller rate hikes. Currently, the excess of demand over supply is 4,888 million people - while in January it was much more, i.e. 5,5 million people.

W. 12 Supply and demand in the US labor market (series looked at by J. Powell). Source: own study, FRED
In the case of wage growth, the average hourly wage increased by 0,2% in January (market expected 0,3%), but the annual growth rate increased to 4,62% (YoY). Below we present 3 series of salary growth that J. Powell is "looking at" (this is the chart presented by Powell in his presentation at the Brookings Institution).
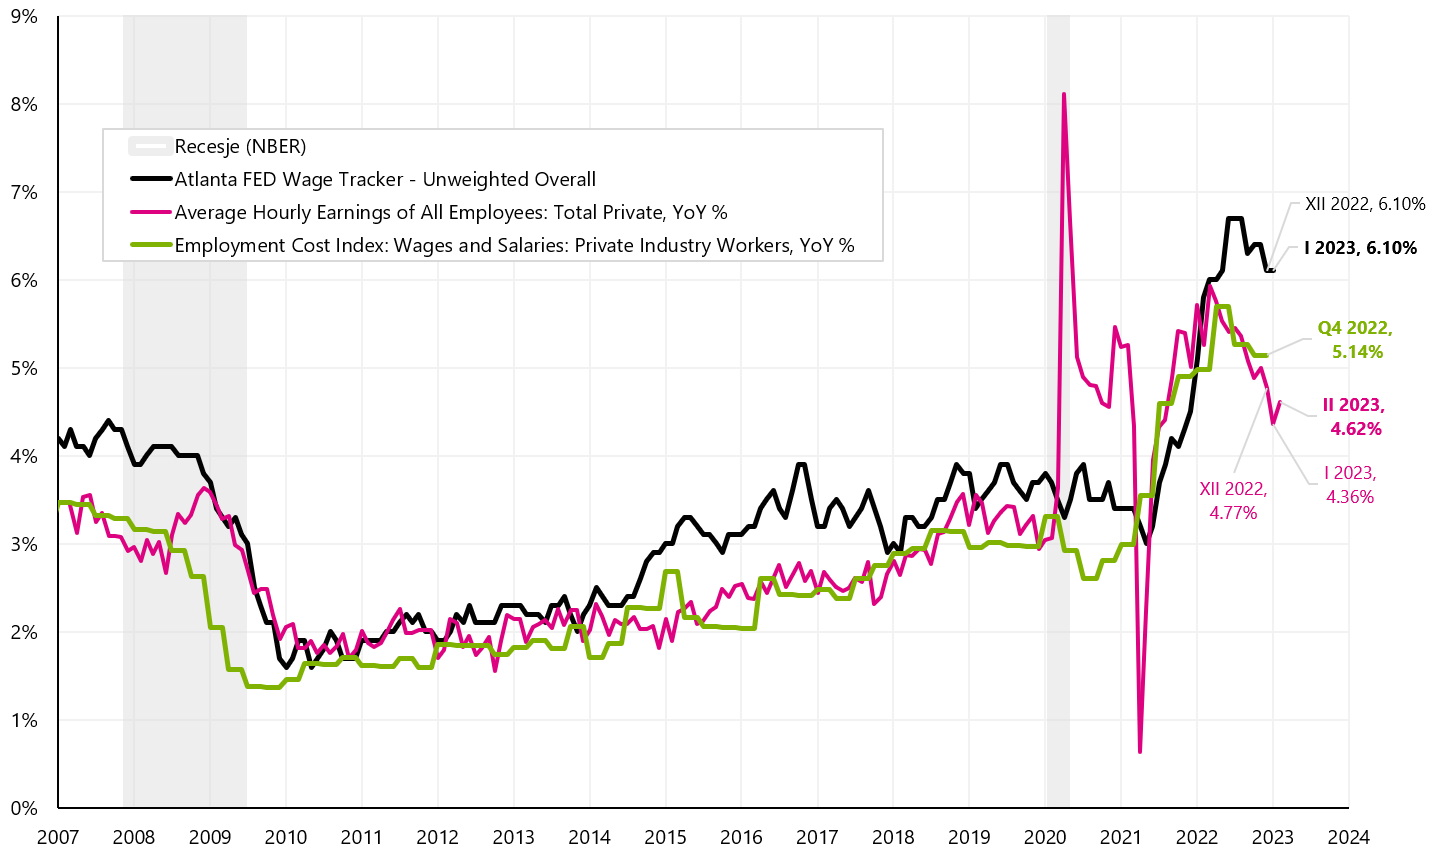
W. 13 Three different US salary series (so-called "Powell chart"). Source: own study, FRED
The trend of the annual change in the hourly rate is declining (the rebound in February should be one-month and we should return to declines in the annual dynamics in March, because in March 2022 we have a "high base" in the form of a monthly increase in the rate by as much as 0,63%). However, the annual dynamics of the Altanta Wage Tracker is declining more slowly. If we look at the unrounded monthly changes (next chart), the salary increased by 0,24% in February (after 0,27% in January), and there was not such a large decrease as suggested by the formal data (the decrease was only 0,03 points, and not 0,1).
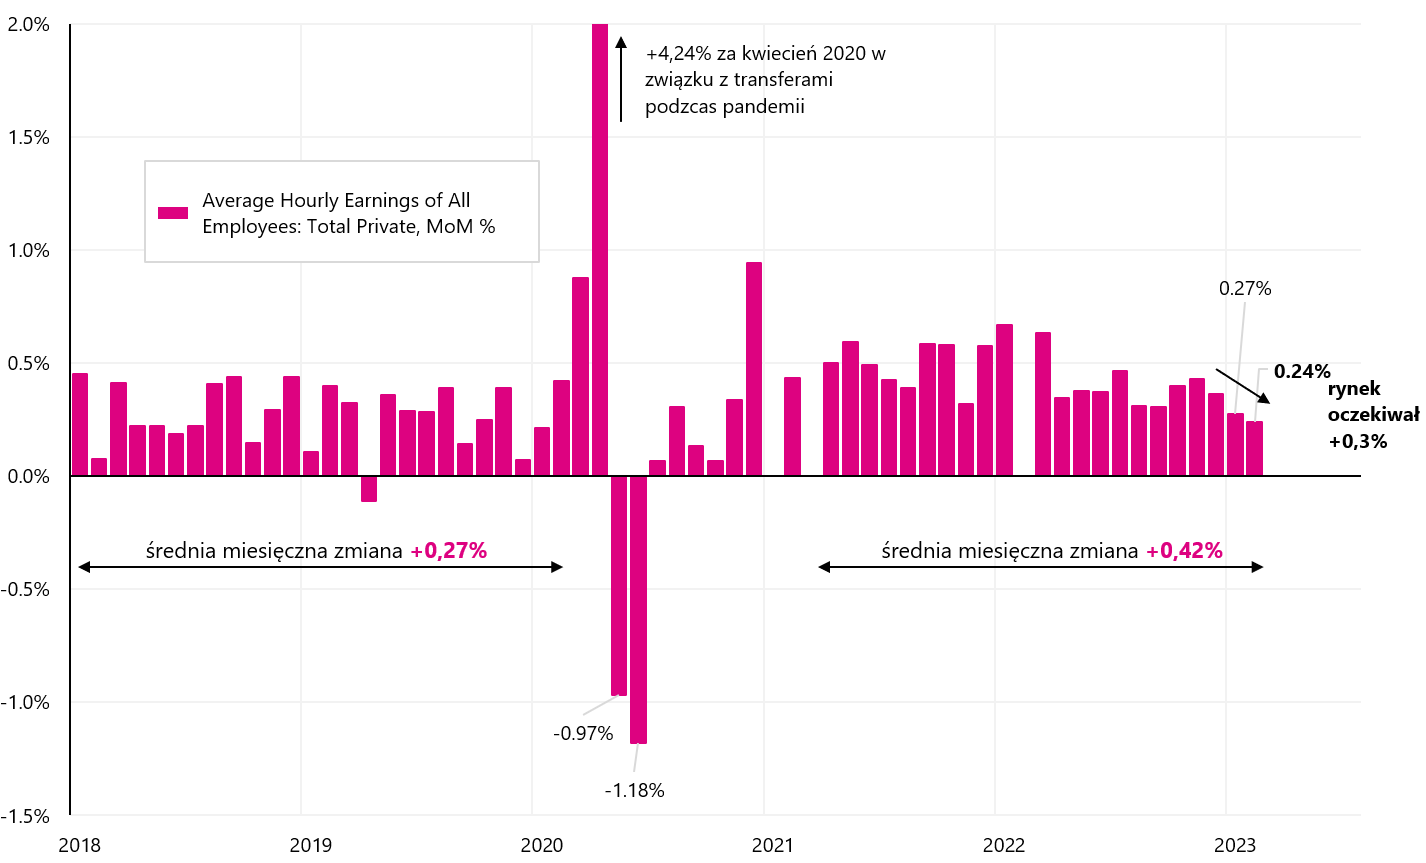
W. 14 Monthly change in US hourly wage rate (for the private sector). Source: own study, FRED
Summing up the report on the labor market, it can be said that "net net" indicates less rate hikes by the FED, despite the formal change in employment by as much as 311. The data proving a possible slowdown in the labor market are higher participation, higher unemployment rate and lower wage growth. The debt market interpreted the report in a similar way (in the form of falling treasury bond yields).
In Poland, the reference rate remains unchanged
Last week it was held in Poland meeting of the Monetary Policy Council and, in line with the broad consensus, the rates remained unchanged. After the rate hike in January in Romania, Poland currently has the lowest prime interest rate in the region. But at least for today it seems that the bar is set very high both in terms of further hikes (formally, according to the Council, the hike cycle has not been completed) and cuts.
Together with the decision on interest rates, we also got to know the latest projection of inflation, GDP and other data prepared by the NBP analysis team. In the case of inflation, the current March projection shows a drop in inflation to 3,1% in the fourth quarter of 2025 and 4,8% in Q4 2024 (in the previous November projection in Q4 2024, inflation was to amount to 4,9% and 3,0% in Q4 2025). Looking at the 2022 projections (March, July and November) we see that they "chasing" the actual inflation up, while in later periods inflation according to these projections returns towards the NBP inflation target.
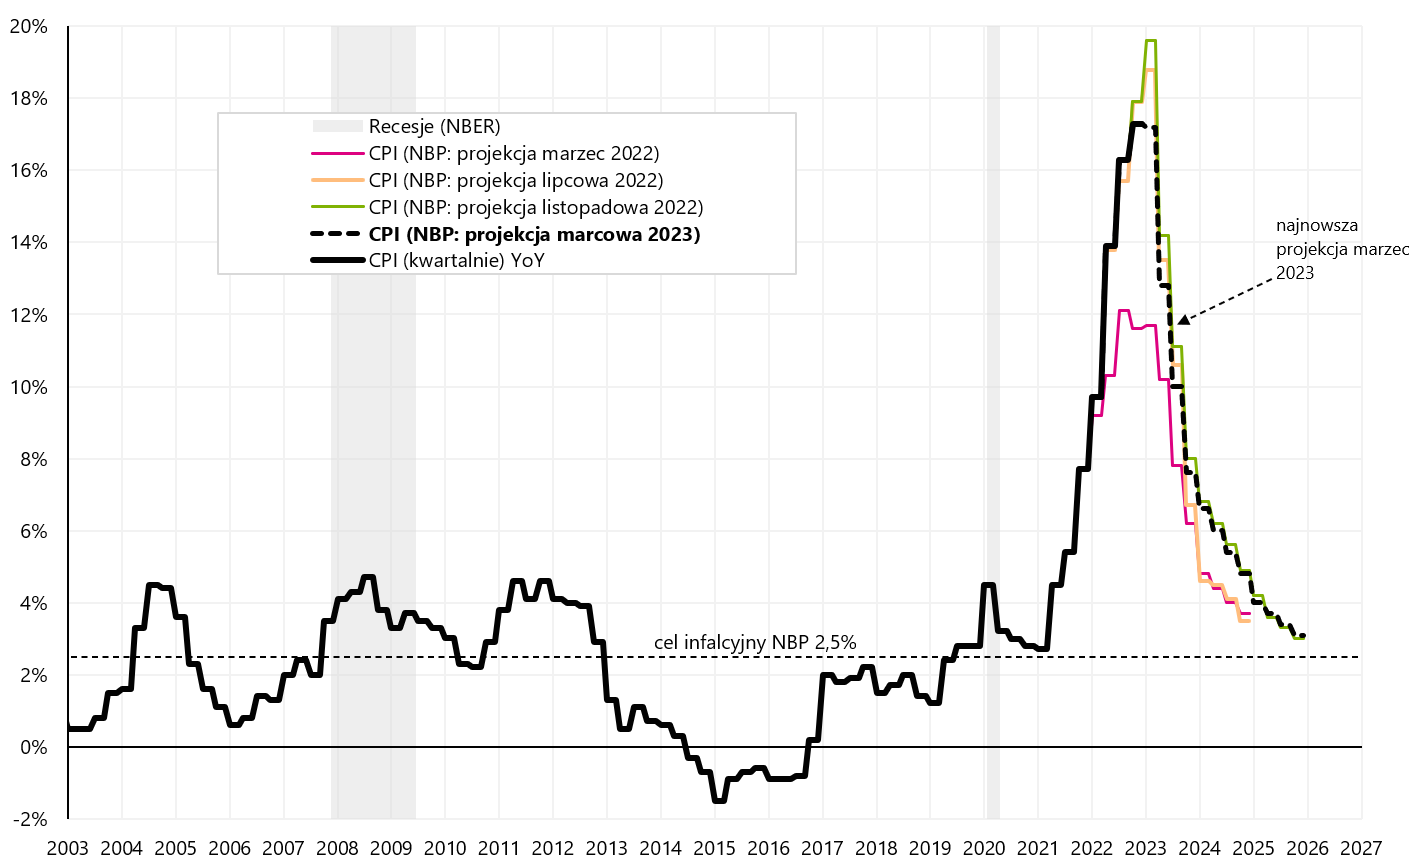
W. 15 Inflation in Poland (quarterly) and the last 4 NBP inflation projections. Source: own study, NBP
Forecasting GDP growth seems to be easier than forecasting inflation, as the projections of this series are more accurate. The latest GDP path projection shows a decline in GDP in Q1 2023 of -0,4% (yoy). However, from the second quarter of 2023, GDP has been growing every quarter until the end of the projection, i.e. until Q4 2025. The chart below presents the actual GDP and the last four NBP projections.
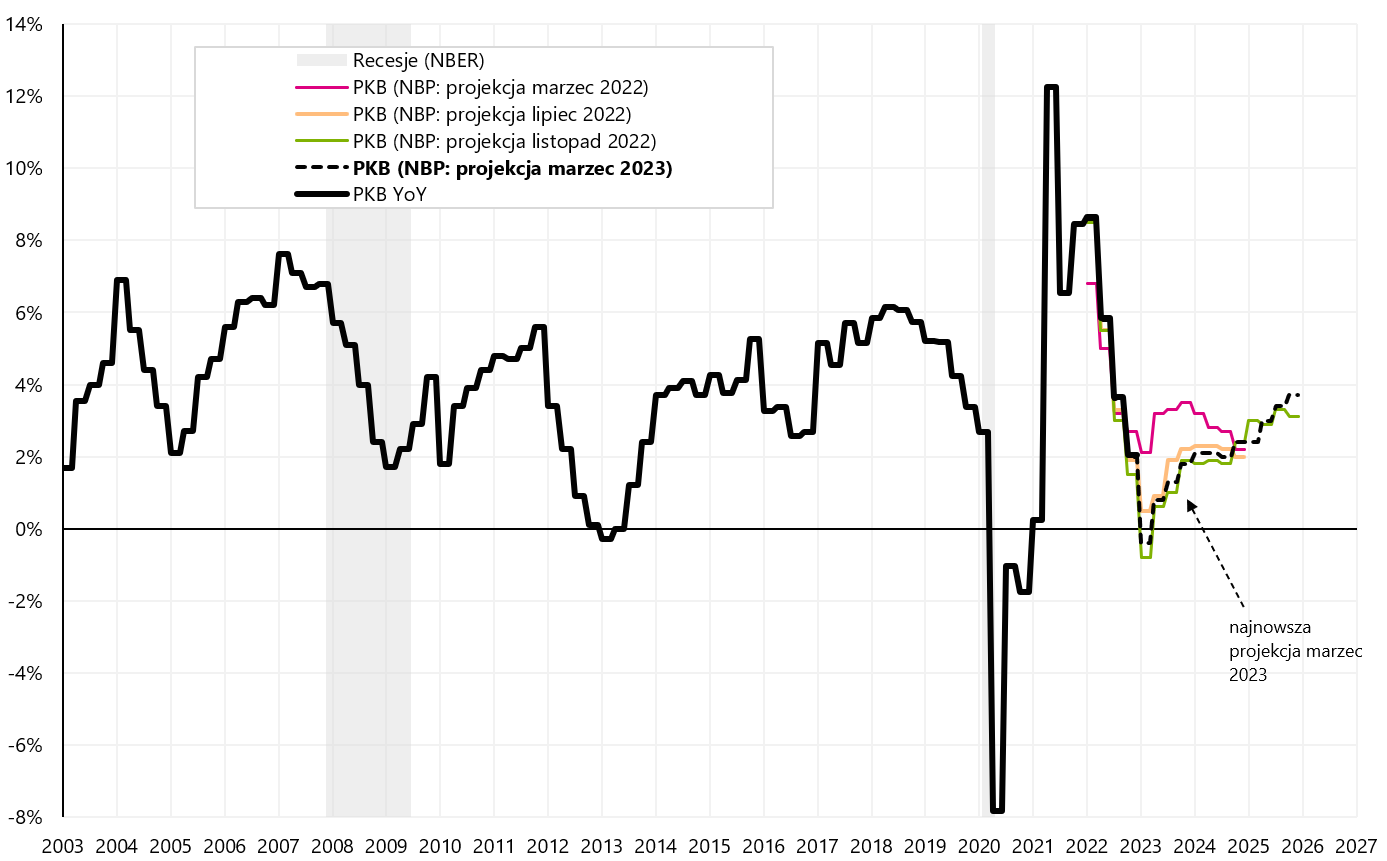
W. 16 GDP in Poland (quarterly) and the last 4 GDP projections. Source: own study, NBP
To sum up, the MPC did not change interest rates as expected. Apart from some stronger macroeconomic shocks, the NBP reference rate should remain at the current level of 6,75% for a long time (although in a positive scenario one can get the impression that the first reduction could take place in autumn 2023). However, according to the current projection, the WIBOR 3M forecast remains unchanged at 6,95% until the end of the projection period, i.e. until Q4 2025.
Summation
Even before the shutdown of SVB bank, we wrote that the most important data points in March will be: (i) US employment report, (ii) US inflation for February 2023 (published on March 14) and of course (iii) FOMC meeting on 21 -22 March this year
However, now it may be crucial for the situation to calm down after the closure of SVB, including the follow-up to its assets and operations (e.g. selling SVB to some other major bank (which should probably be revealed even on Monday). This is a delicate situation, because we will soon find out whether the rapid withdrawal of deposits from the bank in the amount of USD 42 billion paid off for the entities and people who decided to do it - and they did not have much time to decide. If the remaining deposits "forfeit", it will be a signal for the future that it is better to "panic" and withdraw deposits from the bank as soon as possible in case of any problems (of course, we write about deposits above the guaranteed amount).
In 2008, we had a similar situation with Bear Stearns (before the bankruptcy of Lehman Brothers). Then the markets calmed down. JPMorgan Chase finally acquired Bear Stearns in March 2008. Lehman didn't happen until September 2008.
About the Author
 Jaroslaw Jamka - Experienced fund management expert, professionally associated with the capital market for over 25 years. He holds a PhD in economics, a license of an investment advisor and a securities broker. He personally managed equity, bond, mutli-asset and global macro cross-asset funds. For many years, he managed the largest Polish pension fund with assets over PLN 30 billion. As an investment director, he managed the work of many management teams. He gained experience as: Member of the Management Board of ING PTE, Vice-President and President of the Management Board of ING TUnŻ, Vice-President of the Management Board of Money Makers SA, Vice-President of the Management Board of Ipopema TFI, Vice-President of the Management Board of Quercus TFI, Member of the Management Board of Skarbiec TFI, as well as Member of Supervisory Boards of ING PTE and AXA PTE. For 12 years he has specialized in managing global macro cross-asset classes.
Disclaimer
This document is only informative material for use by the recipient. It should not be understood as an advisory material or as a basis for making investment decisions. Nor should it be understood as an investment recommendation. All opinions and forecasts presented in this study are only the expression of the author's opinion on the date of publication and are subject to change without notice. The author is not responsible for any investment decisions made on the basis of this study. Historical investment results do not guarantee that similar results will be achieved in the future.


