Gold is getting closer to consolidation
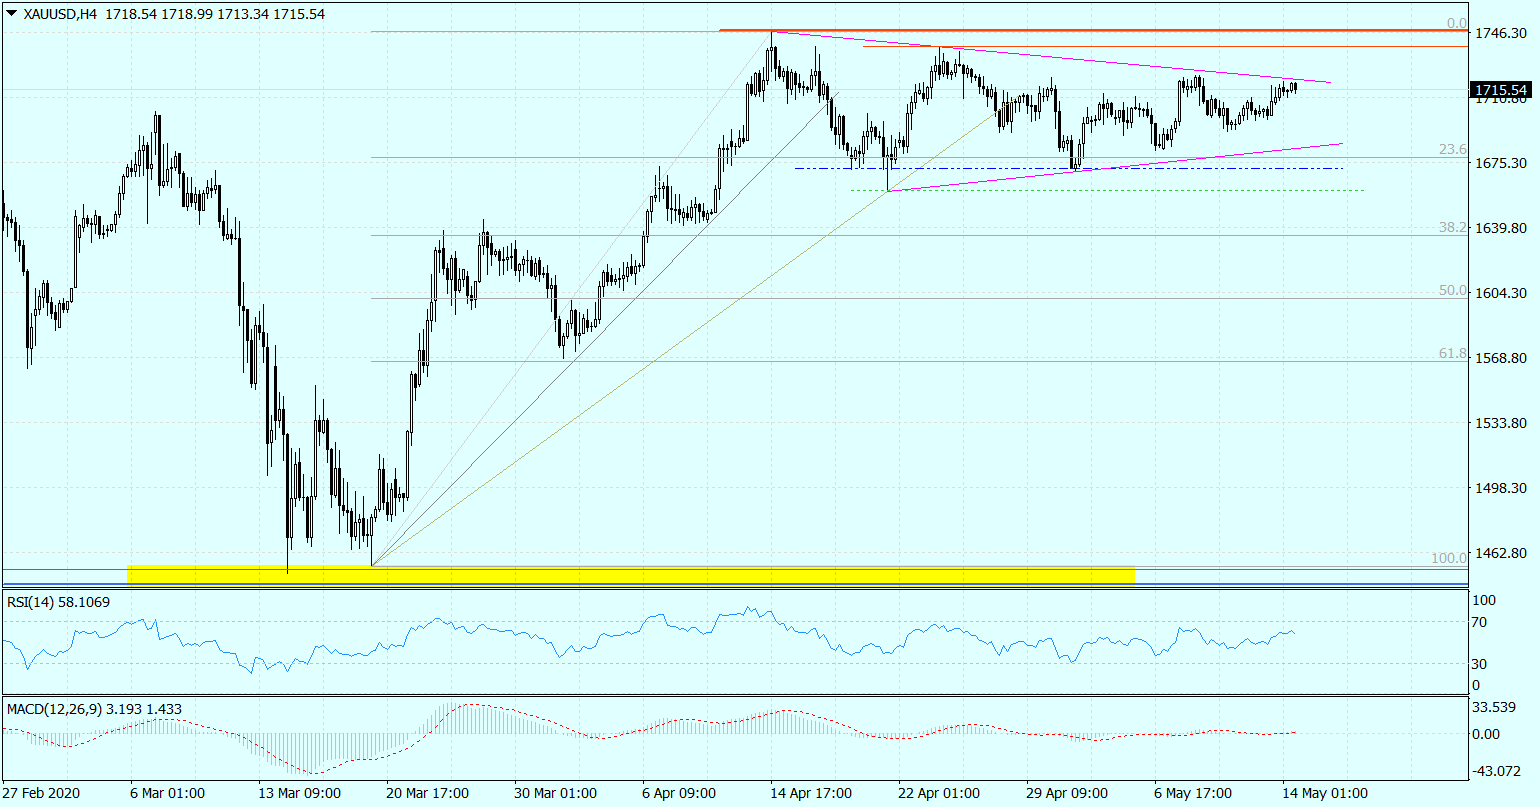
Gold it has been in consolidation for a month just below the 7th summer peak (USD 1747,14) set in April, and in the last two weeks this consolidation has narrowed even further to around USD 1700.
Gold with a chance of breaking out
In the H4 chart, the last fluctuations can be closed by two lines drawn down the holes and the tops, respectively, forming the flag formation. Her narrowing arms mean that there is less and less space for free swinging. For traffic that will not generate any signals. Its upper limit, which is currently being tested, is at the level of 1720,50 USD. Lower at 1683,40 USD.

XAU / USD chart, D1 interval. Source: MT4 Tickmill.
The formation of the flag usually occurs as a continuation formation, so the risk of breaking out and subsequent breaking above the April maximum at USD 1747,14 is theoretically a more likely scenario. However, on the XAU / USD H4 indicators and on the charts in other time compressions (daily, weekly), there is no need to look for strong signals confirming a greater chance of breaking out from above. In practice, therefore, it may be that the side of the market that will definitely attack first, snatching gold prices from a few weeks of stagnation, this one will simply win. It is worth observing the situation on gold, waiting for its quotations to break.


![Forex Club – Tax 9 – Settle tax on a foreign broker [Download the Application] Forex Club - Tax 9](https://forexclub.pl/wp-content/uploads/2024/02/Forex-Club-Podatek-9-184x120.jpg?v=1709046278)
![Trading View platform – solutions tailored to the needs of traders [Review] trading view review](https://forexclub.pl/wp-content/uploads/2024/03/trading-view-recenzja-184x120.jpg?v=1709558918)
![How to connect your FP Markets account to the Trading View platform [Guide] fp markets trading view](https://forexclub.pl/wp-content/uploads/2024/02/fp-markets-trading-view-184x120.jpg?v=1708677291)
![How to invest in ChatGPT and AI? Stocks and ETFs [Guide] how to invest in chatgpt and artificial intelligence](https://forexclub.pl/wp-content/uploads/2023/02/jak-inwestowac-w-chatgpt-i-sztuczna-inteligencje-184x120.jpg?v=1676364263)


![Izabela Górecka – “Success on the market depends not only on knowledge, but also on emotional stability” [Interview] Izabela Górecka - interview](https://forexclub.pl/wp-content/uploads/2024/04/Izabela-Gorecka-wywiad-184x120.jpg?v=1713870578)
![WeWork – the anatomy of the collapse of a company valued at $47 billion [WeWork, part II] wework bankruptcy story](https://forexclub.pl/wp-content/uploads/2024/04/wework-bankructwo-historia-184x120.jpg?v=1711729561)
![Adam Neumann – the man who screwed up Softbank [WeWork, part AND] adam neumann wework](https://forexclub.pl/wp-content/uploads/2024/04/adam-neumann-wework-184x120.jpg?v=1711728724)


![How to transfer shares to another brokerage office [Procedure description] how to transfer shares to another brokerage house](https://forexclub.pl/wp-content/uploads/2024/03/jak-przeniesc-akcje-do-innego-biura-maklerskiego-184x120.jpg?v=1709556924)
![The most common mistakes of a beginner trader - Mr Yogi [VIDEO] Scalping - The most common mistakes of a beginner trader - VIDEO](https://forexclub.pl/wp-content/uploads/2024/03/Scalping-Najczestsze-bledy-poczatkujacego-tradera-VIDEO-184x120.jpg?v=1711601376)
![Learning patience: No position is also a position - Mr Yogi [VIDEO] Scalping - Learning patience - No position is also a position - VIDEO](https://forexclub.pl/wp-content/uploads/2024/03/Scalping-Nauka-cierpliwosci-Brak-pozycji-to-tez-pozycja-VIDEO-184x120.jpg?v=1710999249)
![When to exit a position and how to minimize losses - Mr Yogi [VIDEO] Scalping - When to exit a position and how to minimize losses - VIDEO](https://forexclub.pl/wp-content/uploads/2024/03/Scalping-Kiedy-wyjsc-z-pozycji-i-jak-minimalizowac-straty-VIDEO-184x120.jpg?v=1710336731)


Leave a Response