


Stronger and stronger arguments for the strengthening of gold

Memories of the global financial crisis have come flooding back in recent weeks as financial markets have been rocked by the worst turbulence in the banking sector since 2008. Collapse of the Silicon Valley Bank i Credit Suisse issues triggered a wave of chaotic transactions in all markets, especially in the bond market, which remains the glue of the whole system. The reaction to these still developing events was a sharp decline in US bond yields, a sharp correction in the future trajectory of interest rates in the US and an increase in demand for the Japanese yen and gold as safe-haven investments.
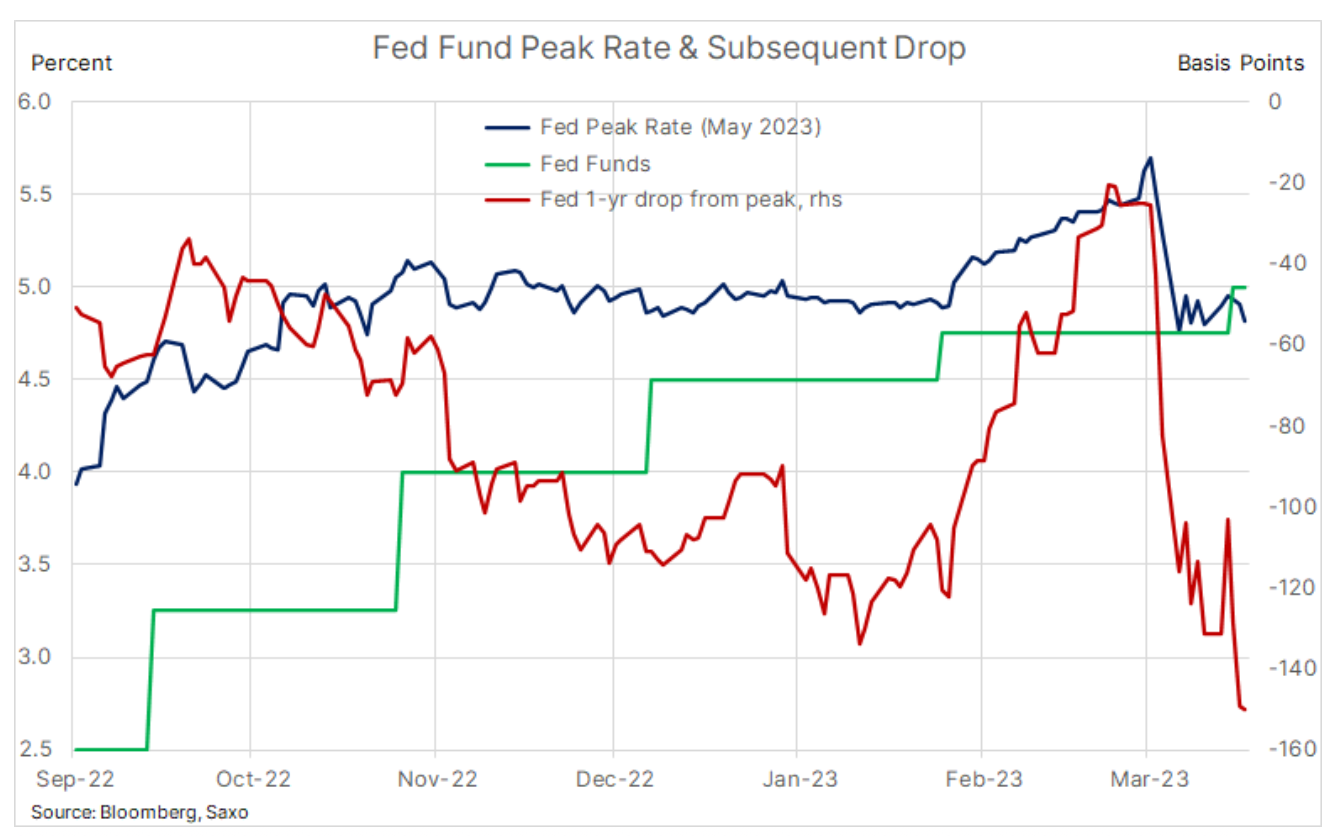
It is not yet known whether it is American Federal Reserve will be forced to focus on financial stability, thus giving up the fight against inflation. However, following the Fed's latest interest rate hike to 5% last week, the market now expects interest rates to be cut by 150 basis points by May next year. The most inverted front part of the US yield curve since 2001 is a signal for the fastest possible rate cut and evidence of the difficulties currently faced not only by banks in connection with tightening liquidity, but also consumers in the face of higher costs of credit, as well as the real estate sector, which is encountering more and more problems and which may lead to another crisis.
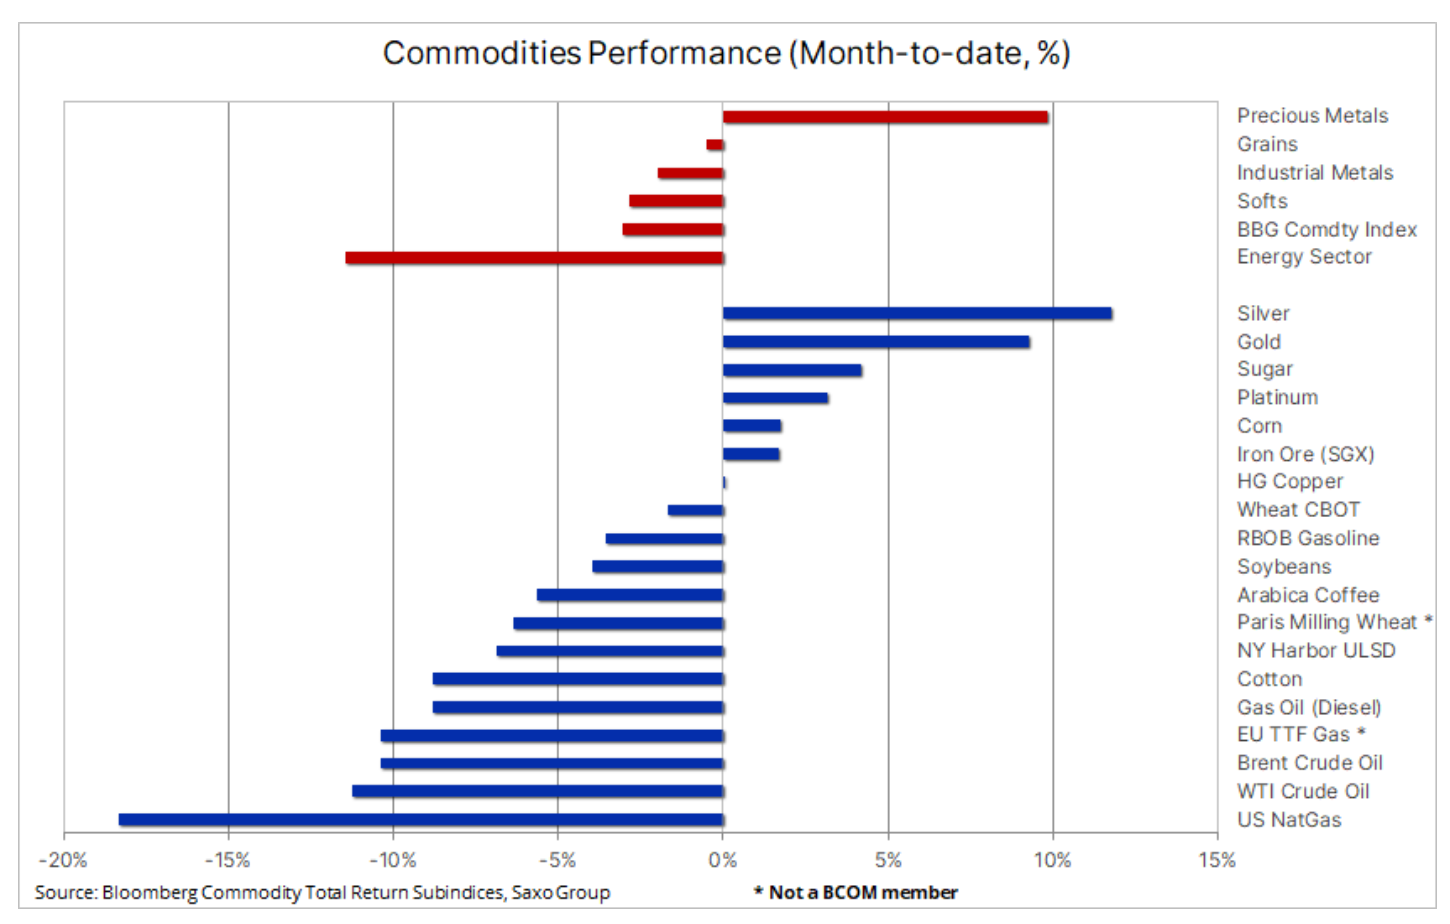
So far, the commodity market's reaction to events this month has been mixed, with precious metals gaining thanks to falling yields and demand for safe investments. At the same time, the energy sector, which experienced a significant drop in natural gas prices, is in decline due to concerns over economic growth and demand. In addition, the strength of these movements, both up and down, was to some extent dependent on the size of positions taken by speculative investors. The sharp correction in gold and silver prices in February caused a significant reduction in bull positions, while the sudden improvement in technical and fundamental forecasts contributed to new buys. The opposite was true in the crude oil market, which, after weeks of buying Brent oil, was bound to take a sharp turn, potentially lowering prices more than the fundamentals warranted.
A strong decline in yields strengthens the demand for gold and silver
The precious metals sector saw gains of more than 9% this month, with gold and silver recovering from the February correction. It is rare that there is support from so many different angles at the same time, and in this context, the latest rally makes sense, while increasing the likelihood of even higher prices in the coming months.
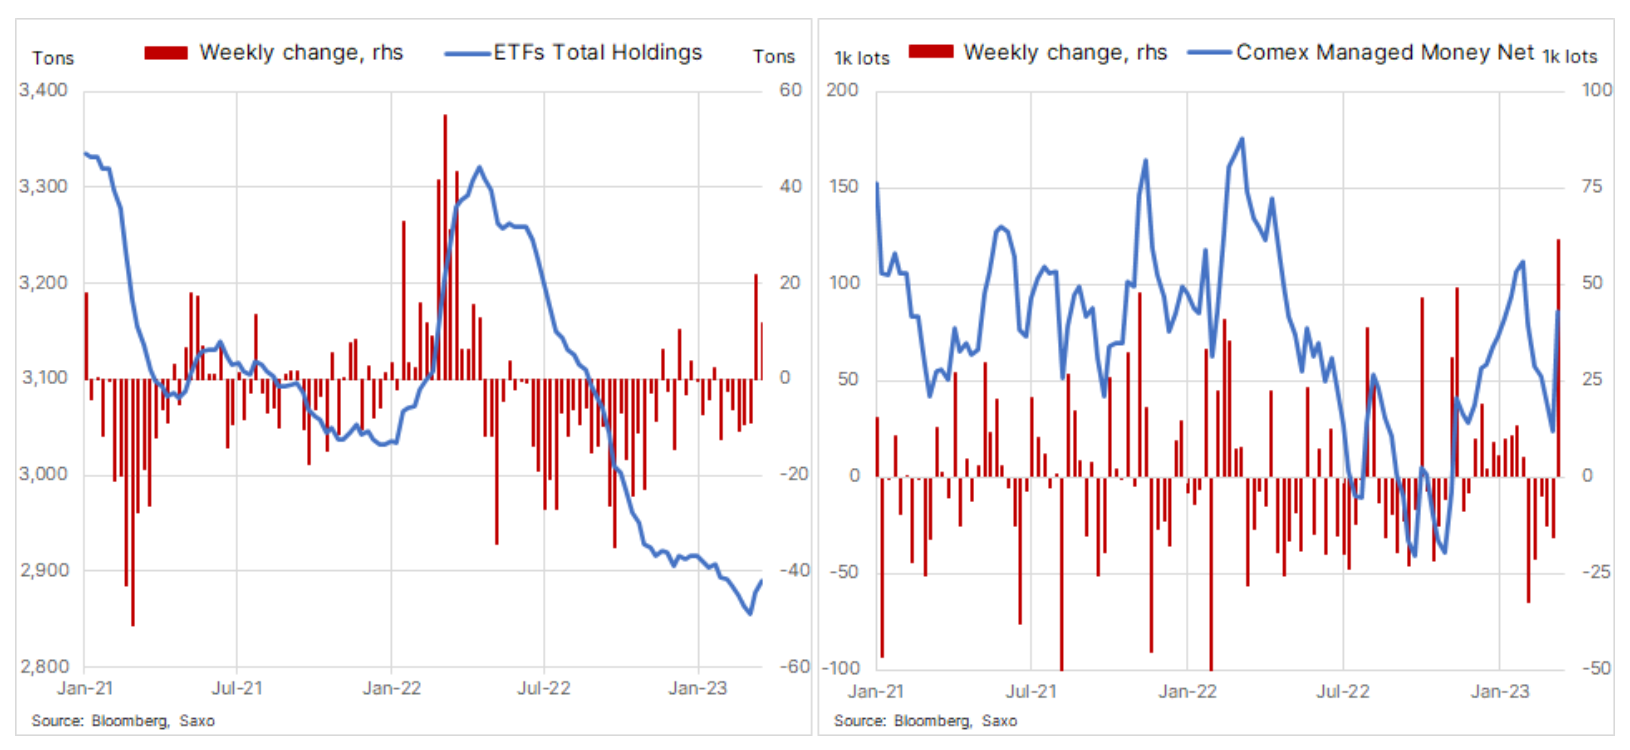
Gold i silver, sensitive to changes in the dollar exchange rate and yields, were supported by the dollar's depreciation by 3,5%, a fall in the yield on 110-year US Treasuries by as much as 100 basis points and a change in the forecast for Fed funds assuming an additional increase by 25 basis points, of which 150 last week, for an expected XNUMX basis point rate cut by May next year. These developments are in fact historic in nature and forced a strong buying response from hedge funds, which remained net sellers in the gold market throughout the February correction. Listed funds sector (ETF), which sold 465 tons of gold in the last eleven months, has finally seen buyers return - but just 33 tons purchased in the last few weeks highlight the current level of underinvestment in the metal market.
For the first time in a year, gold quickly returned to the USD 2 level, reaching an all-time high against the AUD and a near-all-time high against the EUR. Looking ahead, the outlook for gold and silver remains favourable, supported by declining yields and demand for safe investments fueled by concerns over the banking and real estate industries. A lasting break to last year's all-time high of $000 and above can only come when the market believes interest rates have peaked. Therefore, the focus should be on the activities and announcements of the Federal Reserve, as well as on the incoming economic data, in particular related to inflation.
Copper is trying to break out supported by lower stocks and demand in China
Trafigura, the world's largest private metals trading company, predicts copper will hit a record price this year as China's recovery continues to deplete already tight inventories. This view is shared by other major mining companies and traders in the physical market, not only due to the limited supply and recovery in China, but also due to the expected increase in demand for electrification as part of the green energy transition in the coming years.
The March scoreboard shows copper trading almost flat while oil, another key commodity dependent on economic growth and demand, fell more than 10%. In our view, this underlines that growing demand from electric vehicle manufacturing, renewable energy generation and energy storage and transmission is already offsetting the slowdown in the Chinese real estate market – which has been a significant source of demand in recent years – and the economic slowdown in the West.
Over the past four weeks, visible copper inventories, the inventories monitored by futures exchanges in Shanghai, London and New York, have fallen by a quarter to 247. tonnes, which means a decrease of 34% year on year. If the current trend of increasing demand in China continues, according to Goldman Sachs, the world's apparent copper inventories may be exhausted by August.
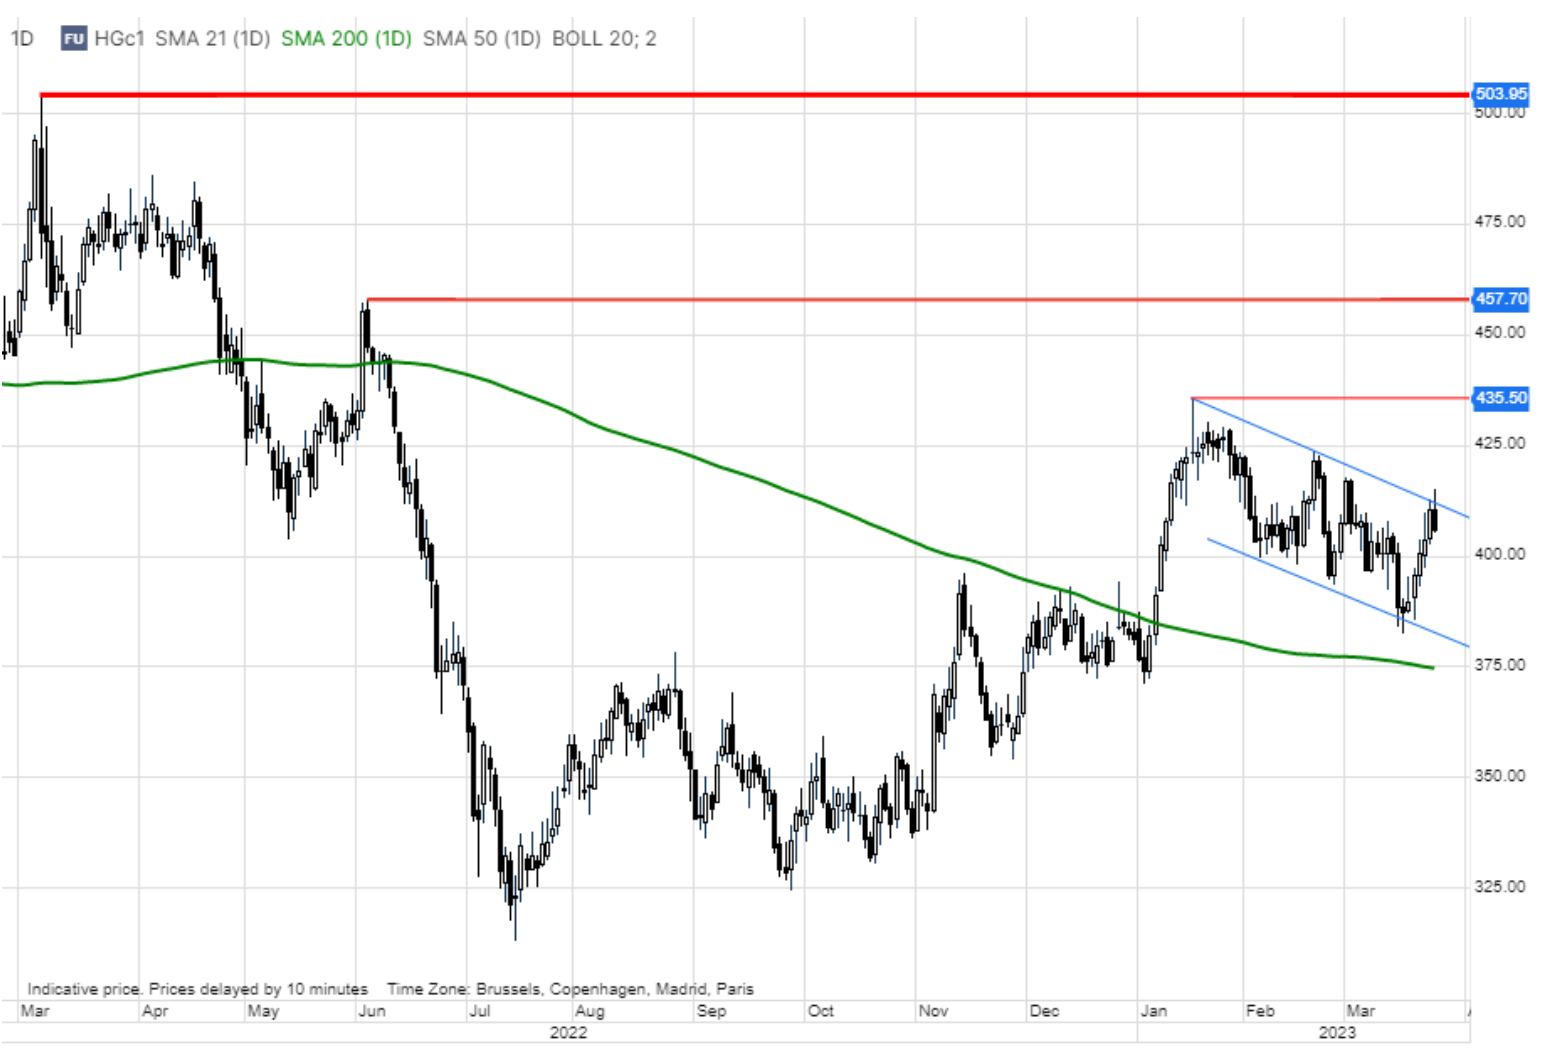
HG copper has been on a downward trend since mid-January, initially as a result of disappointment with the pace of economic recovery in China and concerns about economic growth in other countries. Over the past week, the continuous drop in inventories in storage contributed to a strong strengthening, with the resistance around USD 4,15 so far preventing another breakout attempt. In the short term, the banking crisis and general lack of risk appetite is likely to keep prices within the range before eventually breaking out towards last year's all-time high, which may not happen until the second half of the year.
Oil struggles with a further decline in risk appetite
The banking crisis that rocked financial markets this month had a particular impact on the energy sector, with WTI and Brent crude prices down more than 10%, while natural gas prices fell by almost 20%. Oil's dramatic response to the liquidity crisis was largely due to the events that occurred in the weeks leading up to the collapse of the Silicon Valley Bank. During this period, prices staying within the range for several months contributed to a decrease in volatility, thus supporting the appetite for risk, and due to the deportation of futures curves - beneficial for holders of long positions, in particular in Brent oil - speculative investors expanded long positions, at the same time reducing short.
When the crisis broke, oil broke support, paving the way for selling, not only as longs were liquidated, but also as more attempts were made to short. In the week ending March 14, speculative investors sold a total of 117. oil futures contracts, which is equivalent to 117 million barrels and makes it one of the three largest weekly cuts since 2017. The prospect of rising oil prices has not disappeared yet, but according to the IEA in its latest report on the oil market, the market The opposite is now at play, with supply still outpacing weak demand, pushing inventories to an 18-month high.
We note that the price-favorable deportation to oil market Brent held steady during the March sell-off, while refining margins rose, underlining that if current market conditions continue, they will continue to provide essential support. Overall, however, there is little doubt that the coming months are likely to be challenging, with pressures on financial market stability offsetting the strength of demand from China and a potentially weaker dollar supporting growth prospects in emerging economies.
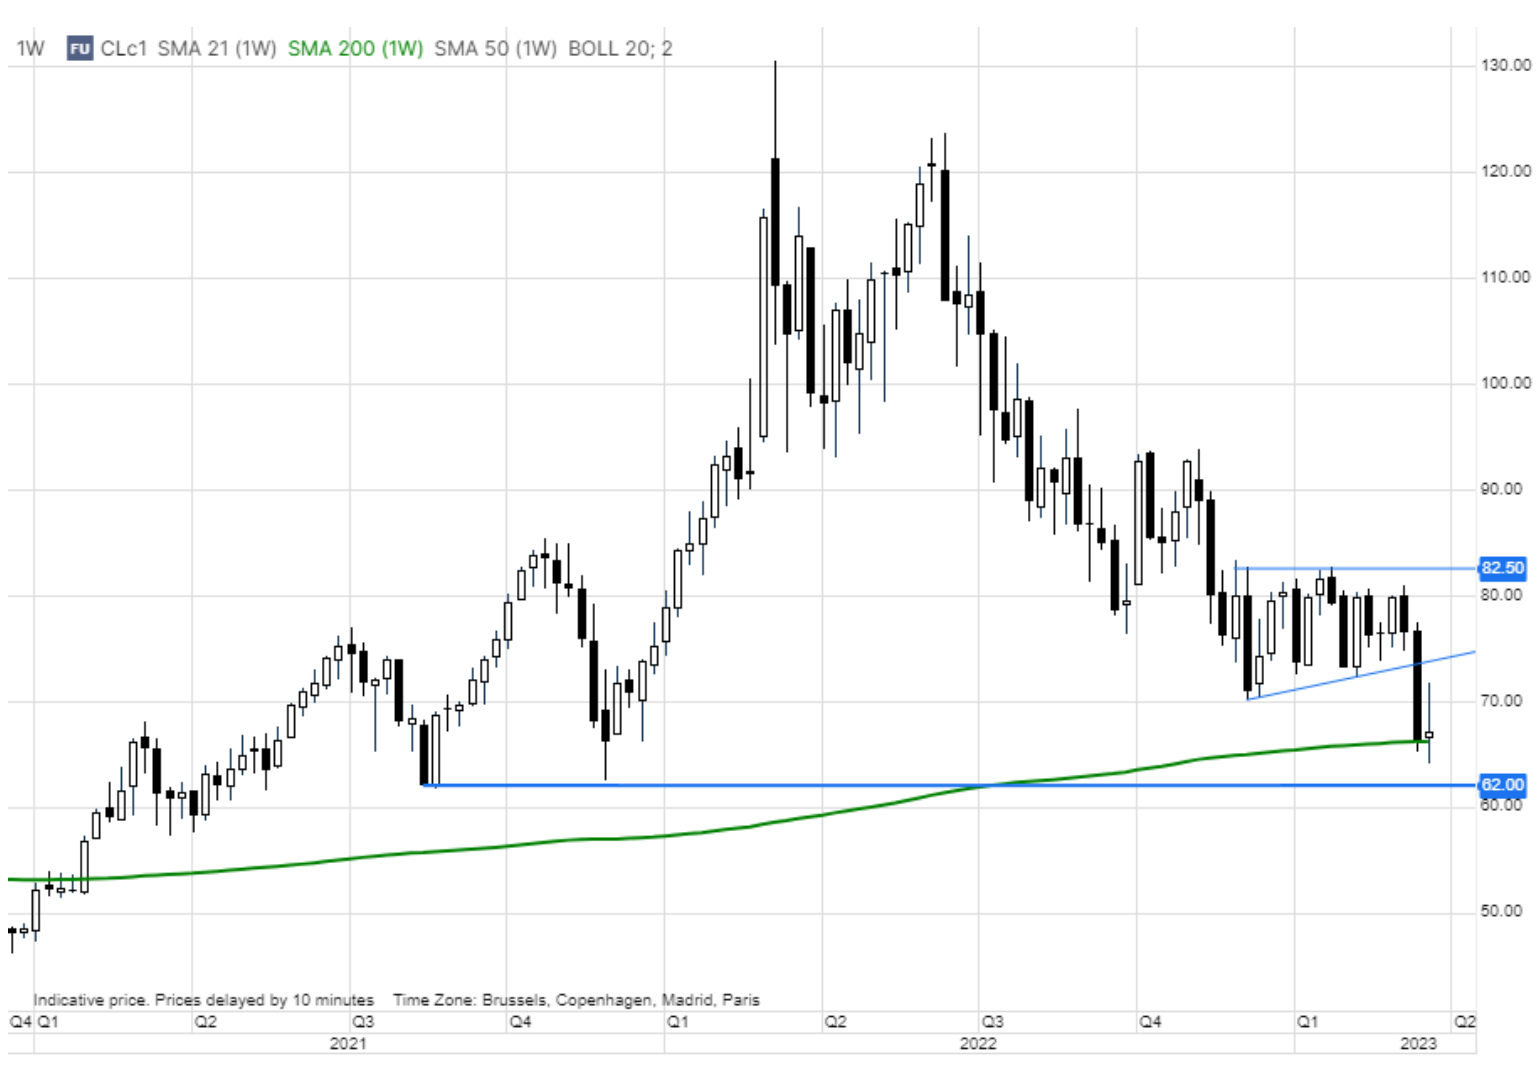
The weekly WTI oil chart shows the market continues to challenge the 66,25-week moving average, currently at $62, with a close below that potentially signaling additional weakness towards the technically important $70 area. The US government is looking for ways to replenish its strategic reserves - a task that, according to opinions expressed earlier this week, could not be accomplished this year. However, a deeper correction below $XNUMX - the level considered to be the maximum the government is willing to pay - could trigger some support in the form of a buy deal, not only for strategic reserves, but also as OPEC+ is increasingly uncomfortable with the with low prices which the group does not consider reasonable given the current supply and demand forecasts.
Natural gas prices remain under pressure after inventories peak
The price of one of the most important energy sources in the world continues to fall, especially in the United States, where natural gas price from Henry Hub fell to a 30-month low at around $2/MMBtu, and is 80% below the $10 peak recorded last August. A mild winter and strong production of more than 100 billion cubic feet for most days this year has pushed inventories to 1,900 trillion cubic feet, about 22,7% above the long-term average.
In Europe, the price of the benchmark Dutch TTF gas contract ended up in the range of EUR 40-50/MWh (USD 12,6-15,8/MMBtu), as the Old Continent managed to survive the winter without shortages despite a dramatic reduction in supplies from Russia. In fact, just a few days before the start of the gas injection season, storage facilities are about 55% full, well above the 25% level recorded last year and 29% in 2021. The price of a gas contract with delivery in the winter period from October 2023 to March 2024 is still around EUR 50/MWh, which is higher than in recent years, while there is still a need for LNG and initiatives related to reducing gas consumption. In the short term, the economic slowdown could add another layer of downward pressure on prices, with lower prices in recent months not necessarily being offset by higher demand from energy-intensive industries.
Dramatic change in hedge fund attitude towards the grain sector
As the CFTC finally updated its weekly hedge fund positions after the cyberattack in late January, we can finally gauge their response to low prices during this period - specifically in the four weeks ending March 14, when the BCOM Grain Index went down down by as much as 7%. The total net position in U.S. grain and oilseed futures and options through March 14 fell to 98. flights, the lowest since August 2020, down 82% over the last four weeks. The largest number of sales transactions concerned corn - a record 289 thousand. lots, which for the first time since August 2020 made the net position short and amounted to 54 thousand. flights. In those four weeks, the price of corn fell 8% and is now a strong candidate for a recovery should the technical and/or fundamental forecast change to a more favorable one.
Wheat is also not popular - hedge funds hold the largest net short position in wheat since 2018 CBOT. Despite an extended period of drought hampering the cultivation of winter wheat in some key areas of the US, the price of this grain has been generally under pressure due to the lack of competitiveness compared to large quantities of cheaper Russian wheat and in the context of the recent extension of the grain corridor agreement in Ukraine, also increasing the supply to the market. Despite a decline of more than 50% from the record high recorded in the same period last year, the current price of around $6,8 per bushel is still well above the pre-invasion average of around $5,4 per bushel.
However, on Friday, the price managed to move up more than 5%, its biggest gain in a month, amid signals that Russia is considering asking growers to slow down sales and that the aforementioned drought in the US is drawing increasing attention from investors. This increase potentially threatens this significant short position and forces funds to cover short positions.

About the Author
 Ole Hansen, head of department of commodity market strategy, Saxo Bank. Djoined a group Saxo Bank in 2008. Focuses on providing strategies and analyzes of global commodity markets identified by foundations, market sentiment and technical development. Hansen is the author of the weekly update of the situation on the goods market and also provides customers with opinions on trading goods under the #SaxoStrats brand. He regularly cooperates with both television and printed media, including CNBC, Bloomberg, Reuters, Wall Street Journal, Financial Times and Telegraph.


Leave a Response