


Will this year belong to treasury bonds?

The fourth week of 2023 is behind us and the shares are slowly moving upwards. Sentiment remains positive and is a continuation of the mood from the strong beginning of the year, despite the occasional weak macro data or weaker results of the largest companies.
However, next week will be the real test for the bullswhen we get to know the decision of the FED, and also BoE and the ECB on interest rates. While the size of the hike in the US seems to be a foregone conclusion of 25 basis points (according to the market, there is only a 0,8% chance of a hawkish surprise and a hike of 50 points) - the most important will be the Fed's message and J. Powell's press conference.
From the important macro data this week, you can certainly point to data on US labor market and wages, and then the US inflation for January (published only on February 14 this year, but it will be the "most important data of the month" if Powell does not show super hawks on February 1).
Stocks continue to rise
Last week Polish indices increased by about 1% (except medium-sized companies) correcting the declines from the previous week. However, since the beginning of the year, the sWIG80 increased the most, by as much as 10,2%. Since the lows of October 2022, the WIG20 has increased by 40,7%. Details are presented in the table below (the results are sorted by the last column, i.e. the rates of return in the past 4 weeks of this year).

T.1 Polish indices 2016-2022 and January 27.01.2023, XNUMX. Source: own study
The chart below shows the WIG index from the peaks of the previous bull market on November 5.11.2021, XNUMX.

W. 1 WIG index until December 27.01.2023, XNUMX. Source: own study, stooq.pl
If we compare the main Emerging Market markets and Europe (which benefits from the opening of the Chinese economy, especially Germany), Korea grew the most in the past week (+4,6%), joining the growth of technology companies on American stock exchanges (over 40% of the index are from the Samsung group). China has grown the most since the beginning of the year (+17,8%), Korea (+16,3%) and Germany (+12,9%). Details are presented in the table below (results are sorted by returns in 2023, returns in USD).
India is weaker in the current growth wave (-3,7% in the past week and a loss since the beginning of 2023 of -1,7%). Since last year's October lows, the highest rate of return in USD could be obtained by buying iShares MSCI Poland ETF (as much as +57,6% from October 12.10.2022, XNUMX).
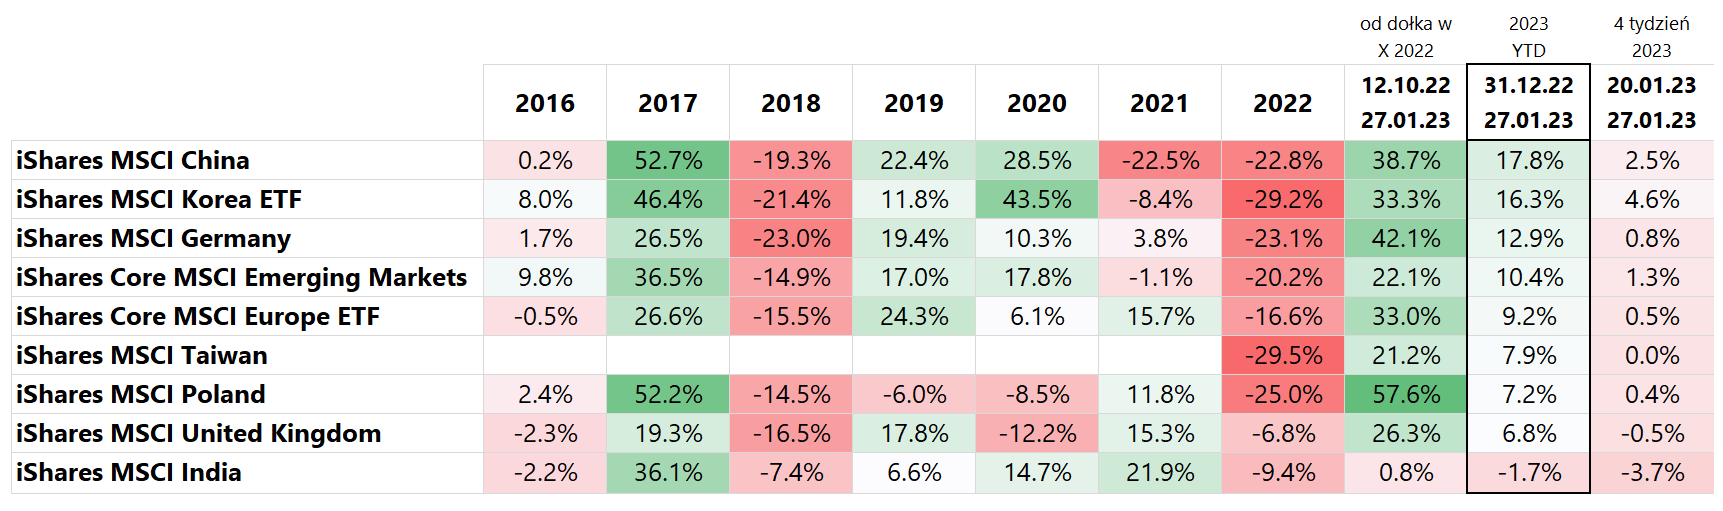
T.2 MSCI indices 2016-2022 and January 27.01.2023, XNUMX. Source: own study
The chart below compares the rates of return on the MSCI Poland and MSCI China indices from the beginning of 2022.

W. 2 MSCI China and Poland indices until January 27.01.2023, XNUMX. Source: own study, isahres.com
In the US market last week, the iShares Core S&P500 ETF increased +2,47% and is now 6,1% positive in 2023 (details of the rates of return on the respective ETFs are presented in the table below). The Nasdaq100 fared much better last week, growing +4,71%, and +11,2% since the beginning of the year.
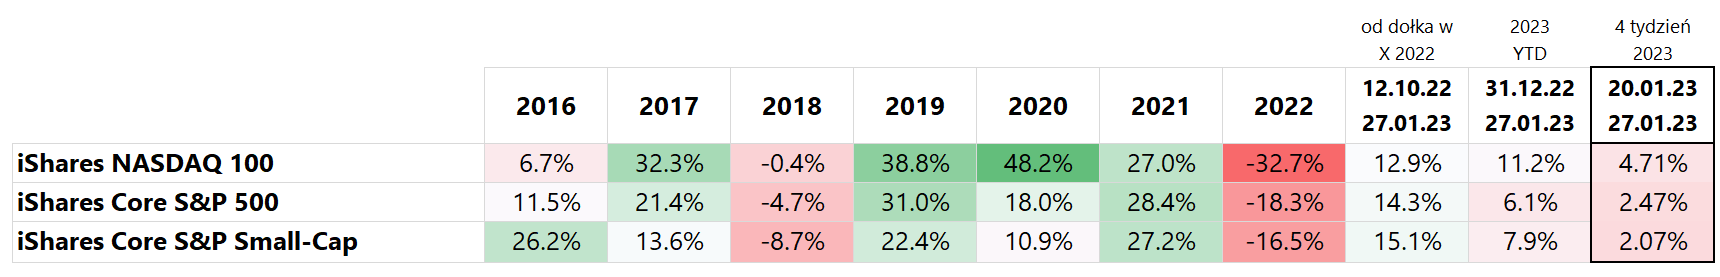
T.3 NASDAQ and S&P indices 2016-2022 and January 27.01.2023, XNUMX. Source: own study
The next chart shows S & P500 from the peaks of the previous bull market. According to the last closing, the S&P500 is already 13,8% above its bearish low of October 12.10.2022, 15,1. At the same time, it is only 3.01.2022% below the bullish peak of January XNUMX, XNUMX.
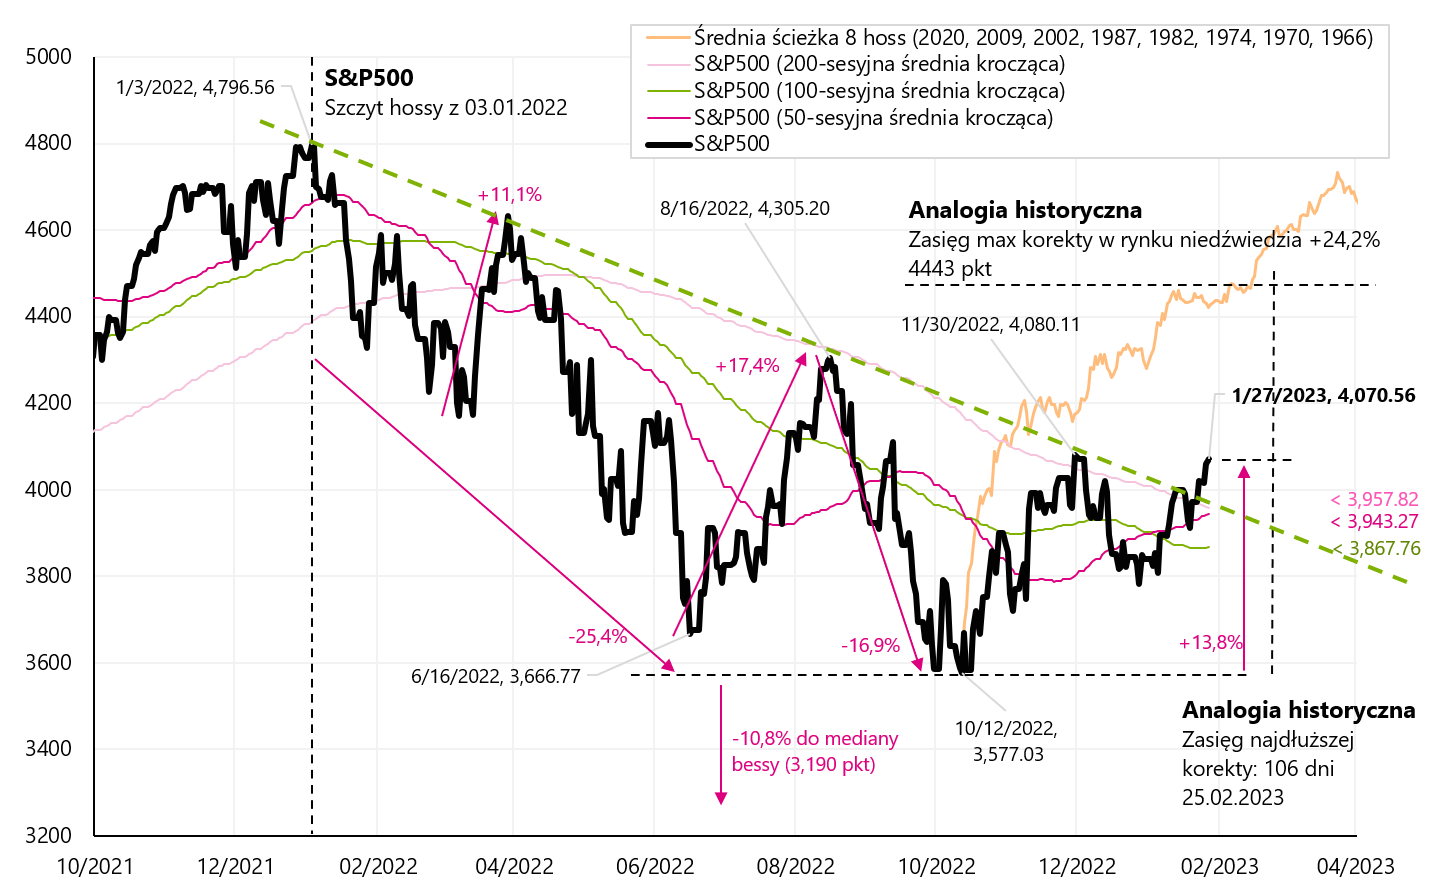
W. 3 S & P500 index until December 27.01.2023, XNUMX. Source: own study, stooq.pl
If we look at the major stock sectors. it was the Consumer Discretionary sector that increased the most in the past week +6,39%, which is already +14,5% since the beginning of the year. Other cyclical sectors, such as Information Technology and Communication, also performed very well. Details are presented in the table below.
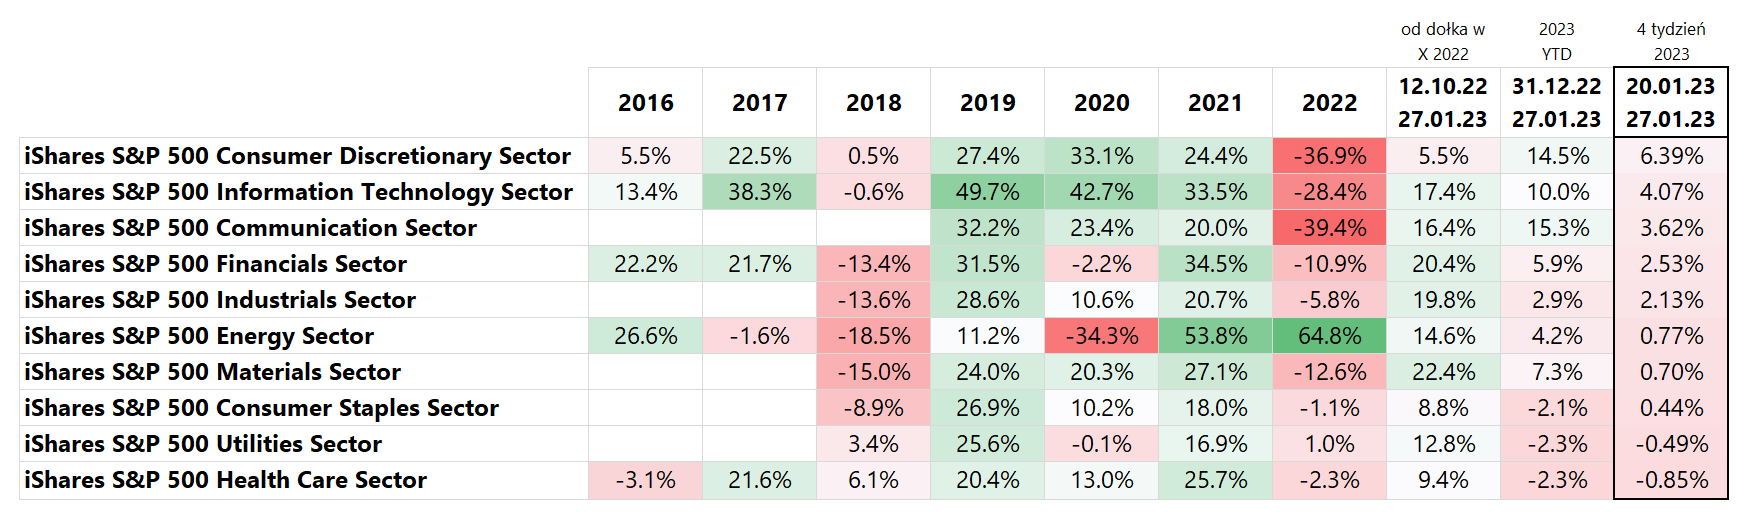
T.4 S&P 500 index 2016-2022 and January 27.01.2023, XNUMX. Source: own study
The second largest company in the Consumer Discretionary sector is Tesla, which increased by over 33% in the past week. Thus, this company is responsible for about half of the growth of this index. Tesla reported good results for Q4 2022, beating analysts' expectations both in terms of revenue (USD 24,32 trillion - which means 37% YoY - vs. expectations of USD 24,1 trillion) and net profit (EPS USD 1,19 vs expected USD 1,12). There are two things to keep in mind with Tesla. Firstly Tesla's share price has fallen sharply in recent months (from the high in November 2021 to the low on January 3 this year, the price fell by 73,6%), so Tesla has the right to strongly rebound in favorable circumstances regarding the general market sentiment (currently quite positive), or information directly from the company (better results).
As a result of such circumstances, the share price rebounded from the low of January 3 this year. by over 65%. But on the other hand it should be remembered that the durable goods sector (which includes the automotive sector) and the residential real estate sector are the two most cyclical sectors in US GDP, which are also the sectors most sensitive to interest rates (both apartments and cars Americans buy mainly on credit). And in the current conditions of high interest rates, these are not industries that will be the driving force of the economy at this point.
Will 2023 belong to treasury bonds?
The best time in the cycle for government bonds is when yields fall from the "high" in the expansion cycle to the "low" in the next recession. This decline in yields is linked to a cycle of interest rate cuts by central banks. If we look at the US treasury bond market, the yield peak in the previous cycle took place on November 8, 2018 (the peak in the yield of 10-year bonds), i.e. about a month before the last interest rate increase by the FED in that cycle, which took place on December 19, 2018. We set the bottom of profitability during the recession in March 2020.
The rate of return for long-term treasury bonds for this period (yield peak - trough) amounted to 59,9% (iShares 20+ Year Treasury Bond ETF). This is a high rate of return, because it means as much as 42,2% per annum. Of course, the interest rate risk is also high, because the duration of this ETF is as much as 17,7 years (such duration means that a decrease in the interest rate by 1 percentage point means an increase in the value of the ETF by about 17,7%). The chart below shows the performance of the iShares 20+ Year Treasury Bond ETF.
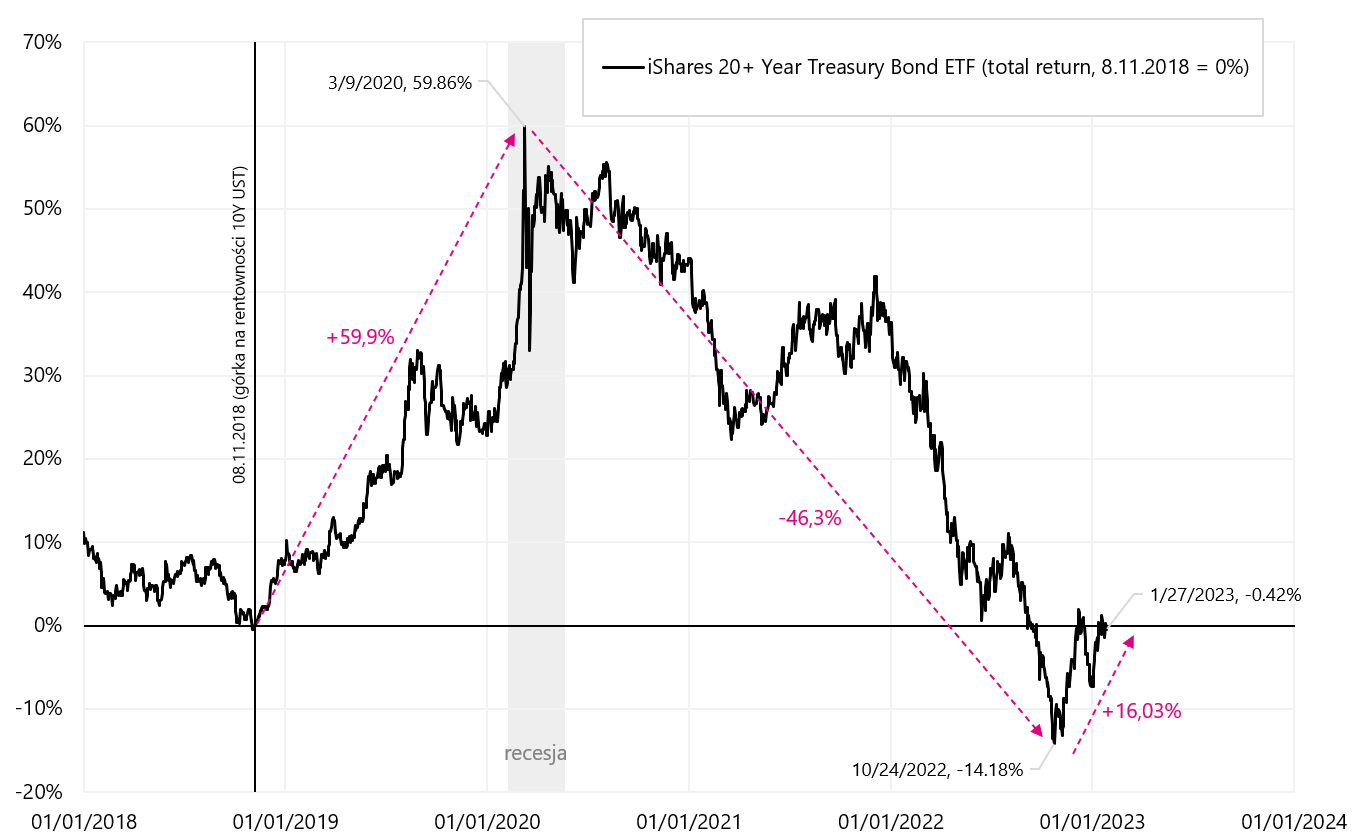
W. 4 iShares 20+ Year Treasury Bond ETF (total return) until January 27.01.2023, XNUMX. Source: own study, ishares.com
Of course, in March 2020, another expansion cycle began (driven by stimulus during the pandemic) and as a result, we generated the highest inflation since the 80s. If not for inflation, then in a "normal" cycle the Fed rate would not rise higher than about 2%. But we are now at 4,50% (the upper end of the FED interest rate range) and the 30 day federal funds futures are pricing in a 99,2% probability of a 25 basis point rate hike at the meeting on February 1, 2023, and another increase by 25 basis points with a probability of 82,1% on March 22, 2023 (valuations according to contract quotations of January 27.01).
According to the market, the March hike will be the last in this cycle. We had a "hill" on the 10-year bond yield on October 24, 2022 (4,25%). As a rule, yield peaks occur up to a few months before the last rate hike by the FED, which is presented in the next chart.
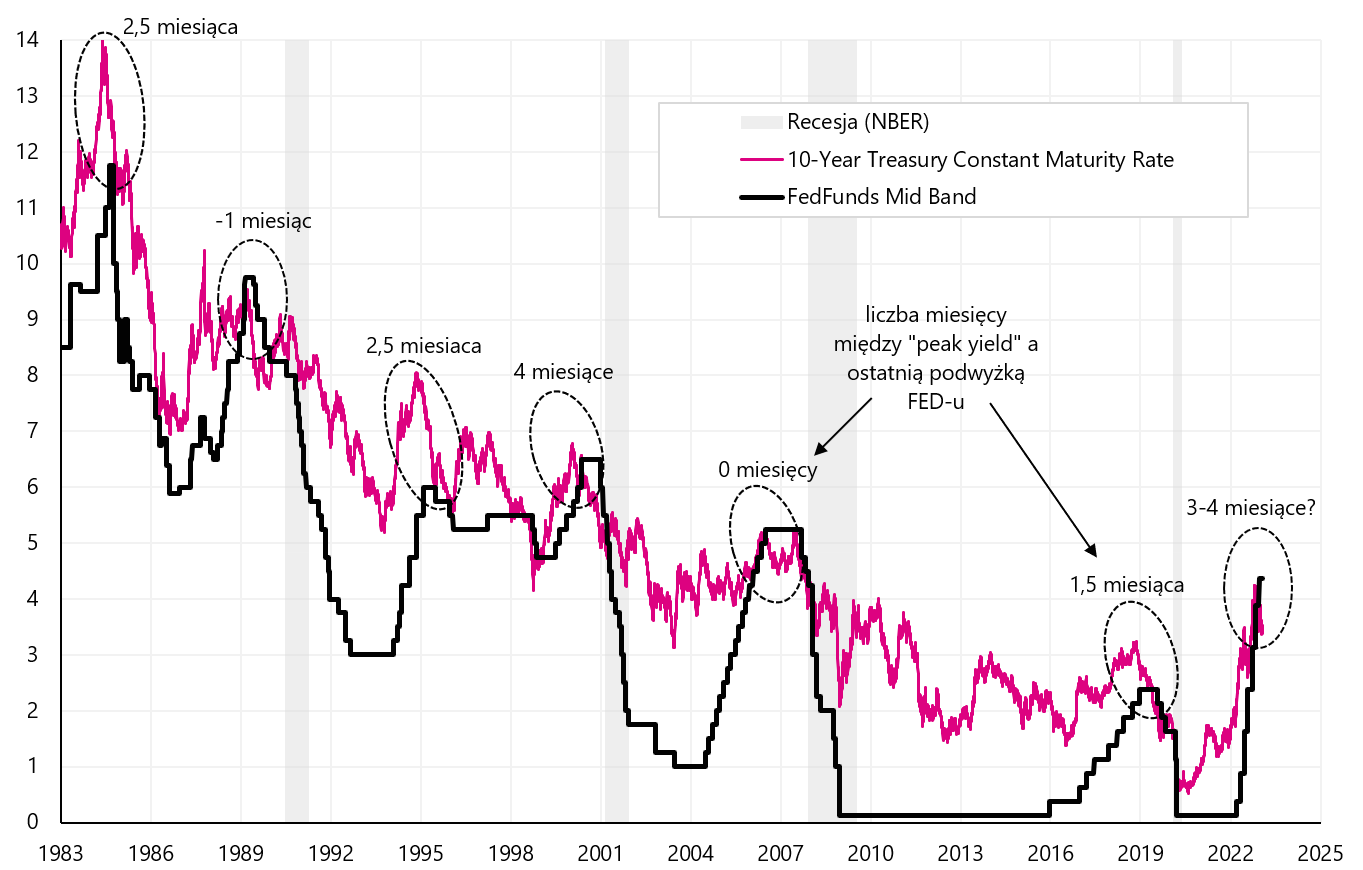
W. 5 FED reference rate (middle of the range) and yields on 10-year treasury bonds. Source: own study, FRED
It is highly probable that we are approaching the end of the FED rate hike cycle, so it is quite possible that the peaks in Treasury bond yields are also behind us, in other words we are in another cycle of declining profitability. Overcoming inflation or entering a recession (and thus overcoming inflation to some extent) will allow the FED to start another cycle of interest rate cuts. As a result, bond prices could continue to rise (as in the 2018-2020 cycle).
The Fed's rate cuts are necessary for the continued rise in Treasury bonds. So when could the Fed start cutting rates? According to the Fed itself, only in 2024. According to the market, already in the second half of 2023. According to "history", the last hike should be followed by a "pause" in the cycle of rate hikes by the FED, which lasted 8 months on average in previous cycles. Thus, according to history, the first cut could take place in October 2023. The chart below shows the historical cycles of rate hikes, pauses, and then cycles of interest rate cuts by the FED.
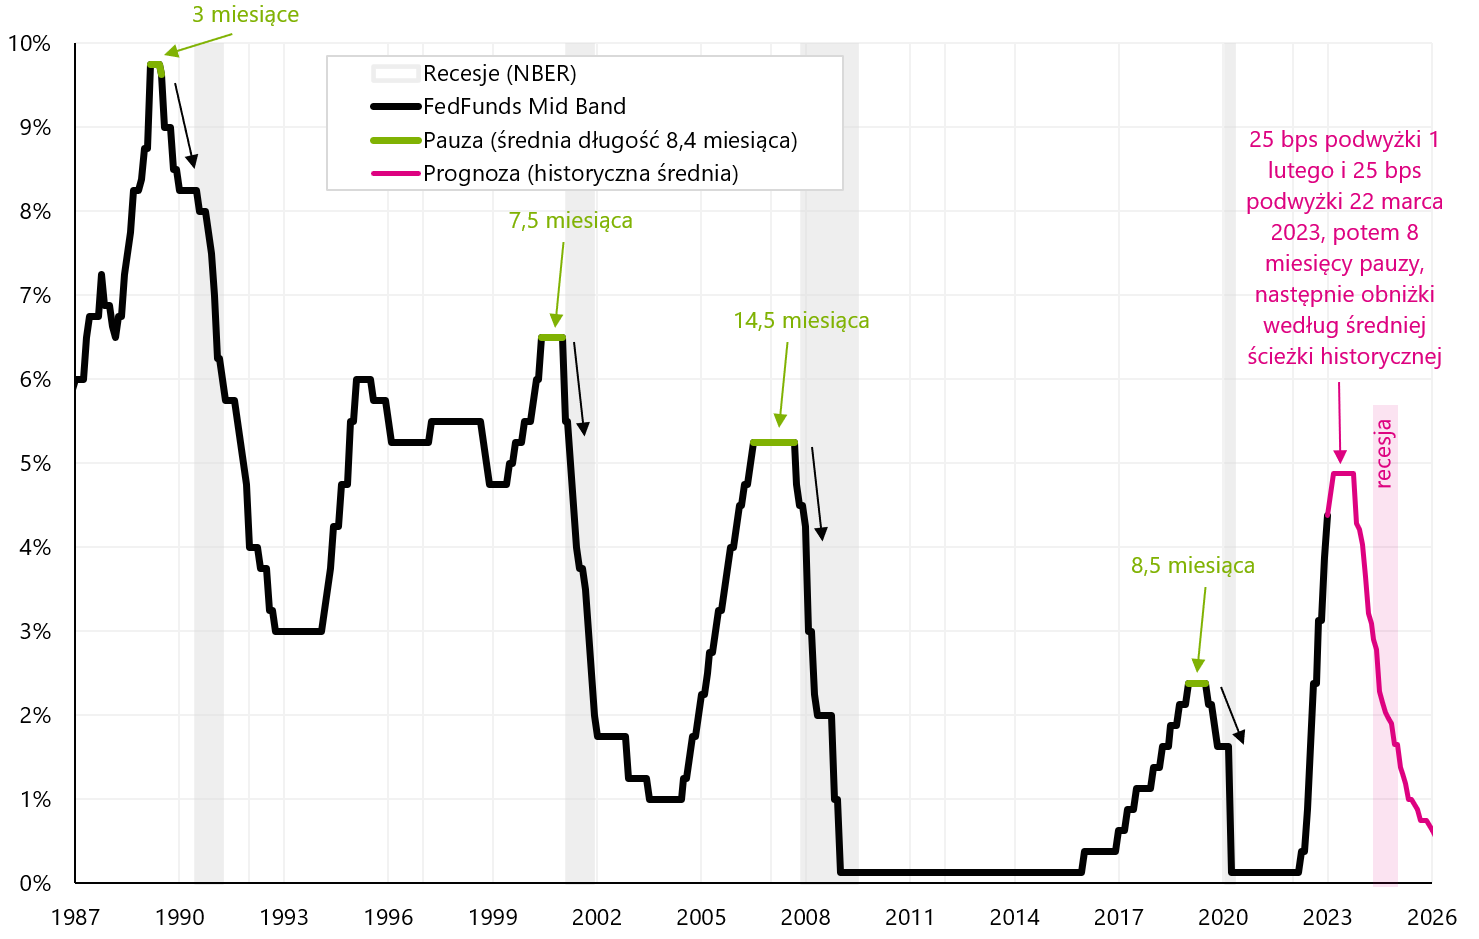
W. 6 FED reference rate (middle of the range) since 1987 and forecast to 2026 (according to the average historical path). Source: own study, FRED
Rates of return for iShares 20+ Year Treasury Bond ETF are expressed in USD, so for a Polish investor it is worth checking what rate of return he would receive in PLN. There is also a version of iShares $ Treasury Bond 20+yr UCITS ETF (EUR Hedged), i.e. with protection against changes in the EUR/USD exchange rate. A Polish investor (if he wants to settle his rate of return in PLN) in the case of purchase of iShares 20+ Year Treasury Bond ETF takes on the USD/PLN exchange rate risk, and in the case of purchase of iShares $ Treasury Bond 20+yr UCITS ETF (EUR Hedged) the EUR exchange rate risk /PLN. The chart below shows the return in PLN when investing in both ETFs above compared to the original USD ETF.
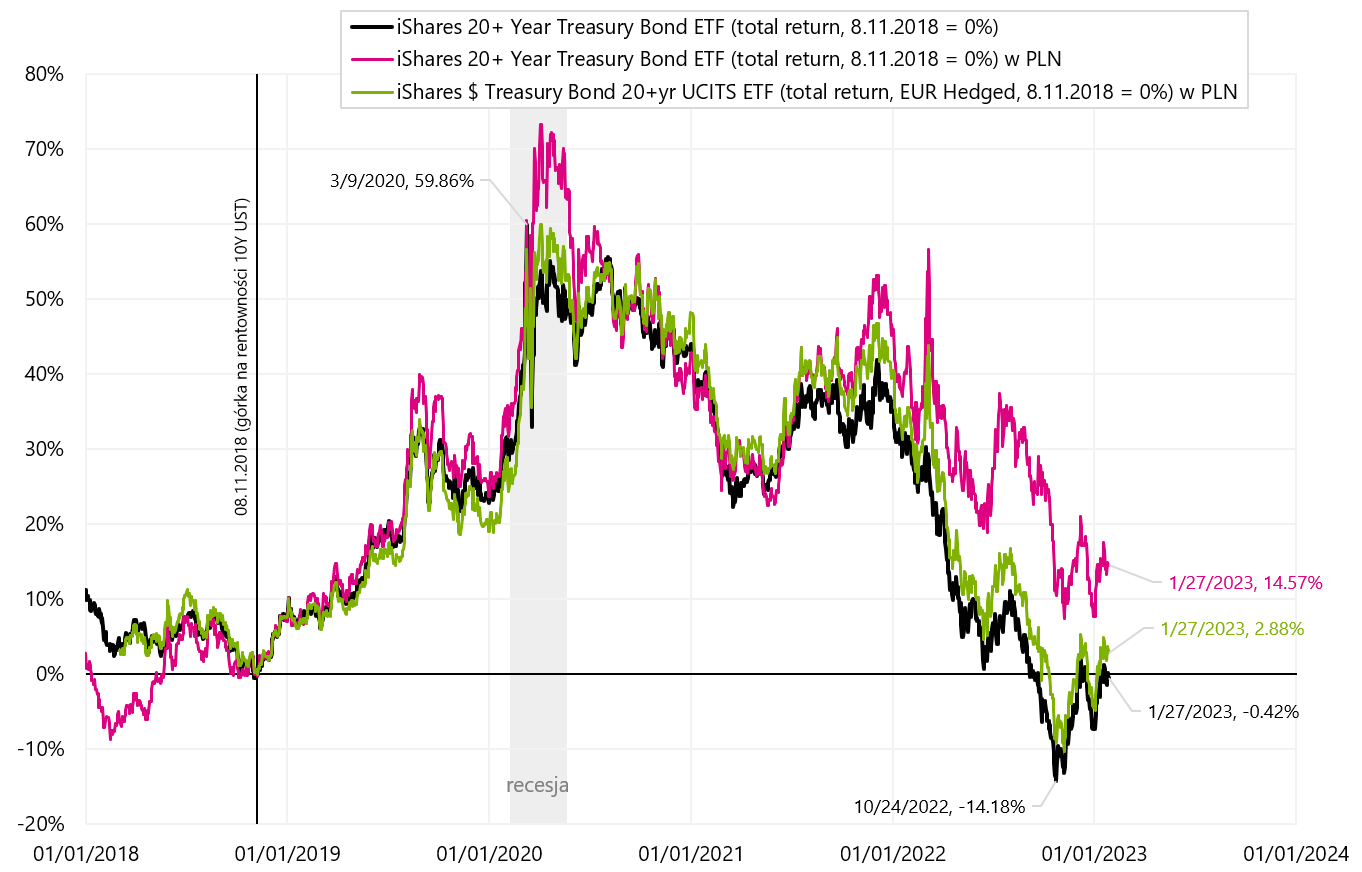
W. 7 iShares 20+ Year Treasury Bond ETF (total return) in USD and PLN and iShares $Treasury Bond 20+yr UCITS ETF (EUR Hedged) in PLN until January 27.01.2023, XNUMX. Source: own study, ishares.com
The biggest difference (a plus for the Polish investor) occurs on the iShares 20+ Year Treasury Bond ETF in USD, which is a consequence of the weakening of the Polish currency against the US dollar (the weaker the zloty, the higher the rate of return a Polish investor gets when investing in dollar assets). In the next chart, we present the rates of return in 2023 for both versions of the iShares 20+ Treasury Bond ETF (in USD and Euro), but also in PLN.

W. 8 iShares 20+ Year Treasury Bond ETF and iShares $Treasury Bond 20+yr UCITS ETF (EUR Hedged) – rates of return in 2023 (until January 27.01.2023, XNUMX). Source: own study, ishares.com
In the current year, the rates of return for iShares 20+ Treasury Bond ETF range from 6,32% to 7,63% (depending on the ETF version and the currency in which we want to calculate the rate of return).
Long-term bonds have a high volatility, comparable even to stock indices, due to the high portfolio duration (i.e. high interest rate risk). Therefore, let's compare the rates of return on treasury bond indices covering the entire spectrum treasury bonds (from 1 year to redemption), and not only bonds with maturity over 20 years.
The next chart shows a comparison of returns for such bond indices for the US (duration 6,2 years), Germany (duration 8,2 years) and Poland (duration approximately 4,5 years).
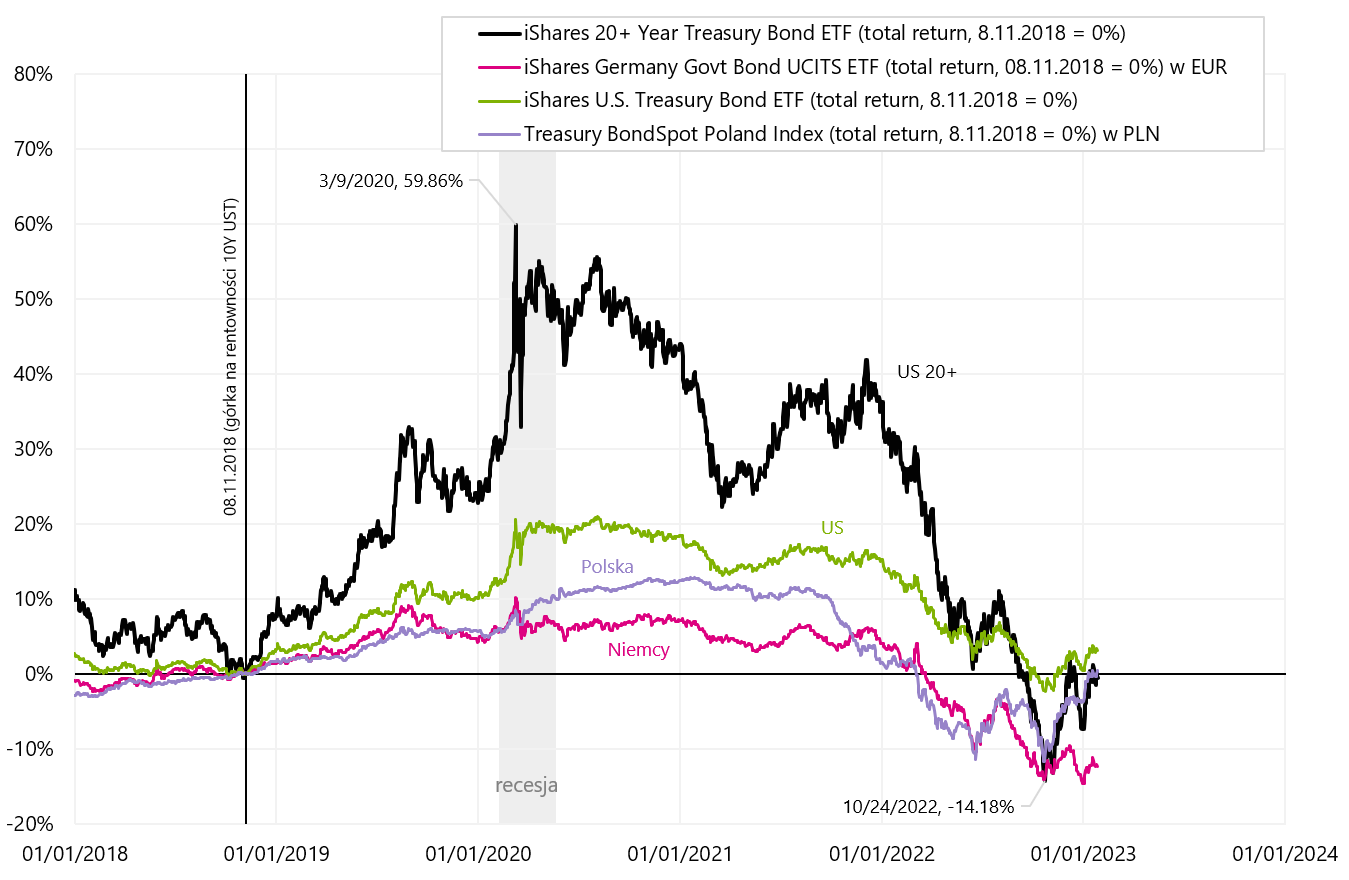
W. 9 iShares 20+ Year Treasury Bond ETF, iShares Germany Govt Bond UCITS ETF, iShares US Treasury Bond ETF and Treasury BondSpot Poland Index. Source: own study, ishares.com, stooq.pl
Investing in long-term government bonds at this stage of the cycle has another advantage compared to stock markets. In the case of entering a recession, stock markets may fall, while in this case, bond prices will continue to rise along with interest rate cuts by the FED (during a recession, the FED usually even accelerates rate cuts and practically brings them down to zero).
Summation
Stock markets continued their gains last week. Breaking the S&P500 index above the bearish line looks optimistic. However, let's not forget that the Fed keeps raising interest rates and the cyclical industries of the US economy keep slowing down. We will have a real test for the bulls in the coming weeks, when we will know the Fed's decision on rate hikes, and J. Powell's rhetoric - how hawkish it will be and whether the markets will consider it a "bluff" again (February 1), and then when we will know inflation for January (February 14).
Can 2023 belong to treasury bonds? There's a good chance for that, because the current moment of the cycle (the end of the cycle of interest rate increases by the FED) historically marked the beginning of the bull market on the treasury bond market. Of course, to the "full" bull market in this segment a further decline in inflation is also needed towards the 2% target, like and the beginning of the cycle of interest rate cuts by the Fed.
About the Author
 Jaroslaw Jamka - Experienced fund management expert, professionally associated with the capital market for over 25 years. He holds a PhD in economics, a license of an investment advisor and a securities broker. He personally managed equity, bond, mutli-asset and global macro cross-asset funds. For many years, he managed the largest Polish pension fund with assets over PLN 30 billion. As an investment director, he managed the work of many management teams. He gained experience as: Member of the Management Board of ING PTE, Vice-President and President of the Management Board of ING TUnŻ, Vice-President of the Management Board of Money Makers SA, Vice-President of the Management Board of Ipopema TFI, Vice-President of the Management Board of Quercus TFI, Member of the Management Board of Skarbiec TFI, as well as Member of Supervisory Boards of ING PTE and AXA PTE. For 12 years he has specialized in managing global macro cross-asset classes.
Disclaimer
This document is only informative material for use by the recipient. It should not be understood as an advisory material or as a basis for making investment decisions. Nor should it be understood as an investment recommendation. All opinions and forecasts presented in this study are only the expression of the author's opinion on the date of publication and are subject to change without notice. The author is not responsible for any investment decisions made on the basis of this study. Historical investment results do not guarantee that similar results will be achieved in the future.


