Global stock exchanges, volatility and ... Coronavirus vaccine

There are more and more surprises on global stock exchanges, and therefore more and more hot. After the markets used the US elections to generate gains, it has now entered the arena Covid-19 vaccine. The pandemic lurks in the background.
The last three weeks have been a very hot period on the global stock exchanges. The end of October was marked by declines. And when it seemed that the beginning of November would bring a continuation of the sell-off, investors unexpectedly treated the US presidential election as a pretext for increases. And this despite the fact that the counting of votes was prolonged, and President Donald Trump accused his opponents of rigging the elections.
There is a vaccine
Yesterday, however, the Covid-19 vaccine entered the scene. Or, in fact, her announcement. It was enough, however, to push the fear of a second wave of the pandemic and lockdowns even more into a corner and start buying stocks. Although the situation is not clear cut. Future pandemic containment is bad news for the tech and pharmaceutical companies that have grown strongly in the pandemic.
All these changes in sentiment strongly influenced the balance of forces on the charts. It looks especially good UK100, where there was an upward breakout from a several-month growth channel, which is a strong signal for demand.
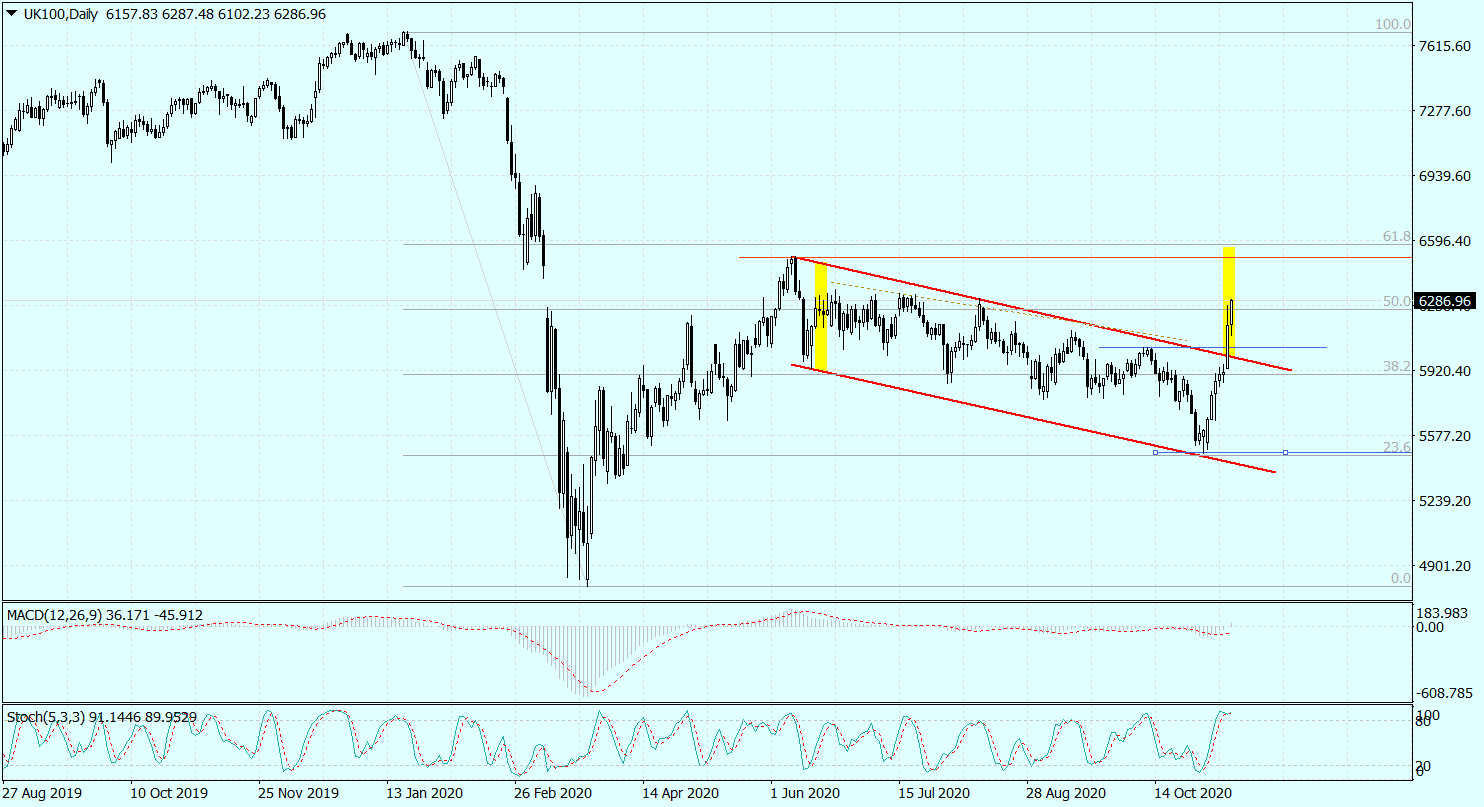
UK100 daily chart. Source: Tickmill
The demand side also deals cards in the DE30 chart, after the rate made a return from the 38,2% retracement of the Fibo at the turn of the month, while meeting the minimum plan for declines. However, unlike the above-described UK100 example, now the room for growth is small. It is limited by the September peak at 13461,80 points, the supply of which is significantly additionally strengthened by the proximity of the February peak.
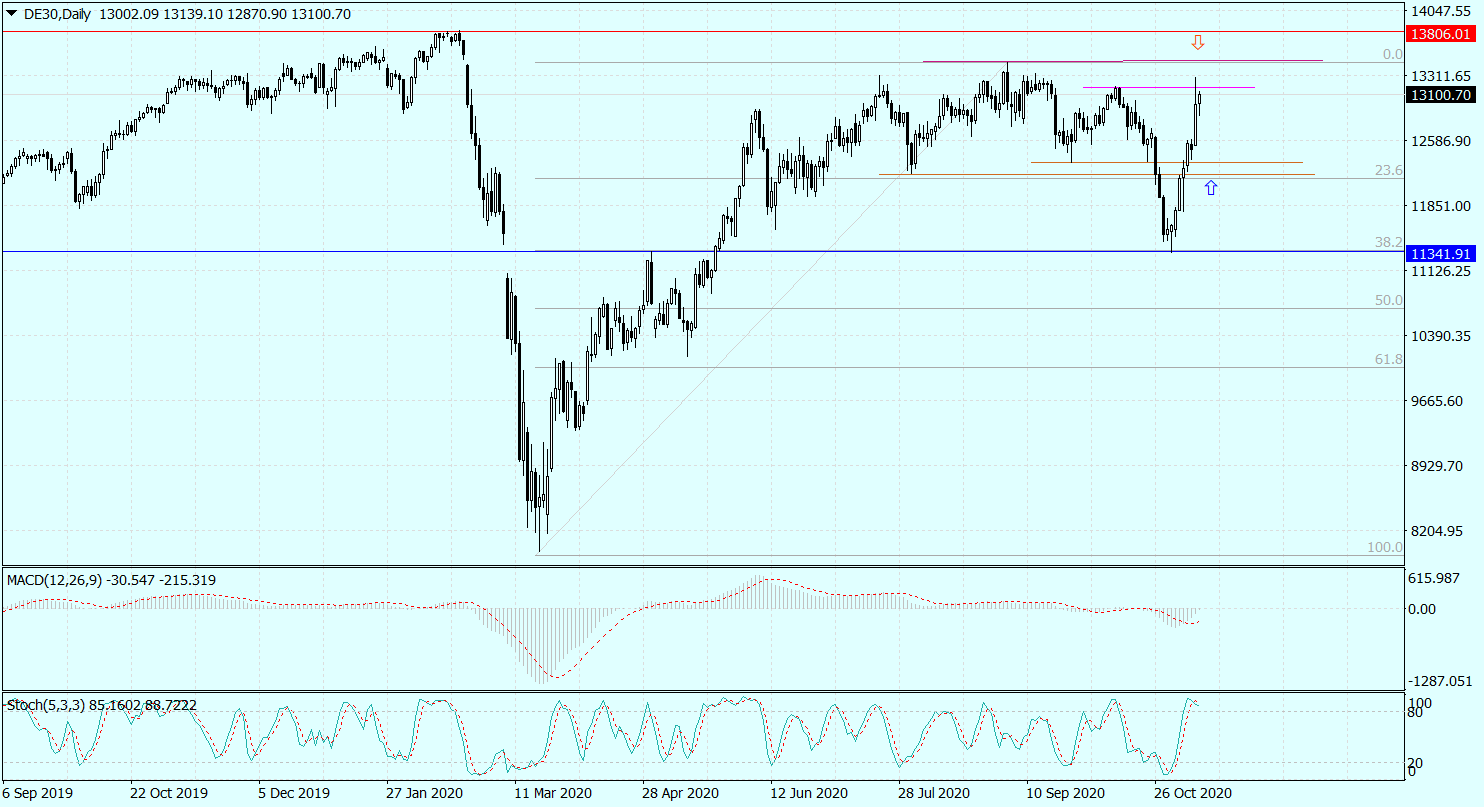
DE30 daily chart. Source: Tickmill
The situation on the US500 is the least clear-cut. Yesterday's drawing of a shooting star candlestick pattern, which was formed at the level of the peaks in September and October, heralds the end of the increases. The only thing missing is confirmation of this formation by the US500 decline today. If this happens, the road towards 3200 points. it will open again.

US500 daily chart. Source: Tickmill