


Triangle formation - playing and useful tips

Triangle formation is extremely popular especially among traders using methodology Price Action. However, there are a lot of misunderstandings about what it really shows and how to interpret it correctly. Triangles can tell a lot about market dynamics, momentum changes and the balance between buyers and sellers - as long as we obviously know what to look for. In this article we will present a summary of the tips that this formation can provide us with and how to use it in your daily investing.
Triangle formation and trading
There are many different types of triangles. In the article, we will focus on which, in my opinion, is most widely used in broadly understood investments - the asymmetrical triangle.
It can be divided into downturn and upward. The descending triangle is characterized by the fact that each reflection has a lower peak. At the same time, higher lows do not increase with the same force, from the top to the bottom the quotes move faster. Buyers are unable to sustain the bullish momentum, and every time they try to go higher, the price is pushed down to lower levels. In one sentence: decreases from lower peaks are faster than increases from higher holes.
This is a sign that sellers control the market and push the price down faster. The second variant is the asymmetrical growth triangle. A characteristic feature is that each time the price drops, buyers take control earlier and lift it back to the resistance zone. This should not be confused with the formation of a double gable, which can look very similar.
Triangle formation and loss of momentum
The main premise of this formation and really the key to its understanding and use on the market is to realize that the triangles cause precipitation / building of the opposite momentum.
The first inheritance example. Each time the price approaches the support level, there is a rebound, which is however getting weaker. A moment before breaking, we can additionally observe that the trend line has been tested several times but ineffectively, the price did not manage to break it. Combining all these points together could give an earlier signal that breaking down is more likely.
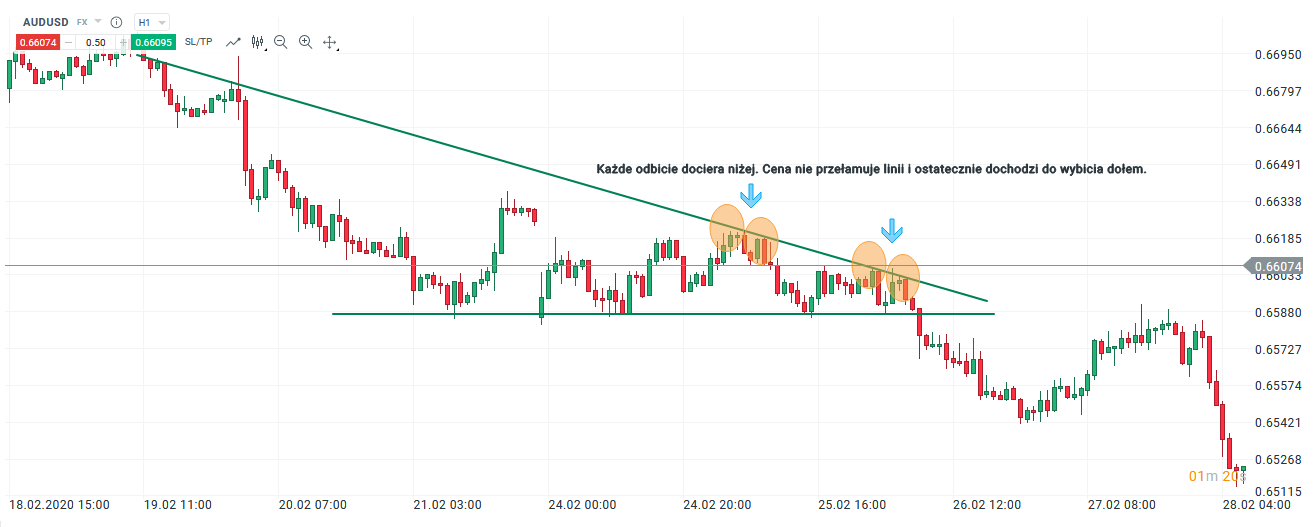
Inheritance scenario using triangle formation. Chart AUD / USD, H1 interval. Source: xNUMX XTB xStation
Another example shows how a momentum is built every time the price moves towards the resistance level. The formation that was under construction clearly supported the breakout from above. The price repeatedly moved to the resistance zone, but each subsequent bounce became weaker and shallower.
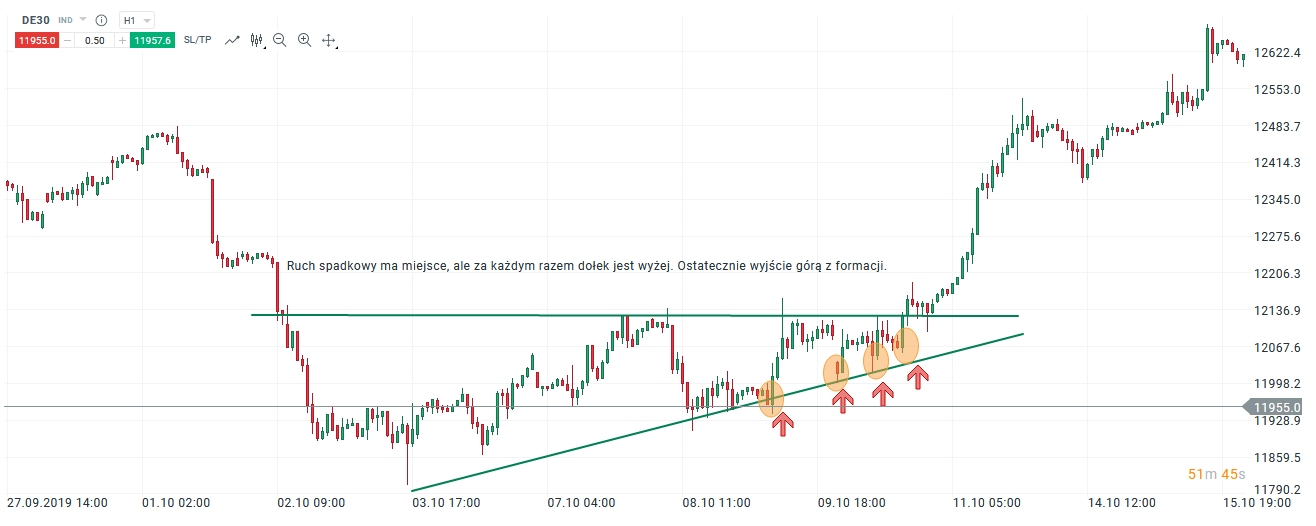
Growth scenario using triangle formation. Index chart DAX, H1 interval. Source: xNUMX XTB xStation
Errors in playing triangle formation
It must be said right away - triangles are an interesting trading concept, but they do not always work. In fact, the biggest and greatest mistake traders make is that they enter a position BEFORE it really breaks out of the triangle. It is worth remembering that the triangles are not a Holy Grail and they sometimes fail. Secondly, the additionally confirmed signal from the formation occurs when the trend line is broken - not earlier.
It is also very important that breaking the trend line is only correct after closing the price outside the triangle: that is, if the price remains below it or above it. In practice, it is very useful, for example, to wait until a full candle is formed outside of the triangle after breaking out of the formation. This may result in some opportunities being missed, but on the other hand, this approach will stop before coming into position with many unsuccessful breakouts.
Summation
When using formation in everyday trading, remember:
- triangles usually show destroying / building the opposite momentum for the other side of the market,
- double-top formations, or false breaks before a triangle forms, are good tips,
- indicators such as MACD or RSI, for example, can successfully help in measuring momentum in triangle formations,
- the key and additional confirmation is waiting for the price to break out and close outside the formation,
- it is always worth analyzing the slope and angle of the trend line additionally.


