


Wolfe Waves formation - tips and characteristics

The Wolfe Waves formation is one of the less popular formations on the forex market. It creates a series of successive waves of the graph that form a very clear pattern.
The name of the formation is part of one of the trading gurus - Billy Wolfe. He is the creator of one of the most interesting theories in investing. Wolfe believes that when the price action moves in the channel and when it comes to a false fifth wave breakout, usually may herald a reversal of the dominant trend. He explained that by using the waves, you can find a great entry point at the beginning of a potential reversal, while maintaining a very good profit-risk ratio. The formation can also be used to look for turning points when exiting certain transactions. In this article, we'll take a closer look at it and present the characteristics.
Be sure to read: 7 the most popular trading myths
Price channel as a condition for formation
If we spend a little more time analyzing the charts, we can observe a simple relationship. Namely, the price never moves in a straight line. Even if from the point of view of a certain interval it may look like this, then switching to another TF we will notice that the price creates smaller specific waves that form a candle at a higher time interval. Due to this relationship, the price that is moving in an upward trend may increase, then go back a bit, then return to the trend and reach a new peak. Of course, the downward trend may be similar. If we learn to draw channels around specific price actions, it can help us identify trend restrictions. There are different types of channels, however w In the case of the Wolfe Waves formation, the parallel channel is the most important.
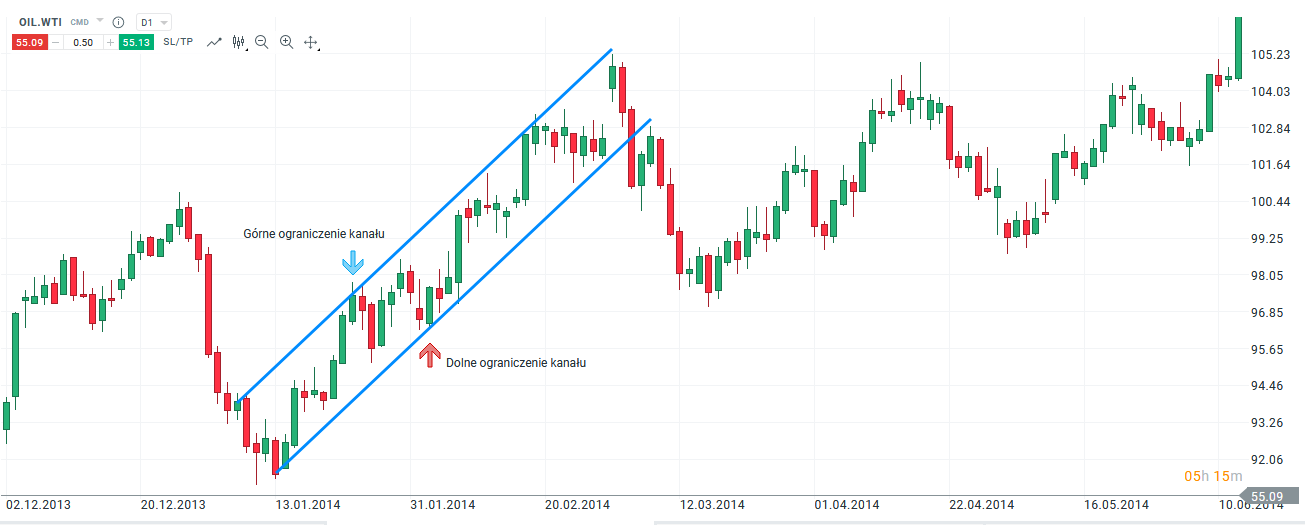
Example of a parallel channel. Chart crude oil WTI, D1 interval. Source: xNUMX XTB xStation
Formation search rules
If you're an experienced trader, identifying a formation shouldn't cause you much trouble. Always remember the following rules.
- Formation is formed within the channel. If it is not possible to draw the perfect channel, the lines should not diverge too much. The more parallel and symmetrical the channel, the better.
- There must be a third and a fourth wave that remain within the channel formed by the first and second wave.
- The time horizon of waves should be consistent with each other. The angles of the trend line should look symmetrical.
- The fourth rule is one of the most important. During the upward trend, the fifth wave should break through the top channel line only by a small margin. The situation is the same during the downward trend. The fifth wave will slightly break through the bottom channel line.
- The last rule characterizing the formation is the return of the price to the channel after a false break.
If the conditions presented are met, it can be considered that the formation has formed and consider taking a position in the opposite direction to the current trend.
Wolfe Waves on the price chart
Formations can be found in every type of market. Our example will be the popular kiwi, NZDUSD. As we can see, the pair moved downward to a certain point. The Wolfe Waves formation began to form at 1. Then the price went up, creating the 2 point and downwards, forming the 3 point. Of course, when analyzing the pair in real time, we do not see any more candles and the 3 point is a good place to start drawing the channel. The parallel channel should estimate where the 4 point will roughly fall before the price reaches it. If after the creation of the 4 point the price still remains in the channel, the formation is likely to be realized. The last step for this to happen is to gently knock the 5 point out of the channel and then return. For us traders, the most important is the 5 point, because it is here that the potential opening of position can occur.
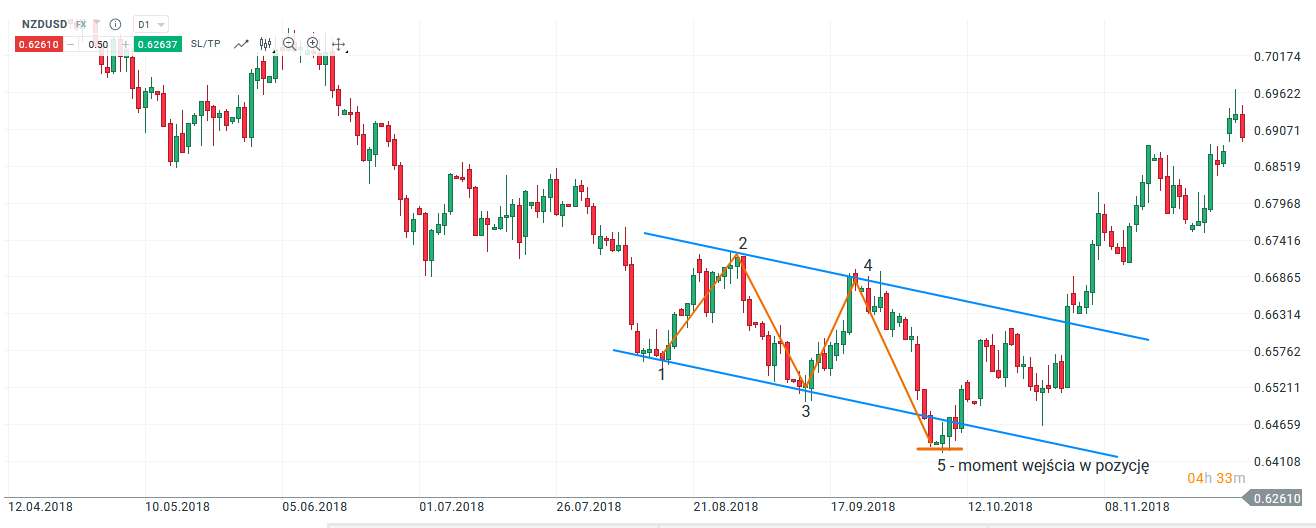
Example of formation on the price chart. Chart NZD / USD, D1 interval. Source: xNUMX XTB xStation
Summation
Formation identification and trading based on it can result in interesting setups with a potential high R: R ratio. The key in this type of trade is to pay attention to the symmetry of the waves and the slope of the parallel channel. The greater the slope, the greater the chance to reverse the trend.


