


Passive Investing - Exposure to the EAFE market

A very large share of American companies in the composition ETFs is a common problem when considering passive investing. This is not surprising since the American capital market is the most developed in the world. On the other hand, the share of the US economy in global GDP is much lower than that of US equities in investor assets. If an investor wants his portfolio to reflect the "world share of countries in GDP", it is necessary to acquire ETFs that ignore US equities. One such example is iShares Core MSCI EAFE ETF, which is one of the largest ETFs in terms of accumulated assets under management.
EAFE is short for Europe, Australasia and The Far East.
ETFs exposed to this market allocate their funds to developed economies, bypassing the US market. Therefore, they can be an interesting supplement passive wallet. This is due to the fact that the investment risk (e.g. political, currency) is much lower than in the case of investing in developing markets (e.g. EEM).
MSCI EAFE Index and MSCI EAFE IMI
The EAFE index was developed by Morgan Stanley Capital International (MSCI) in 1969. As mentioned before, EAFE offers exposure to the Australian, Asia-Pacific and Middle East markets. At the end of September 2021, the index comprised 845 companies from 21 countries and regions. Europe has the largest representation with 15 representatives (countries). There are two representatives from the Australasia region (Australia and New Zealand), while Far Asia has companies from Singapore, Japan and Hong Kong. It is worth mentioning that there is also one representative from the Middle East (Israel). It should be mentioned that MSCI constantly monitors the countries. For this reason, there is a periodic rotation of countries. For example, in 2001–2013, Greece was included in the index. On the other hand, Israel joined the MSCI EAFE Index in 2010.
READ MUST: Passive investing - what is it | Advantages and Disadvantages [Guide]
The index variance is MSCI EAFE NAME (Investable Market Index), which was created in 2007, just like the main index, also has the same number of countries. They only differ in the number of shares in the index. MSCI EAFE IMI has 3215 companies compared to just under 900 in the core index.
Despite the fact that the index includes representatives of 21 countries and regions, it is MSCI EAFE IMI is very geographically concentrated. At the end of September 2021, the 3 largest countries (Japan, Great Britain, France) accounted for 48,7% of the assets accumulated in the ETF. In turn, the 5 largest countries accounted for 66,34% index. The most important sector in the ETF is industry, accounting for 16,9% of the fund's assets. It is followed by the financial sector (16,4%) and discretionary goods (12,9%). In the index at the end of October 2021, the average capitalization exceeds $ 6,3 billion. The median capitalization of the index companies exceeded $ 1,4 billion. It is worth noting that among the ten largest components of the index, there are only two Asian companies - Toyota Motor and Sony Group. In turn, the top 10 includes a large representation of companies from the healthcare sector (4), including Roche, Astrazeneca, Novartis, and Novo Nordisk.
iShares Core MSCI EAFE ETF
However, an investor is not able to invest directly in the MSCI EAFE IMI Index. The way out of this situation is to take advantage of ETFs offering exposure to this index. The largest in terms of assets is the iShares Core MSCI EAFE ETF. The mentioned ETF is relatively new, established in October 2012. At the end of November 15, assets under management totaled $ 104,91 billion. The ETF consists of 3004 companies. Average price/Profit (P / E) on November 15 was 21,1. It is also worth adding that the moving dividend yield was 2,23%. The annual management cost is very low and amounts to 0,07%. Due to the fact that the ETF replicates the index physically, the distribution of sectors and the largest positions in the portfolio is very similar to that of MSCI. For this reason, we will not describe the division into sectors and the geographical distribution of the fund. Below we present a list of the top 10 positions in the portfolio and a brief overview of selected 6 companies.
Top ETF positions as of November 12:
| Company name | Participation in the index |
| Nestle S.A | Present in several = 1,86% |
| ASML Holding NV | Present in several = 1,70% |
| Roche Holding | Present in several = 1,35% |
| LVMH | Present in several = 1,10% |
| Toyota Motor | Present in several = 0,93% |
| Novo Nordisk | Present in several = 0,91% |
| Novartis AG | Present in several = 0,88% |
| Astrazeneca Plc | Present in several = 0,88% |
| sony-group | Present in several = 0,74% |
| SAP | Present in several = 0,72% |
LVMH
LVMH Moët Hennessy Louis Vuitton, is the largest component of the CAC 40 index. It is an international corporation that specializes in the production and sale of luxury goods. The company's seat is in Paris. The company was established in 1987 as a result of the merger of Louis Vuitton (established in 1854) and Moët Hennessy (resulting from the merger of the Moët & Chandon champagne producer and the Hennessy cognac producer). LVMH has many interesting brands in its portfolio. These include Louis Vuitton, Christian Dior, Bulgari, Tiffany, Zenith or Emillio Pucci. The company employs over 150 people and sells its products in over 000 stores. Of course, 5000 forced the company to sell more via the Internet (own websites, websites of trading partners). The company generates the largest sales on the Asian market (2020%). It is followed by Europe (41%) and the United States (24%). He controls the company Bernard Jean Etienne Arnaultwho is one of the richest people in the world. The current capitalization of the company exceeds €363 billion.
| EUR million | 2017 | 2018 | 2019 | 2020 |
| revenues | 42 636 | 46 826 | 53 670 | 44 650 |
| operational profit | 8 299 | 9 985 | 11 372 | 8 311 |
| operating margin | Present in several = 19,46% | Present in several = 21,32% | Present in several = 21,19% | Present in several = 18,61% |
| net profit | 5 129 | 6 354 | 7 171 | 4 702 |
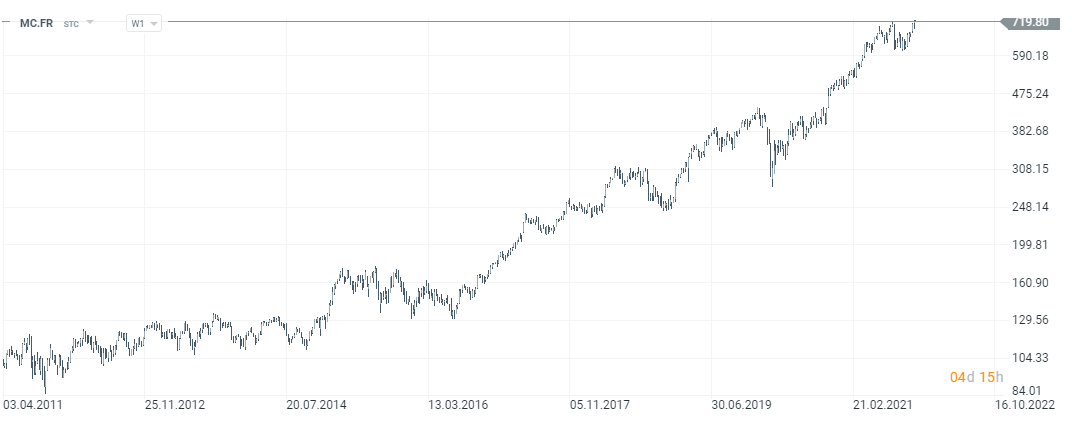
Chart of LVMH shares, interval W1. Source: xNUMX XTB.
sony-group
It is a Japanese technology company headquartered in Tokyo. Sony is known, among others from their consoles that operate under the PlayStation brand (market leader). In addition, it is one of the largest TV manufacturers in the world (3rd place in the world in terms of sales). It is also worth noting that Sony, through Sony Interactiv Entertainment, is the largest game publisher in the world, with revenues exceeding $ 18 billion in the 2019/2020 fiscal year. Sony is also present in the music market. In 2020, Sony Music Entertainment is the second largest company in the music industry (after Universal Music Group). Sony is also the world's largest producer of image sensors. The company is listed on the Tokyo Stock Exchange and is a component of indices such as Nikkei 225 and TOPIX Core30. Sony is listed on the New York Stock Exchange (NYSE) via ADRs.
| billion JPY | 2018FY | 2019FY | 2020FY | 2021FY |
| revenues | 8 543,9 | 8 665,7 | 8 259,9 | 8 999,4 |
| operational profit | 730,4 | 825,7 | 832,2 | 967,8 |
| operating margin | Present in several = 8,55% | Present in several = 9,53% | Present in several = 10,08% | Present in several = 10,75% |
| net profit | 490,8 | 916,3 | 582,2 | 1 171,8 |
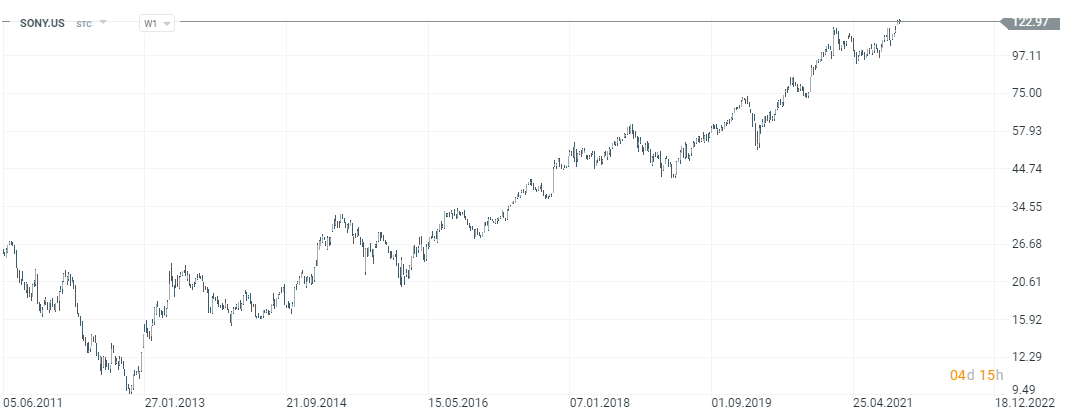
Sony Group stock chart, interval W1. Source: xNUMX XTB.
Toyota Motor
It is one of the symbols of Japan's economic modernization. Toyota was founded in the second half of the XNUMXs by Kiichiro Toyoda. Initially, Toyota Moror was part of the Toyota Industries group, which was Sakichi Toyoda - the father of Kiichiro. After the Second World War, Toyota Motor transformed from a regional company into a leader in the automotive industry. He helped in that way management (the so-called The Toyota Way) and the innovative production system (Toyota Production System). In 2020, Toyota was ranked 9th on the Fortune 500 list. This year, the Japanese company was the largest car manufacturer (in terms of sales) in the world. The company employs over 360 people. In the last financial year, Toyota sold 000 million cars. The largest number of cars was sold in North America (7,6 million). Another market is Japan (2,3 million). In addition to the Toyota brand, the company also has a line of luxury cars (Lexus). The current capitalization of the company exceeds $ 2,1 billion.
| billion JPY | 2018FY | 2019FY | 2020FY | 2021FY |
| revenues | 29 380 | 30 226 | 29 930 | 27 215 |
| operational profit | 2 400 | 2 468 | 2 443 | 2 198 |
| operating margin | Present in several = 8,17% | Present in several = 8,17% | Present in several = 8,16% | Present in several = 8,08% |
| net profit | 2 494 | 1 883 | 2 076 | 2 258 |
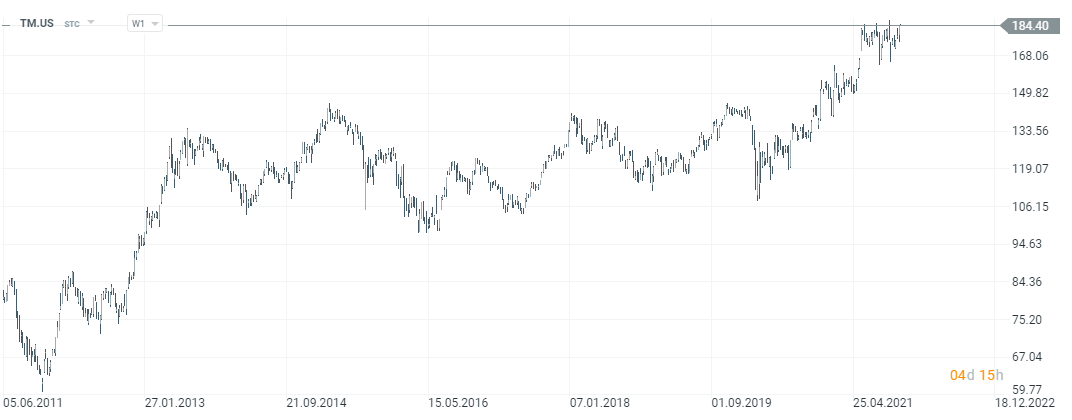
Toyota Motor stock chart, interval W1. Source: xNUMX XTB.
SAP
It is one of the largest technology companies in the world. SAP focuses on providing software to companies in order to better manage resources in the company. The best known solution is SAP ERP. The company boasts that 91% of Forbes Global 2000 companies use SAP solutions. In addition to ERP systems, the company provides customer relationship management (CRM) software. It also has a wide analytical offer and also has popular solutions in the field of supply chain management. The company is growing both organically and through acquisitions. Since 1991, SAP has acquired 73 companies. One of the largest acquisitions in recent years was Qualtrics, which is a platform that helps manage relationships with customers and employees within the company. The company's capitalization exceeds € 175 billion.
| EUR million | 2017 | 2018 | 2019 | 2020 |
| revenues | 23 460 | 24 708 | 27 553 | 27 338 |
| operational profit | 5 060 | 5 723 | 5 603 | 6 621 |
| operating margin | Present in several = 21,57% | Present in several = 23,16% | Present in several = 20,34% | Present in several = 24,22% |
| net profit | 4 018 | 4 083 | 3 321 | 5 145 |
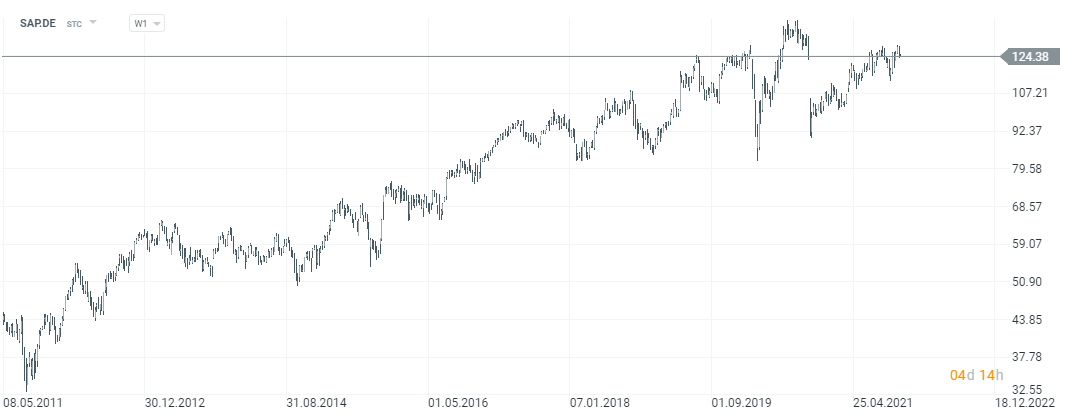
SAP stock chart, interval W1. Source: xNUMX XTB.
Roche Holding
The company was founded in 1896 from Fritz-Hoffmann-La Roche. Initially, it was involved in the production of various vitamins. In 1934, she began mass production of synthetic vitamin C. The product was sold under the name Redoxon. Roche Holding is a Swiss company that operates in two segments: pharmaceutical and diagnostic. The company is listed on the SIX Swiss stock exchange. Roche was the largest pharmaceutical company in the world in 2020. During 9 months of 2021, 71,5% of revenues were generated by the pharmaceutical segment.
The most important market for the company's drugs is the US market, which accounts for approximately 50% of sales. One of the most important drugs sold by Roche are the cancer-fighting products Tecentriq and Avastin, which together generated CHF 5 billion in sales in the first three quarters of 3. As mentioned earlier, diagnostics is the next segment. The most revenue is generated by the EMEA market (Europe, Middle East and Africa), which is responsible for 2021% of the company's sales. Another important market is Asia-Pacific (43%). At the end of 27, the company employed over 2020 employees. The company's capitalization is CHF 100 billion.
| CHF million | 2017 | 2018 | 2019 | 2020 |
| revenues | 53 299 | 56 846 | 61 466 | 58 323 |
| operational profit | 13 003 | 14 743 | 17 548 | 18 543 |
| operating margin | Present in several = 24,40% | Present in several = 25,93% | Present in several = 28,55% | Present in several = 31,79% |
| net profit | 8 633 | 10 500 | 13 497 | 14 295 |
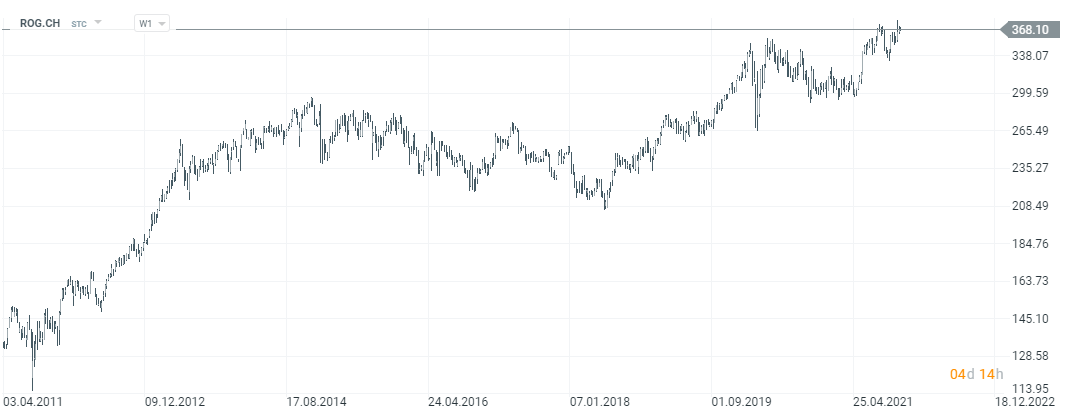
Roche Holding stock chart, interval W1. Source: xNUMX XTB.
Novartis AG
The company was founded in 1996 as a result of a merger between Ciba-Geigy and Sandoz. The Swiss company is one of the largest pharmaceutical companies in the world. In Q2021 XNUMX, the highest revenues were generated by drugs such as:
- Cosentyx ($ 1,25 billion), which reduces plaque psoriasis symptoms,
- Entresto ($ 924 million), used by people with long-term heart failure.
In 9 months of 2021, Cosentyx generated $ 3,5 billion in revenues, Entresto $ 2,6 billion and Zolgensma $ 1 billion. It is worth mentioning that 23 preparations accounted for 48% of the company's revenues in Q2021 110. The company employs over 187 thousand. employees. Novartis capitalization exceeds $ XNUMX billion.
| million USD | 2017 | 2018 | 2019 | 2020 |
| revenues | 50 135 | 53 166 | 48 677 | 49 898 |
| operational profit | 8 629 | 8 169 | 9 086 | 10 152 |
| operating margin | Present in several = 17,21% | Present in several = 15,37% | Present in several = 18,67% | Present in several = 20,35% |
| net profit | 7 703 | 12 611 | 11 732 | 8 072 |
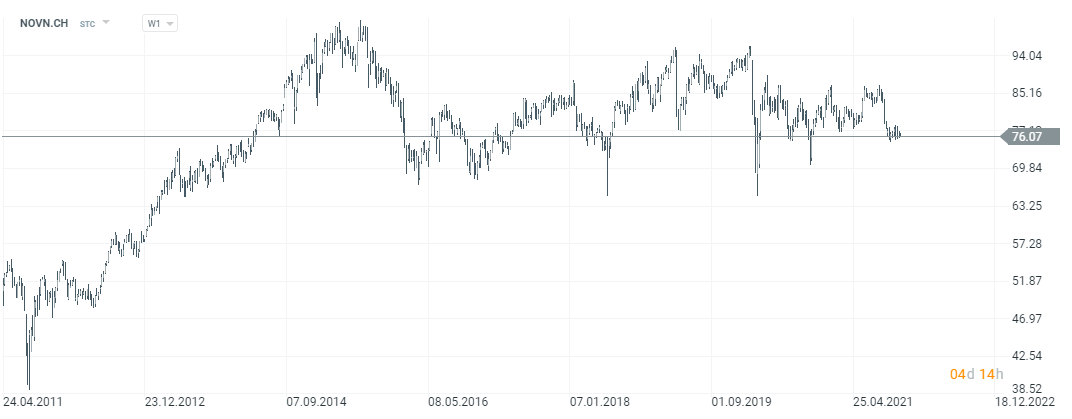
Novartis AG stock chart, interval W1. Source: xNUMX XTB.
Additional information about IEFA
iShares Core MSCI EAFE ETF has generated an average annual rate of return (total return) of approximately 7,7% since its inception. However, over the past 5 years, the average annual rate of return has been 9,1%. The average rate of return is due to the fact that the main share of the ETF is held by mature companies with an established position and single-digit organic growth. However, the advantage of the mentioned ETF is the exposure to the developed economies of European and Asian countries.
Passive Investing - Where to Invest in Stocks and ETFs?
An increasing number of forex brokers have quite a rich offer of stocks, ETFs and CFDs for these instruments.
For example on XTB Today, we can find over 3500 equity instruments and 400 ETFs, a Saxo Bank over 19 companies and 000 ETF funds.
| Broker |  |
||
| End | Poland | Denmark | Cyprus * |
| Number of exchanges on offer | 16 exchanges | 37 exchanges | 24 exchanges |
| Number of shares in the offer | approx. 3500 - shares circa 2000 - CFDs on shares |
19 - shares 8 - CFDs on shares |
approx. 3 - CFD on shares |
| The amount of ETF on offer | approx. 400 - ETF approx. 170 - CFD on ETF |
3000 - ETF 675 - CFD on ETF |
approx. 100 - CFD on ETF |
| Commission | 0% commission up to EUR 100 turnover / month | according to the price list | Spread depends on the instrument |
| Min. Deposit | PLN 0 (recommended min. PLN 2000 or USD 500, EUR) |
0 PLN / 0 EUR / 0 USD | PLN 500 |
| Platform | xStation | SaxoTrader Pro Saxo Trader Go |
Plus500 platform |
* PLUS500 CY offer
CFDs are complex instruments and come with a high risk of losing money rapidly due to leverage. From 72% to 89% of retail investor accounts record monetary losses as a result of trading CFDs. Think about whether you understand how CFDs work and whether you can afford the high risk of losing your money.


