


Polish 10-year bonds already above 9%, S & P500 and inflation in the US

The past week turned out to be quite positive for the stock markets. The S & P500 has grown the most since June this year. Can we, therefore, count on a continuation of good moods in the coming weeks? There are several arguments for "yes", but it is still a bearish market.
In the bond markets, the opposite was true, both in the USA and in Poland. In our market on Friday during the day the yields of the 10-year treasury bonds exceeded the level of 9% for the first time in history. Is the Polish bond market to some extent afraid of a loose fiscal and monetary policy at the same time?
Positive week for the S & P500
The past week was very successful for American stocks. S & P500 index increased by 4,7%, which is the highest since June this year. The dovish "leaks" from the FED certainly helped in reducing the pace of rate hikes already at the December meeting (at the November meeting, an increase by 0,75 percentage points is practically certain). The market looks good technically (support defended), and the mid-term elections to Congress (November 8) are ahead of us, which may turn out to be positive for the equity markets.
W.1 Weekly change in the S & P500 index:

Source: own study, stooq.pl
Therefore, it is possible to continue the better sentiment in the stock markets in the following days / weeks. But I do not recommend anyone to bet on the size or length of a possible bounce during the bear's roar. There are rather no rules here, the only thing we know is that such a reflection will occur sooner or later.
V.2 of the S & P500 Index:
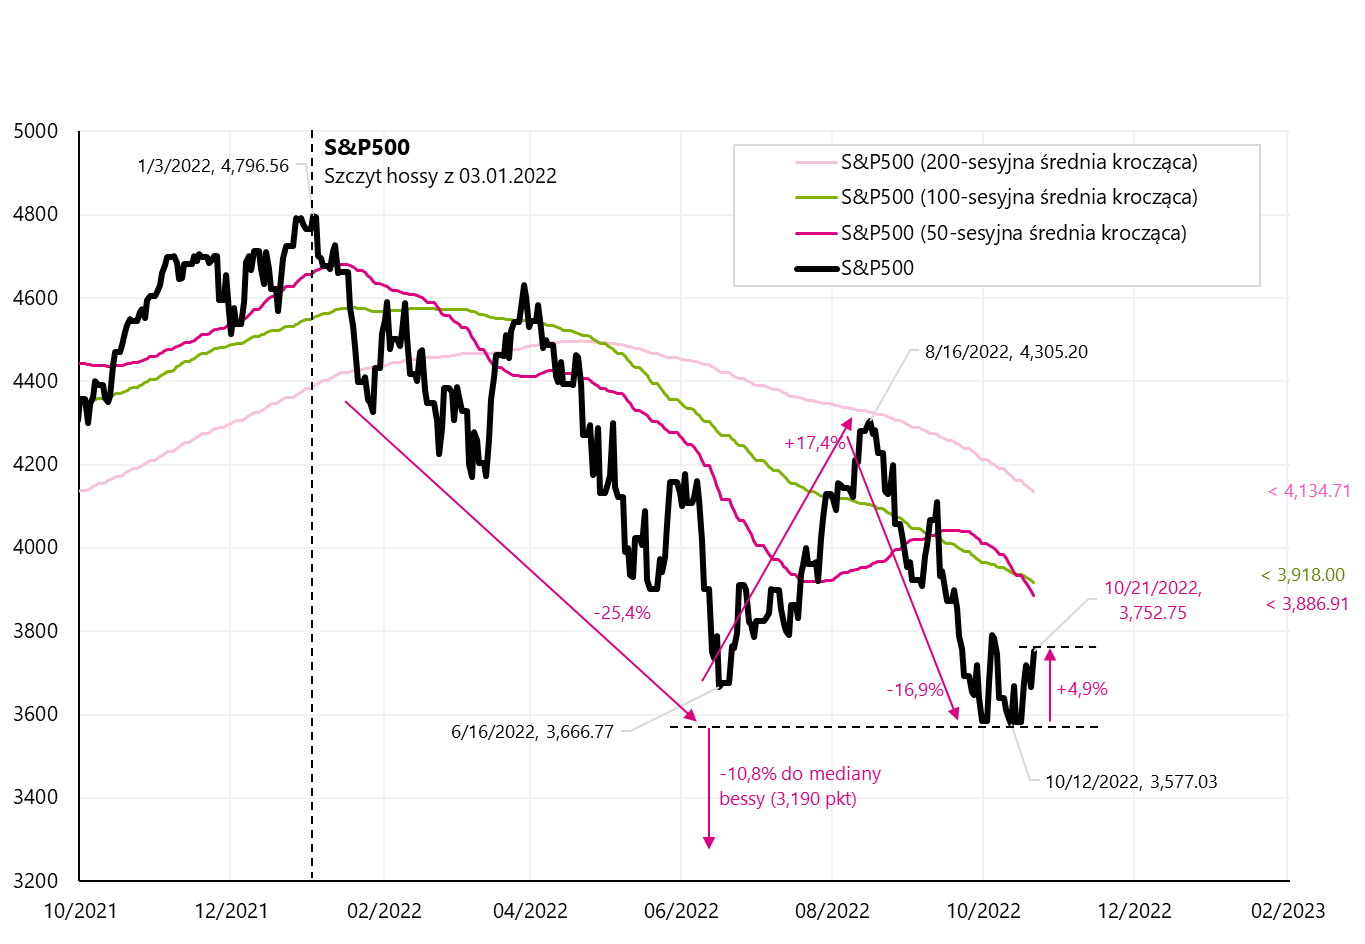
Source: own study, stooq.pl
The rebound in stocks is not "bought" by the US Treasury bond marketwhich ended last week with a loss of 1,06%. In general, both markets this year behaved "identically" in terms of price changes. Only in March this year. stocks rebounded stronger in spite of the bond market - but in the end it was the bond market that was right then. Details on the next chart.
W.3 S & P500 Index and iShares UST Bond ETF:
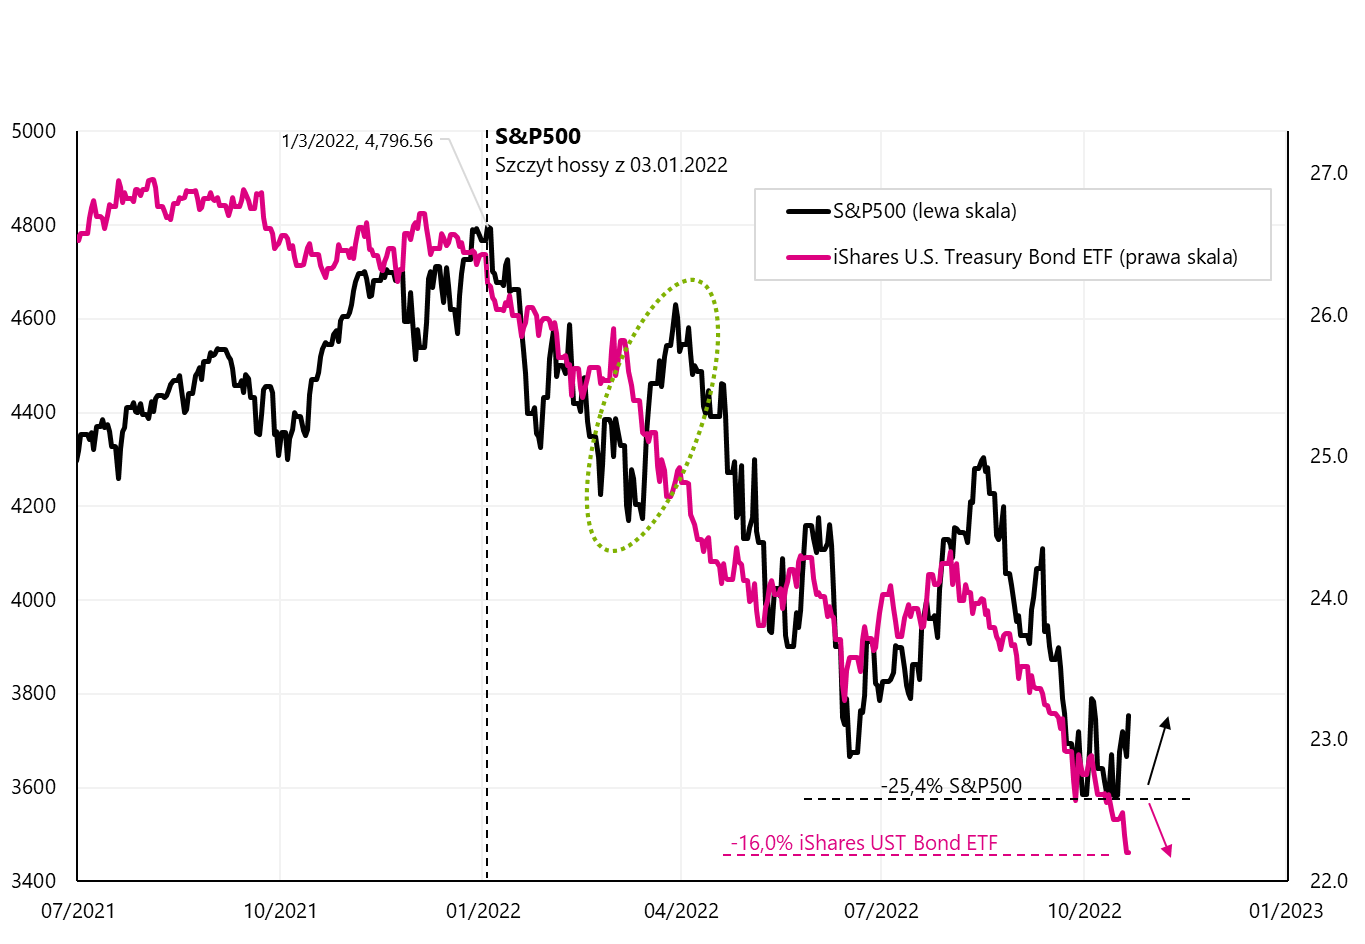
Source: own study, stooq.pl, ishares.com
More about inflation in the US
In principle, it can be said that it is inflation, and more precisely the prospects of its decline, that will determine the low point in the stock and bond market. Therefore, let's analyze its most important details once again. Annual consumer inflation in the US has been falling since June. We had a hike in inflation at 9,1%, and then in each subsequent month it was lower to 8,2% in September this year. So why don't the markets like it? As always, the devil is in the details.
Core inflation can be broken down into core services inflation and core commodities inflation. It is mainly about core service inflation, the contribution of which to the annual change in inflation is constantly growing. We present this in the next chart. It can be seen that in normal times (eg 2010 to 2020) the contribution of the underlying services is practically constant and "flat". From the fourth quarter of 2021. is growing strongly and even accelerated in September this year. Thus, the decline in the annual dynamics of the entire basket of inflation is not as attractive as it might seem at first glance.
W.4 Annual change in inflation and the contribution of core inflation in services (non-seasonally adjusted series):

Source: own study, based on FRED databases
Core service inflation accounts for as much as 57,1% of the entire inflation basket. The second part of core inflation, i.e. commodity inflation accounts for 21,2% of the entire basket and in normal times its contribution to the annual change in inflation may be "neglected". The spike in this contribution in 2021-2022 (as can be seen in the next chart) was caused by huge fiscal stimulus related to the fight against the effects of the pandemic (which boosted the demand for goods and durable goods). It can be expected that the impact of this part of core inflation on overall inflation will fade out relatively easily in a natural way. But that can no longer be said of "sticky" core service inflation.
W.5 Annual inflation change, and the contribution of core commodity inflation (non-seasonally adjusted series):
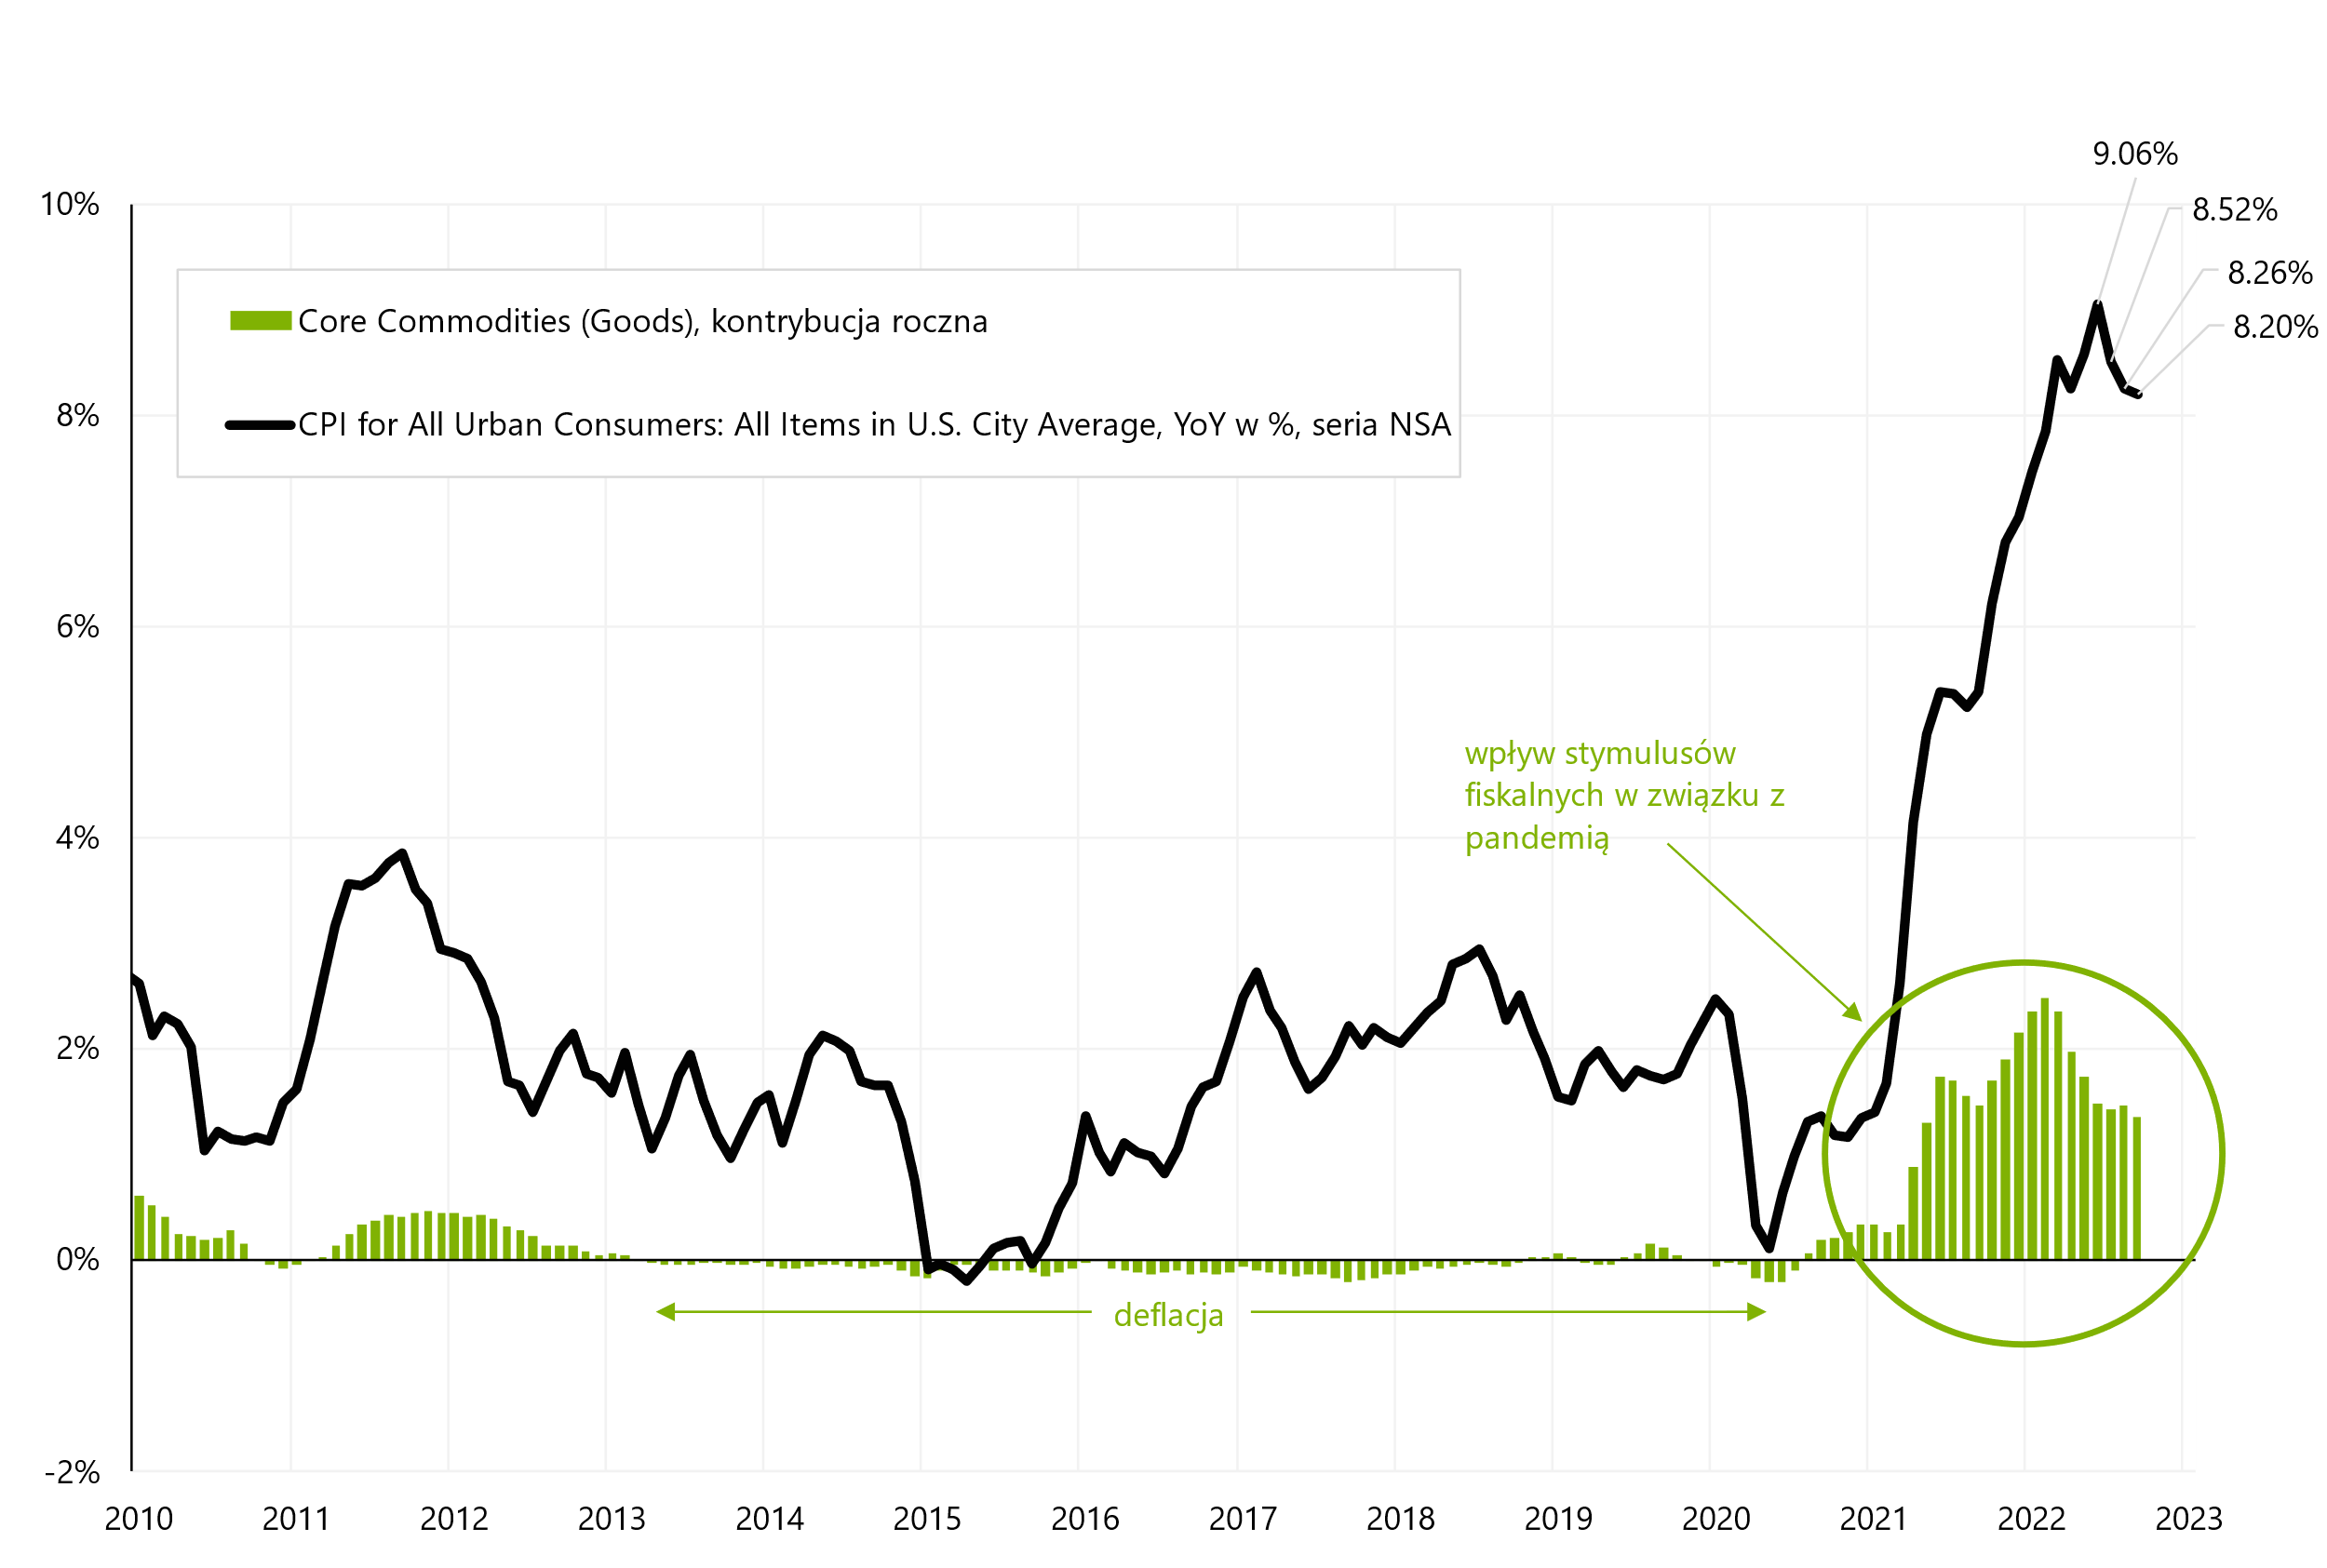
Source: own study, FRED
In the 70s, to beat inflation, the Fed's interest rate had to be higher than nominal GDP growth. Overall, the inflation rate is "nominal" and in this sense it should be compared to nominal (not real) economic growth. Interestingly Nominal GDP growth in the US in the 70s has never been below 3% (year on year, which is the same as we show the inflation rate). This is shown in the next chart. Only the FED rate above nominal GDP growth allowed to break the inflation spiral.
W.6 The Fed's interest rate in 1964-1994 against the background of nominal GDP growth:
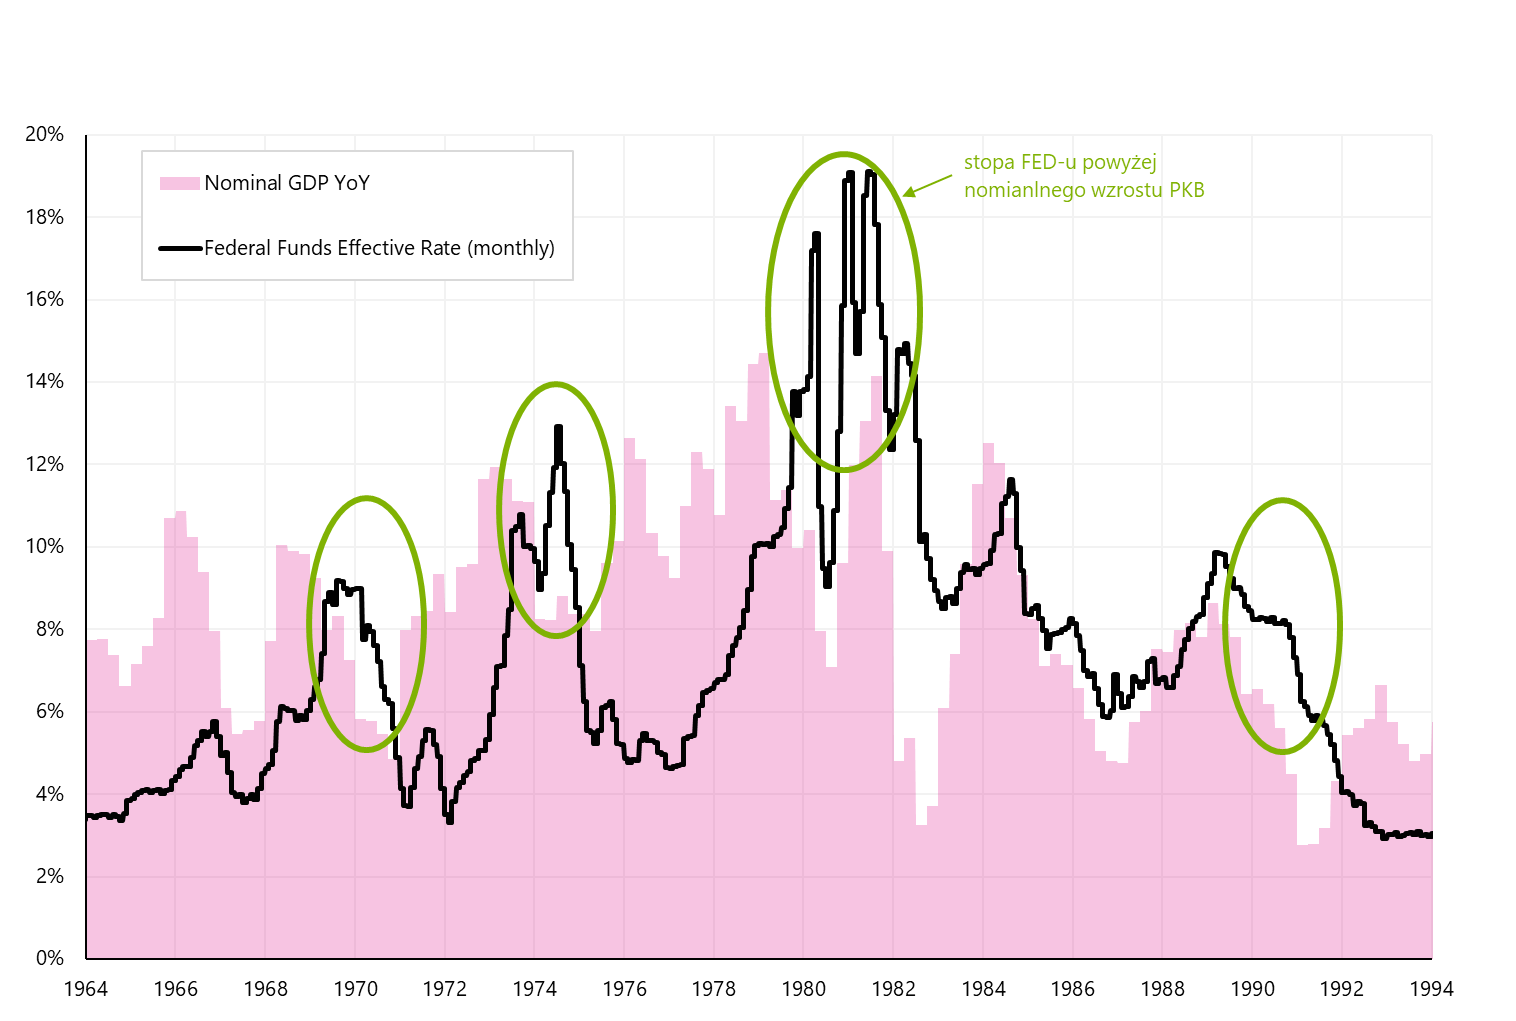
Source: own study, FRED
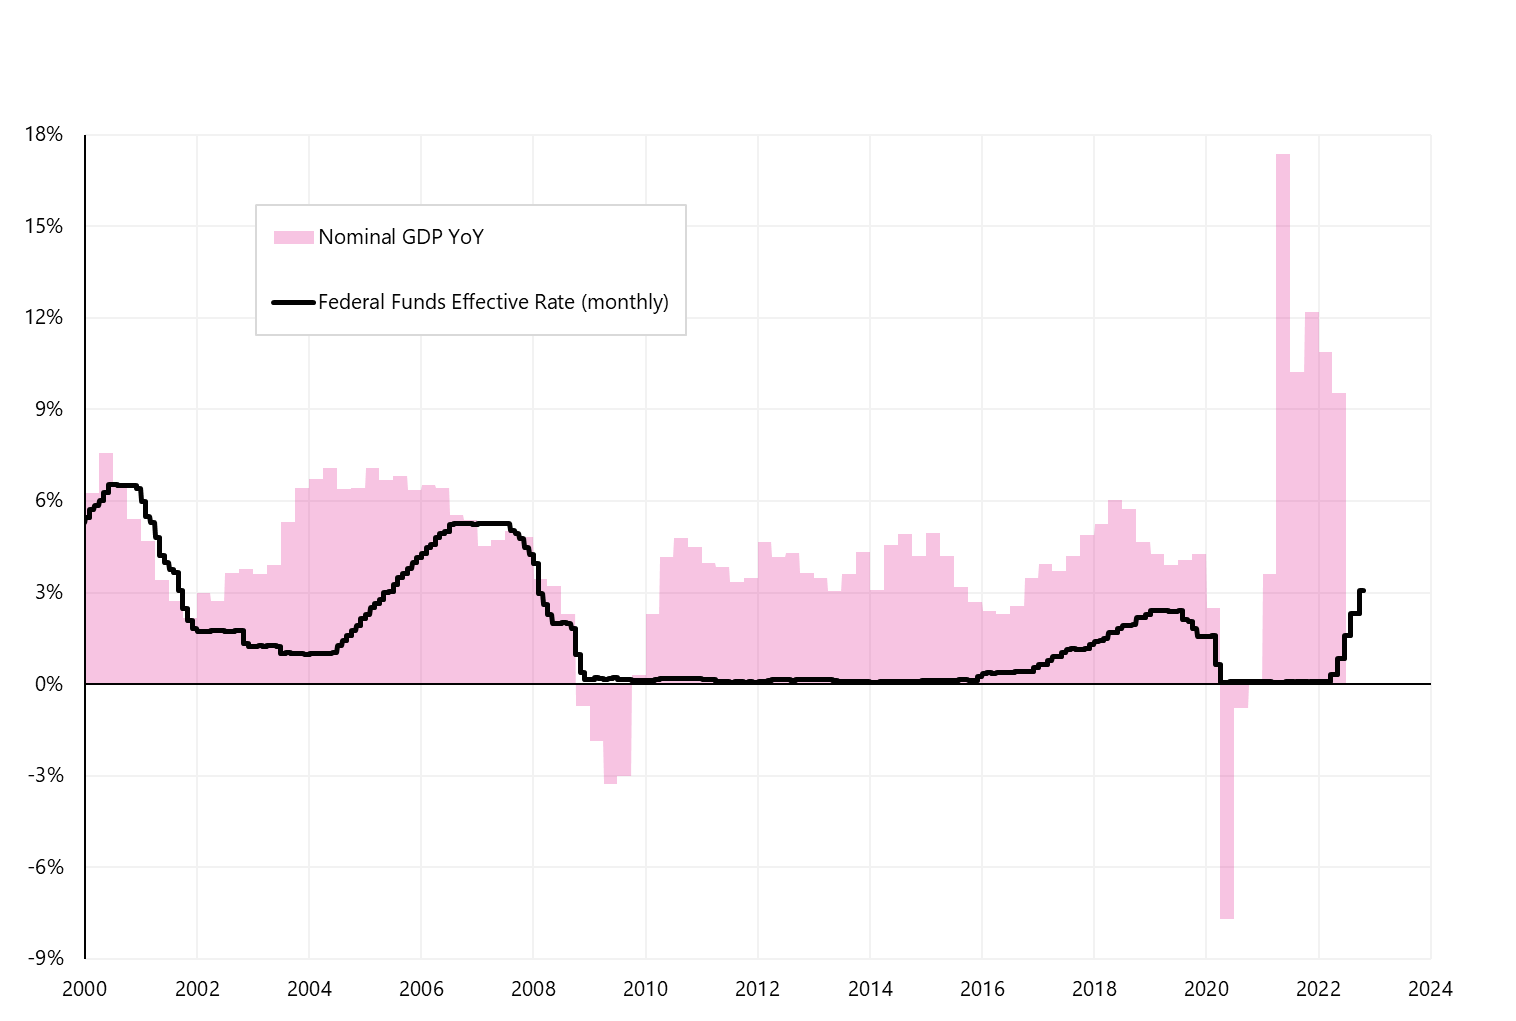
What is the situation today? The growth of nominal GDP in the US economy in the second quarter of 2022 amounted to 9,55%. The current interest rate of the Fed is only 3,125%. Of course, according to the market (based on Federal Funds Futures quotes), the Fed will raise rates to 4,9% by May 2023. With inflation falling in the coming quarters, nominal GDP growth will also fall from the current 9% (even if we will grow around 0% in real terms). But at least from the perspective of the experience from the 70s, there is still room for further rate hikes by the Fed (so that the target rate of the FED is above the nominal growth in the range of 3 to 8 percentage points).
Of course, this does not have to happen (for the FED to raise rates above 5%), but in the coming months we may have further pressure on bond and stock prices along with inflation data flowing (core service inflation is more "sticky" than assumed by the market), and data from the economy (interest rate hikes do not weaken nominal growth as assumed by the market).
W.7 The Fed's interest rate in 2000-2024 against the background of nominal GDP growth:
Source: own study, FRED
Polish 10-year bonds are already above 9%
On Friday, the yield on Polish 10-year treasury bonds exceeded 9% during the day. Rising profitability means a drop in price. For example, the treasury bond DS1030 is currently trading at around 57-58% of its face value. In September this year. the yield on the 10-year bond was below 6%. Therefore, not only do we have record levels, but also a very large increase in them only within one month. Growing government bond yields not only bring big losses to their holders, but also affect the cost of financing for the entire economy.
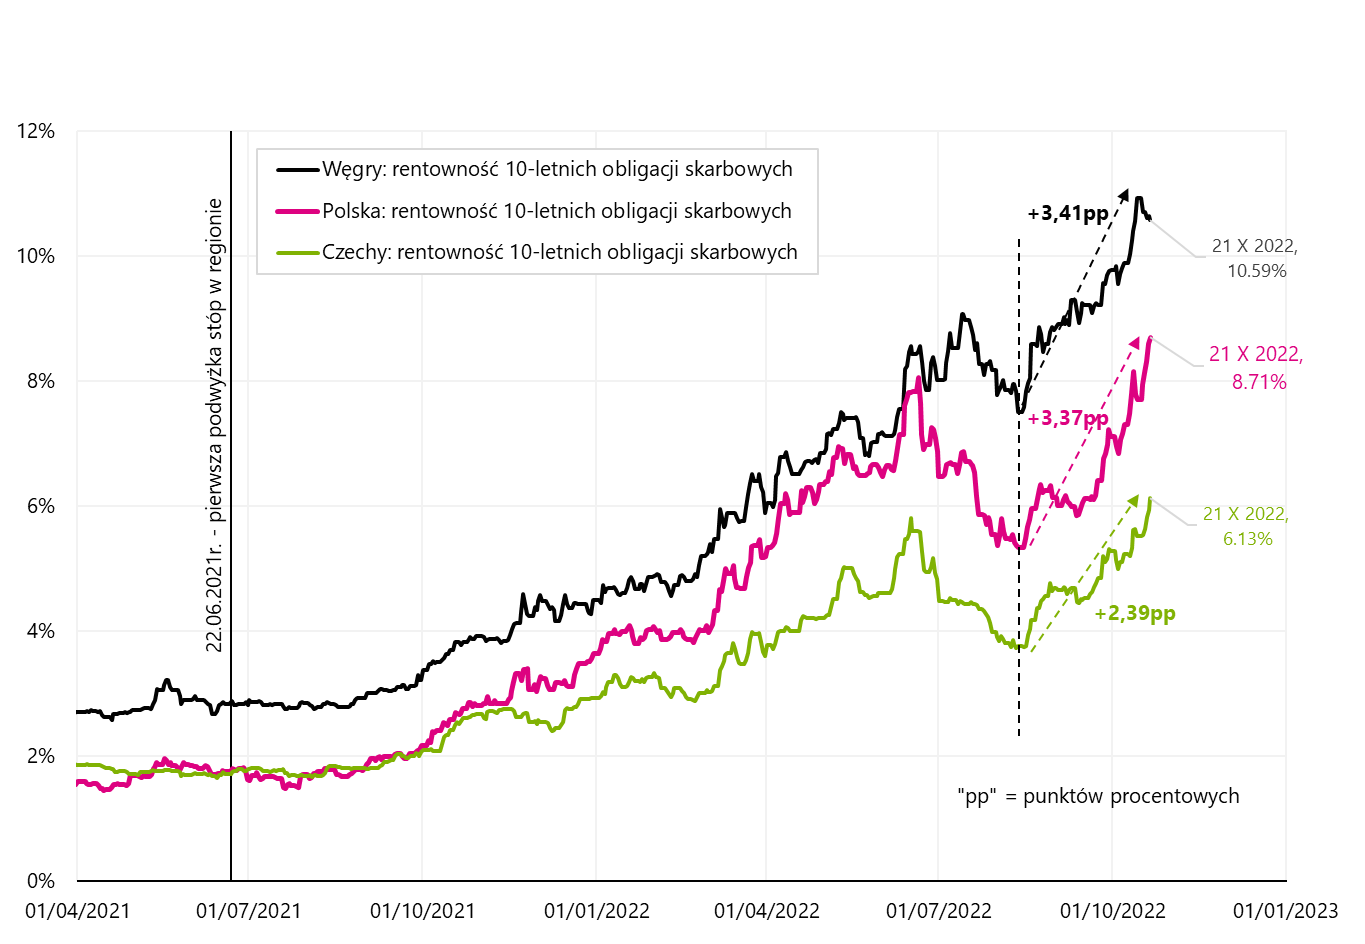
W.8 Change in yields on 10-year treasury bonds in Poland, the Czech Republic and Hungary:
Source: own study, stooq.pl
Fortunately, yields also increased in the Czech Republic and Hungary, and the increase in the yields on our bonds is not only due to local factors. You can't see it in the chart above, but the close in Poland (8,71%) was as much as 34 basis points (0,34 percentage points) below the maximum yield during the day (9,05%). If we take this into account, we have higher profitability increases even than in Hungary.
Many factors may affect the yield on government bonds, but of the local factors, the two most important are future inflation and the future level of the NBP reference rate. Let us also compare the amount of nominal GDP growth with the level of the NBP reference rate and the inflation rate.
W.9 The NBP reference rate against the background of nominal GDP growth and inflation:

Source: own study, stooq.pl, NBP
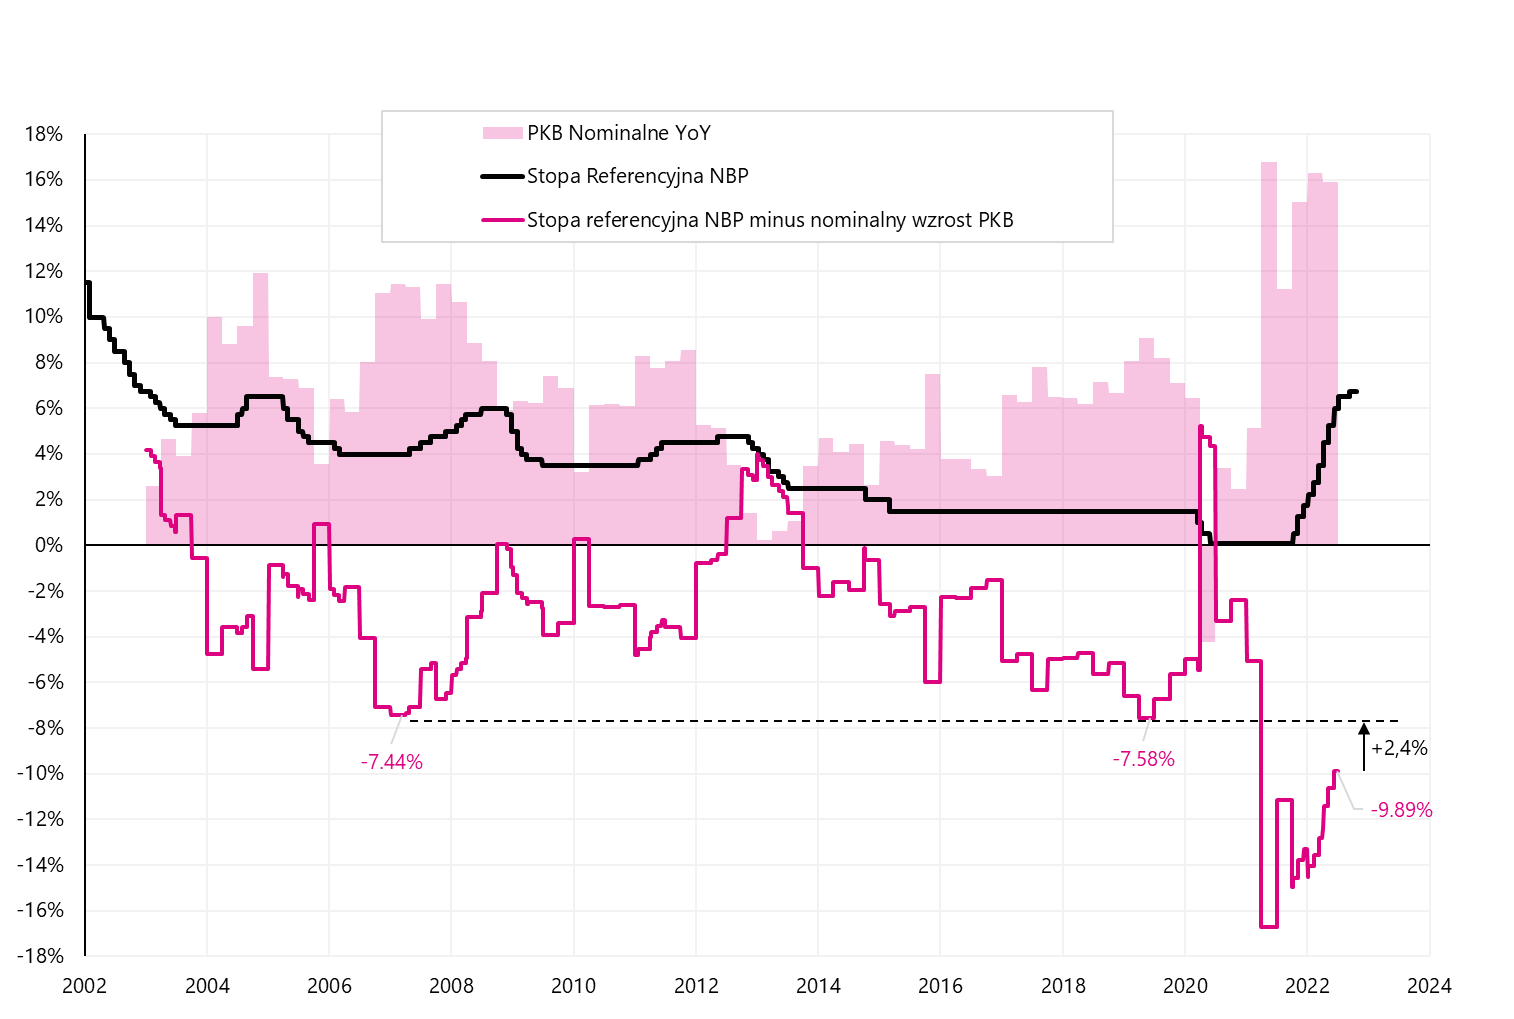
As can be seen in the above chart (green circle), the situation when the NBP reference rate is higher than inflation and at the same time higher than nominal GDP growth has a large impact on the decline in inflation. Today it is exactly the opposite: the reference rate is at 6,75%, inflation at 17,2% and nominal GDP growth is 15,9%. It is hard to imagine today that the NBP reference rate could be higher than the nominal GDP growth, but for example the level of around 9% is completely realistic. Then we would also even out the historical maximum difference between the reference rate and nominal GDP growth, as shown in the next chart.
W.10 The NBP reference rate against the background of nominal GDP growth and inflation:
Source: own study, stooq.pl, NBP
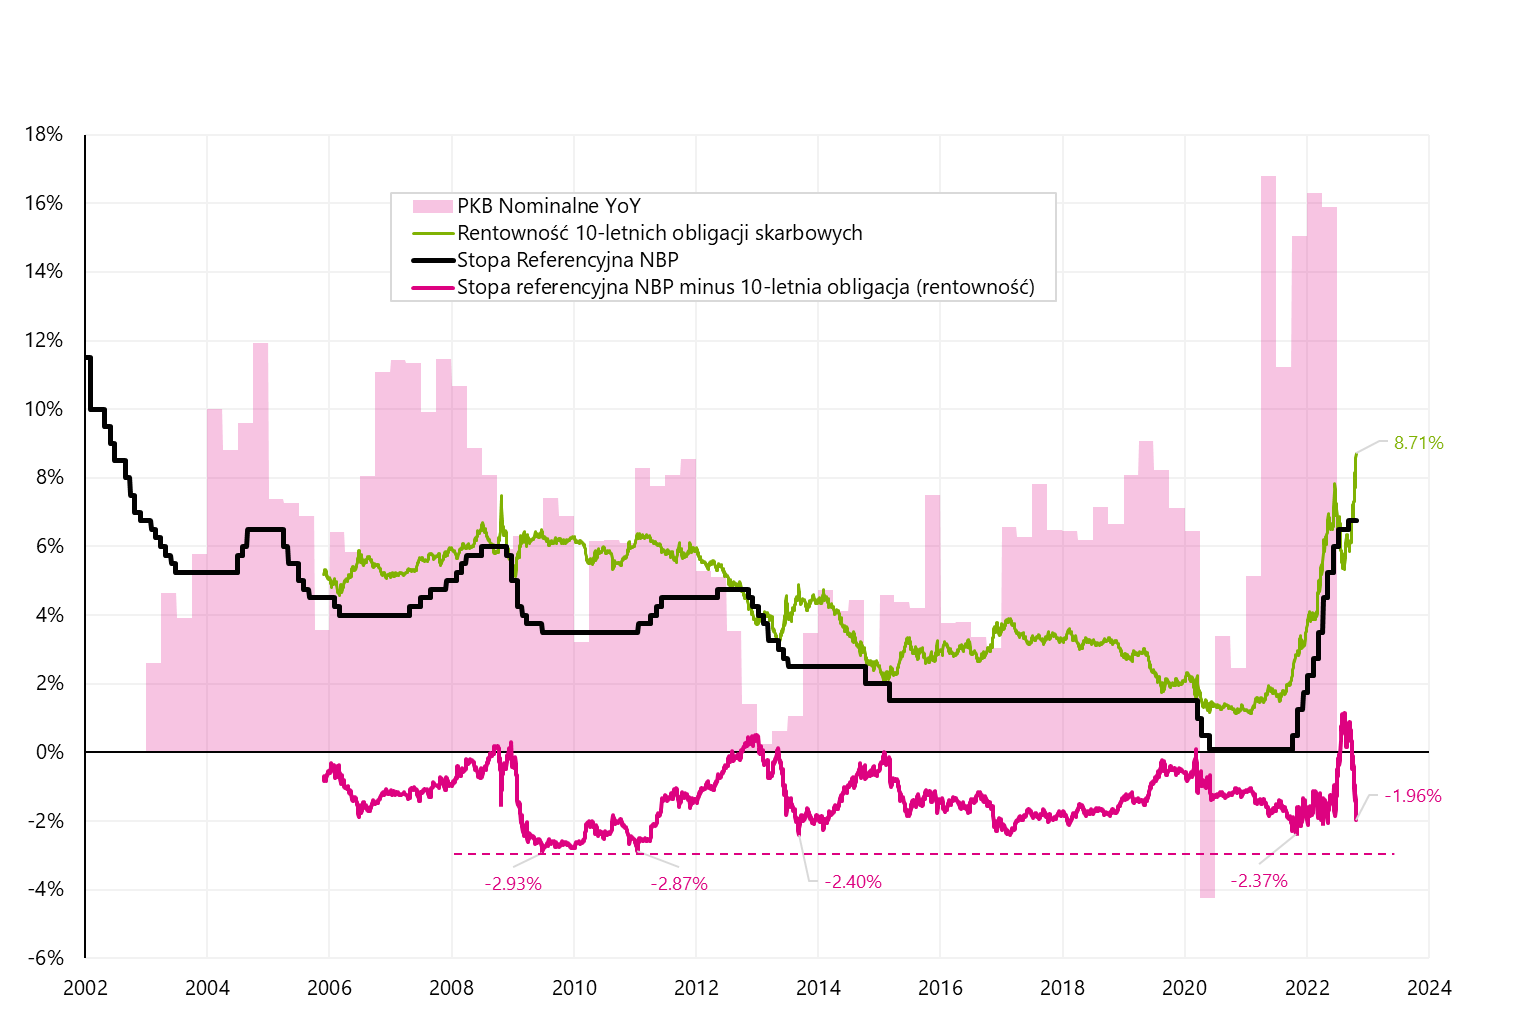
In the case of the 10-year treasury bond yield, since 2005 the largest difference to the NBP reference rate has been around 2,93 percentage points (today this would mean a yield of 9,6% - on Friday the maximum intraday yield was 9,05% ). Also, yields in the range of 9,5-10% would be more or less comparable to the situation in 2009-2011 (and then the bond market was right and the NBP reference rate was finally raised to 4,75% in 2012).
W.11 The NBP reference rate against the background of nominal GDP growth and inflation:
Source: own study, stooq.pl, NBP
Summation
US stocks ended the week in a better moodbut even if we are facing a continuation of the rebound, we should not forget that we are still in the bear market. A rebound in equities was not confirmed by bond markets, where in many countries last week (Friday) we saw the highest levels of 10-year government bond yields this year.
About the Author
 Jaroslaw Jamka - Experienced fund management expert, professionally associated with the capital market for over 25 years. He holds a PhD in economics, a license of an investment advisor and a securities broker. He personally managed equity, bond, mutli-asset and global macro cross-asset funds. For many years, he managed the largest Polish pension fund with assets over PLN 30 billion. As an investment director, he managed the work of many management teams. He gained experience as: Member of the Management Board of ING PTE, Vice-President and President of the Management Board of ING TUnŻ, Vice-President of the Management Board of Money Makers SA, Vice-President of the Management Board of Ipopema TFI, Vice-President of the Management Board of Quercus TFI, Member of the Management Board of Skarbiec TFI, as well as Member of Supervisory Boards of ING PTE and AXA PTE. For 12 years he has specialized in managing global macro cross-asset classes.
Disclaimer
This document is only informative material for use by the recipient. It should not be understood as an advisory material or as a basis for making investment decisions. Nor should it be understood as an investment recommendation. All opinions and forecasts presented in this study are only the expression of the author's opinion on the date of publication and are subject to change without notice. The author is not responsible for any investment decisions made on the basis of this study. Historical investment results do not guarantee that similar results will be achieved in the future.


