


A risk management guide for stock investors

Many investors have concentrated equity portfolios which entails a very high risk. We want to show that by combining a portfolio consisting of shares of 5 companies in a 50/50 proportion with a stock exchange fund (ETF) monitoring the broadly understood stock market, we significantly reduce the risk while maintaining the expected long-term return. If an investor is willing to lower their return expectations a bit, they can swap an ETF that follows the stock market into an asset tracking fund and lower the risk even further. Finally, we discuss the risks associated with inflation for real wealth and how you can potentially offset these risks in part.
About the Author

Peter potter - director of equity markets strategy in Saxo Bank. Develops investment strategies and analyzes of the stock market as well as individual companies, using statistical methods and models. Garnry creates Alpha Picks for Saxo Bank, a monthly magazine in which the most attractive companies in the US, Europe and Asia are selected. It also contributes to Saxo Bank's quarterly and annual forecasts "Shocking forecasts". He regularly gives comments on television, including CNBC and Bloomberg TV.
What is risk?
Last year, I wrote about mine approach to managing own capital, which met with a positive response. Given that stock prices were at their peak just months later, my comment came at the best possible time. With stock prices declining significantly from their recent peaks and the recent stock market rebound, we took a slightly different approach to risk management. We will discuss what risk is and what a typical trader can do to avoid risking being too risky if stocks go down again.
First, we need to distinguish between risk and uncertainty. Risk can be formally described as a process that is quantifiable where the confidence interval is related to the sample size; in other words, a process by which statistics can be kept. Uncertainty, on the other hand, is non-quantifiable, such as the invasion of Ukraine, because such an event is unique and therefore not associated with a significant probability.
In a broader context, we start with the final definition of risk, which is to avoid financial ruin. While this is an important concept and something that can be avoided if the investor refrains from using leverage, ruin can also mean a loss of 98% of their assets; So it is not just a total ruin. However, it is so large that to make up for losses, a profit of 4% would have to be generated, which illustrates the asymmetry between profits and losses.
READ: Building a risk management plan - how to do it?
A common definition of risk is the variance of some underlying process (e.g., an action), which is a statistically measure of how much a process oscillates around its mean value. The higher the variance, the more likely you are to move significantly in any direction. As most retail investors are equity investors and therefore only have long positions, we will focus more on downside risk than on upside risk (earnings) as we want as much variance as possible if the bottom line is above zero return.
Focusing on downside risk leads to a concept called semivariance, which focuses solely on returns below a certain threshold - often zero - and describes downside risk. The problem with this approach is that the underlying assumption is the typical distribution of negative returns. We know that the financial markets and stocks have a fat tail, meaning we are seeing far more significant moves (both gains and losses) than the normal distribution would indicate. This means that the semivariance will underestimate the true risk due to the asymmetry of the returns.
These observations have led to the formulation of concepts such as Contingent Value at Risk (Value at Risk). conditional value-at-risk), which is a fancy term for calculating the average return from e.g. 1% or 5% worst returns. This measure has many great statistical properties, one of which is that it is less sensitive to the assumptions underlying the return distribution.
To some extent, a related concept that is easier to understand is maximum portfolio decline. maximumdrawdown), which is defined as the decrease from the maximum value of the portfolio to the lowest value over the entire investment period. Due to the profit and loss asymmetry, traders focus heavily on this indicator and seek to minimize losses to avoid large drops in portfolio value or large losses over a single period (daily, weekly, monthly).
How can a typical investor minimize the risk?
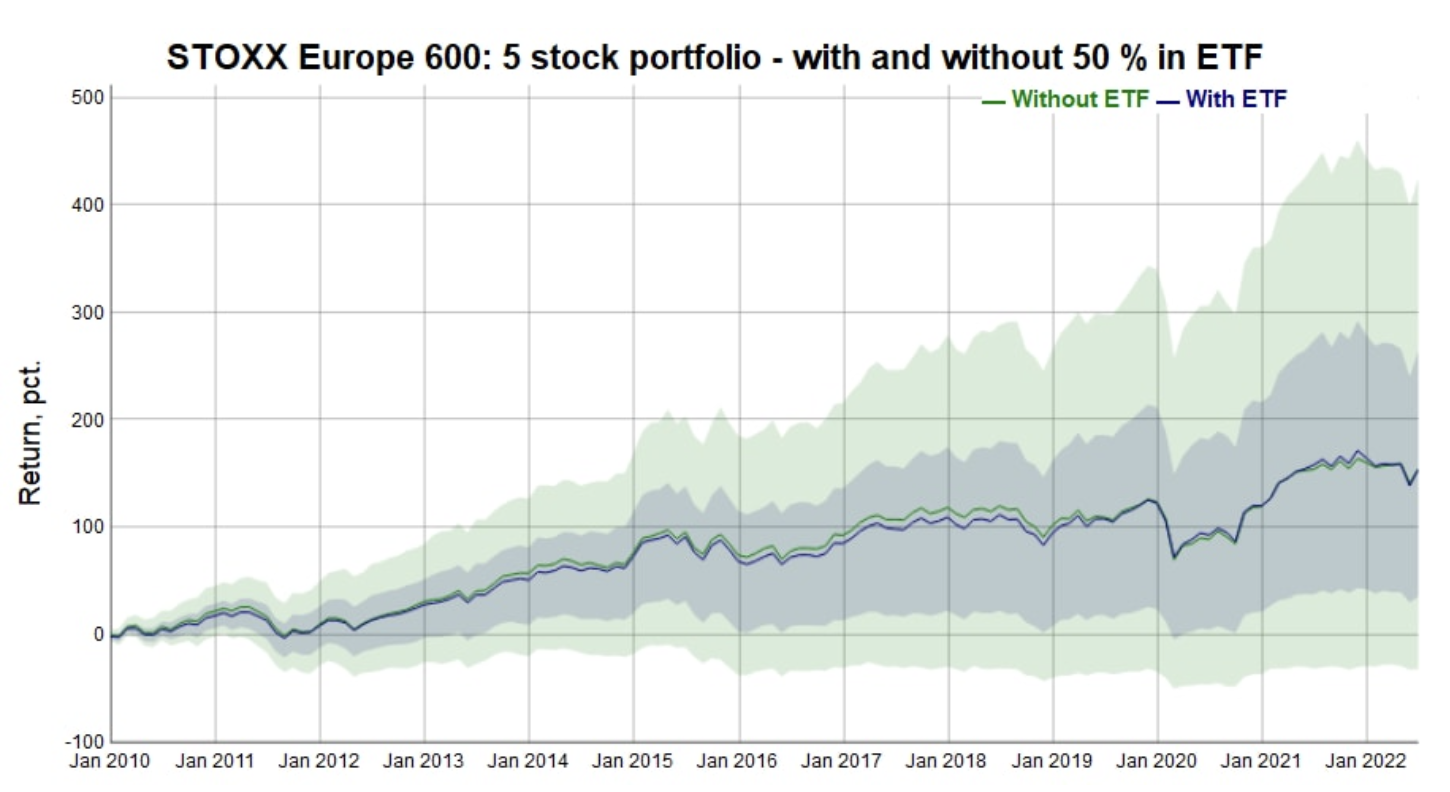
The typical investor has limited capital, often with a portfolio of only 3-5 companies as a minimum commission would otherwise equate to a high transaction cost. The first chart shows the return on a portfolio of 5 European stocks, to which 2010 stocks were randomly selected in January 1 and not interfered with thereafter. If any of the shares were de-traded or bought, they were replaced by an appropriate cash weight. This operation was performed 000 times to find out the intrinsic variance of the performance of these types of portfolios.
Over the 12,5 year period under review, a significant proportion of the sample of 1 portfolios showed a negative return, which is remarkable in itself, while the number of portfolios that achieved an exceptionally high overall return was also surprisingly high. In other words, a 000-company portfolio is a lottery ticket with extreme variance in outcome. The blue line and area show the median of the total return path and its variance if the 5 stocks randomly selected are mixed 5/50 with the monitoring fund STOXX 600 index. It is immediately apparent that the median of the expected return does not change, while the overall risk (both gains and losses) is significantly reduced. The Sharpe Index, which measures the annual return against the annual volatility, improves by an average of 20% by adding a stock market component. Most retail investors can therefore drastically improve their risk-adjusted returns by adding an ETF that monitors the entire equity market, without compromising the expected return.
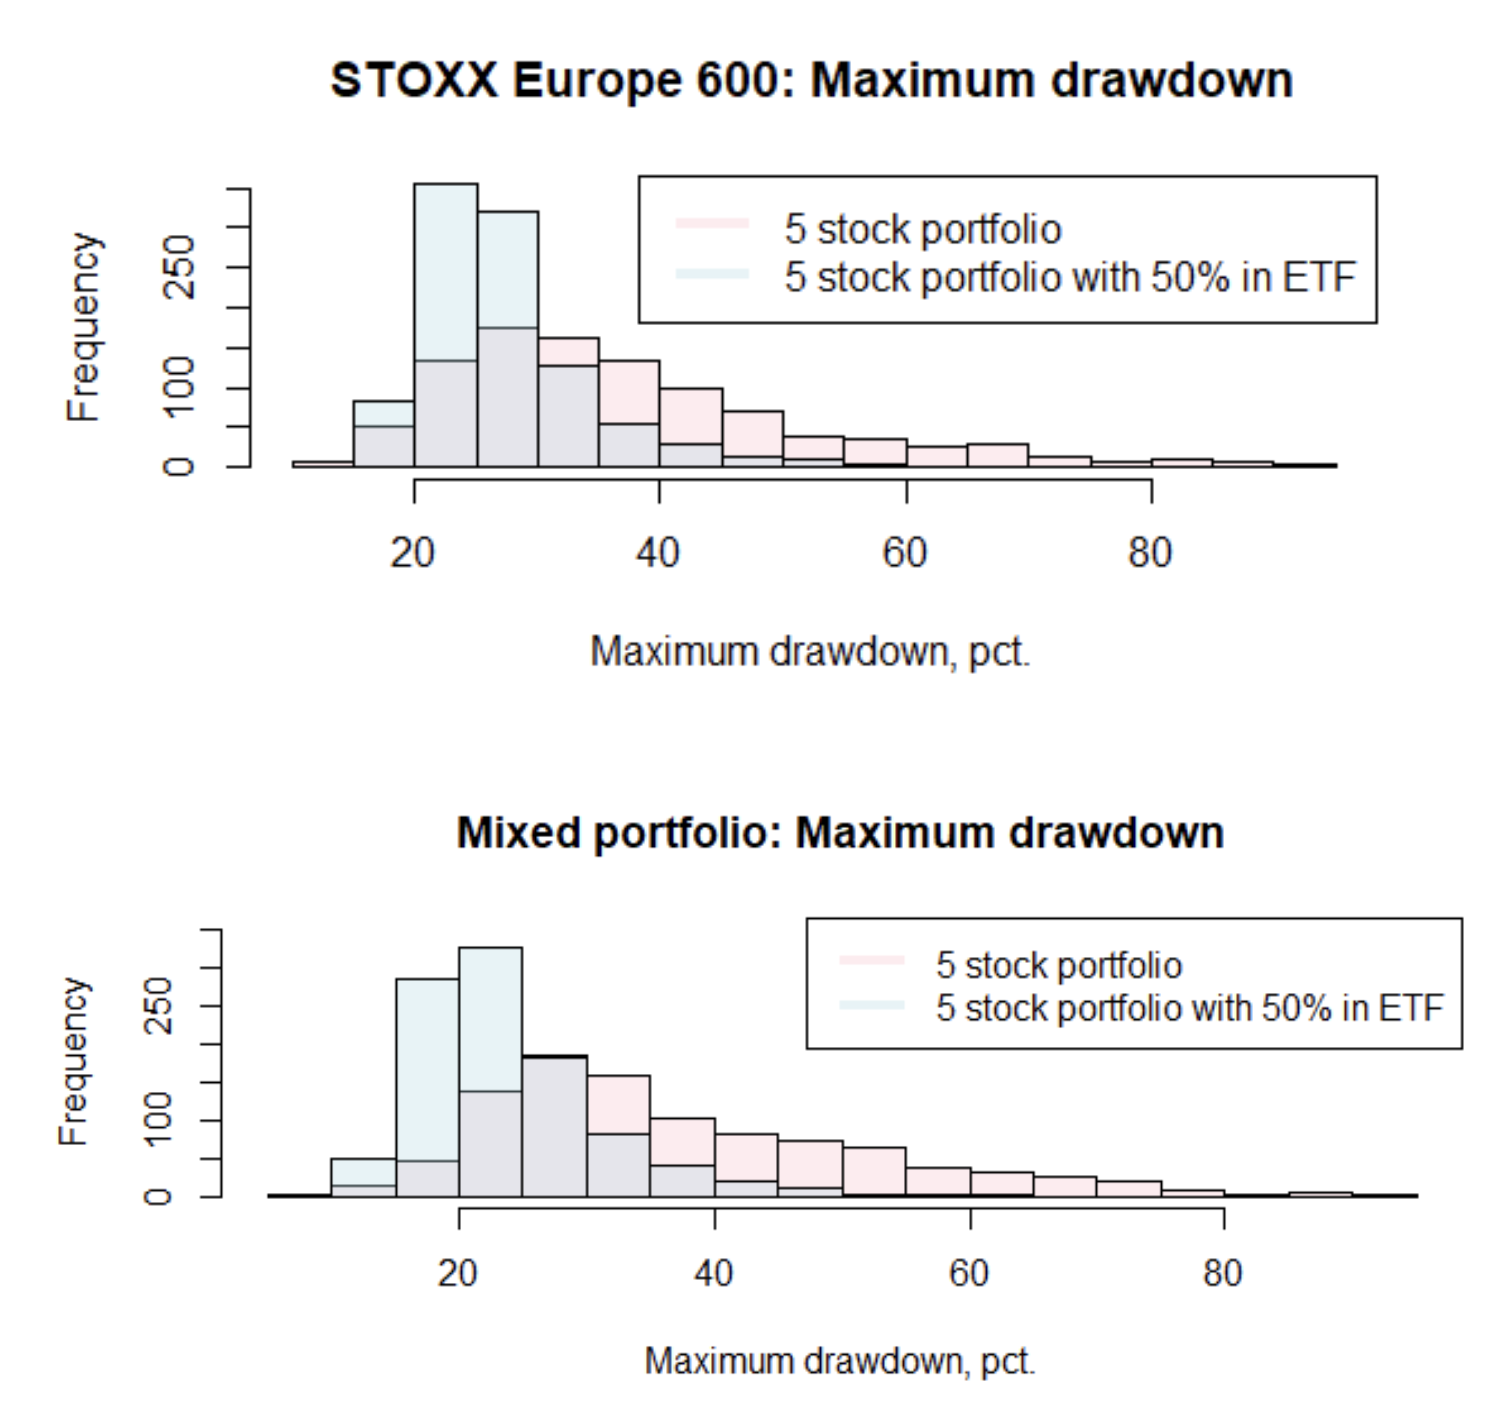
If we turn to the concept of the maximum decline in the portfolio value, in the first chart we can see how the maximum decline is reduced by adding the stock market component to a portfolio containing shares of 5 companies. Any investor with a small, concentrated portfolio of shares should definitely adopt a model that still contains the aforementioned shares of 5 companies, but reduced to 50% of the portfolio value, and invest the released funds in an ETF that monitors the broadly understood equity market.
If an investor is willing to lower his expectations of long-term return, an ETF that follows the stock market can be replaced with an ETF that offers a balanced basket of many different asset classes, including government bonds, corporate bonds and various types of equities. An example is the Xtrackers Portfolio UCITS ETF, but should not be taken as a recommendation, but one among many examples of a diversified asset allocation. As we can see in the second chart, the expected distribution of the maximum portfolio declines after a 5-company merger with an ETF that monitors multiple asset classes is better compared to the equity-only solution. The risk-adjusted return is 43% higher than a simple 5-company portfolio.
With stocks rebounding in July and so far also rising in August, retail investors have a unique opportunity to strengthen their portfolios in the event of another stock market crash. In our view, inflation growth will continue to be higher than expected and financial conditions will continue to tighten, which will make equity investments even more difficult. At the same time, it accelerates the deglobalization process, creating unpredictable risk sources throughout the system.
Expectations need to be revised for inflation
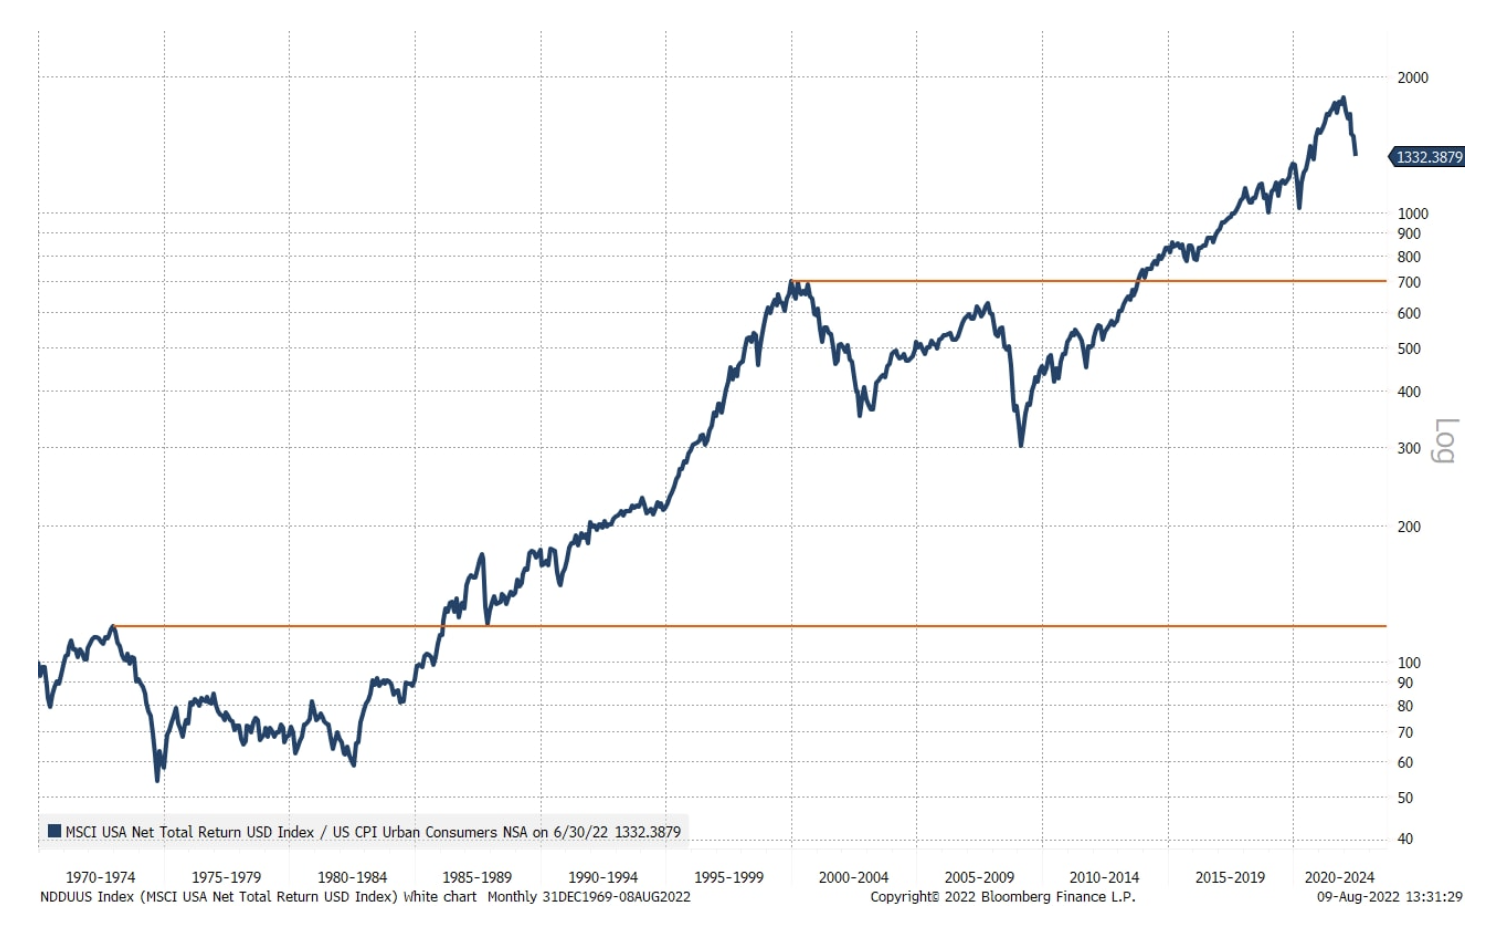
The classic approaches to minimizing equity risk mentioned above work well in a normal environment, but if we find ourselves in dire straits as a result of protracted inflation, as in the 70s, or a deflation in the valuation of tech and healthcare stocks, we may have deal with a longer period of negative real returns. In the history of the US stock market after 1969, there have been two periods in which it took 13 and 14 years to return to the new high in real terms, respectively.
The subject of our latest quarterly forecast is the material world and we assume that fixed assets will continue to be valued higher than intangible assets; if we are right, investors should consider investing in commodities to counterbalance the risk to real wealth associated with inflation.


Leave a Response