


The labor market in the US - still too strong. What will the Fed do?

The past week has been very exciting and not only on capital markets (Poland finally, after 36 years, made it out of the group at the World Cup). On the other hand, the two most price-driven events on the financial markets are (i) the speech of the head of the US central bank, J. Powell (S&P500 +3,1%), and (ii) the US employment report (S&P500 -2% immediately after the data release). Let's not forget about falling inflation in Europe and Poland and weak macro data (such as PMI indices).
Jerome Powell's speech at the Brookings Institution can be considered his most important speech this year because the boss Of the Fed in an almost analytical way, he presented how he intends to fight inflation (it is even a "signpost" for investors for 2023). The speech was widely interpreted as dovish (easy to say since the S&P500 was up more than 3% on that day), but in my opinion it was hawkish and Powell (as in July/August this year, when we had a similar "wrong" reaction of the market his press conference) can correct the market reaction at the first opportunity (FED meeting on December 13-14 this year). In my opinion, a more accurate summary of the market reaction would be that the market ignored Powell's hawkish statement.
S&P500 and WIG above the 200-day average
Last week S & P500 index increased by 1,13% (it rose the most on Wednesday immediately after Powell's speech) and is now 13,8% above the low of the bear market and only 15,1% below the peak of the last bull market. Friday's gains during the session (after a sharp decline immediately after the publication of the employment report) fit in with the current "willingness" of the market for further increases. It is possible that the real test of the current growth will take place next year (and December will traditionally be a positive month for equities).
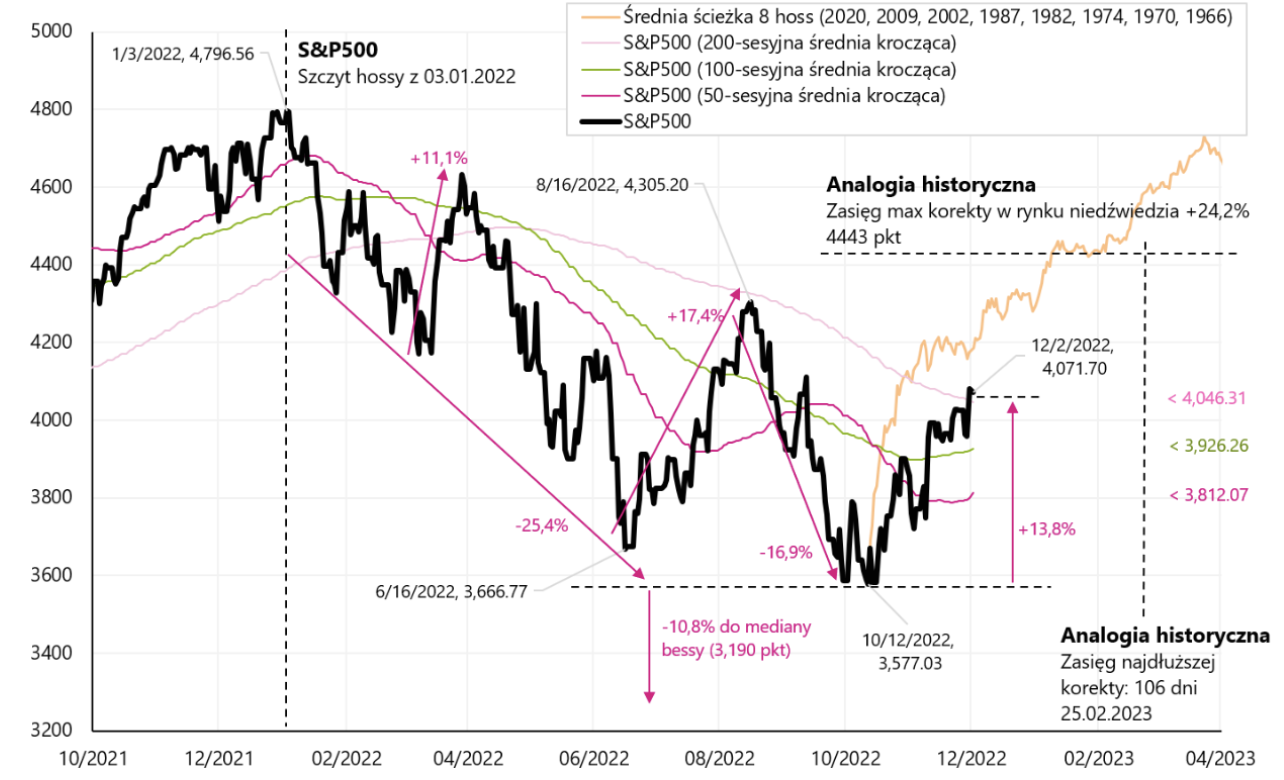
Indeks S & P500 until December 02.12.2022, XNUMX. Source: own study, stooq.pl
The 13,8% increase in the S&P500 from the low is still less than similar increases in July/August this year. (then the index increased by 17,4%), but now the S&P500 has broken up the 200-day average and you could immediately read the comments that this is a signal of the end of the bear market - it has happened many times in the past. So let's check the data. The next charts show the S&P500 during declines in 2008-2009 and 2000-2002. Indeed, in 2008 and 2009, the 200-session average provided strong resistance throughout the bear market, and its breakout in June 2009 only confirmed its end.
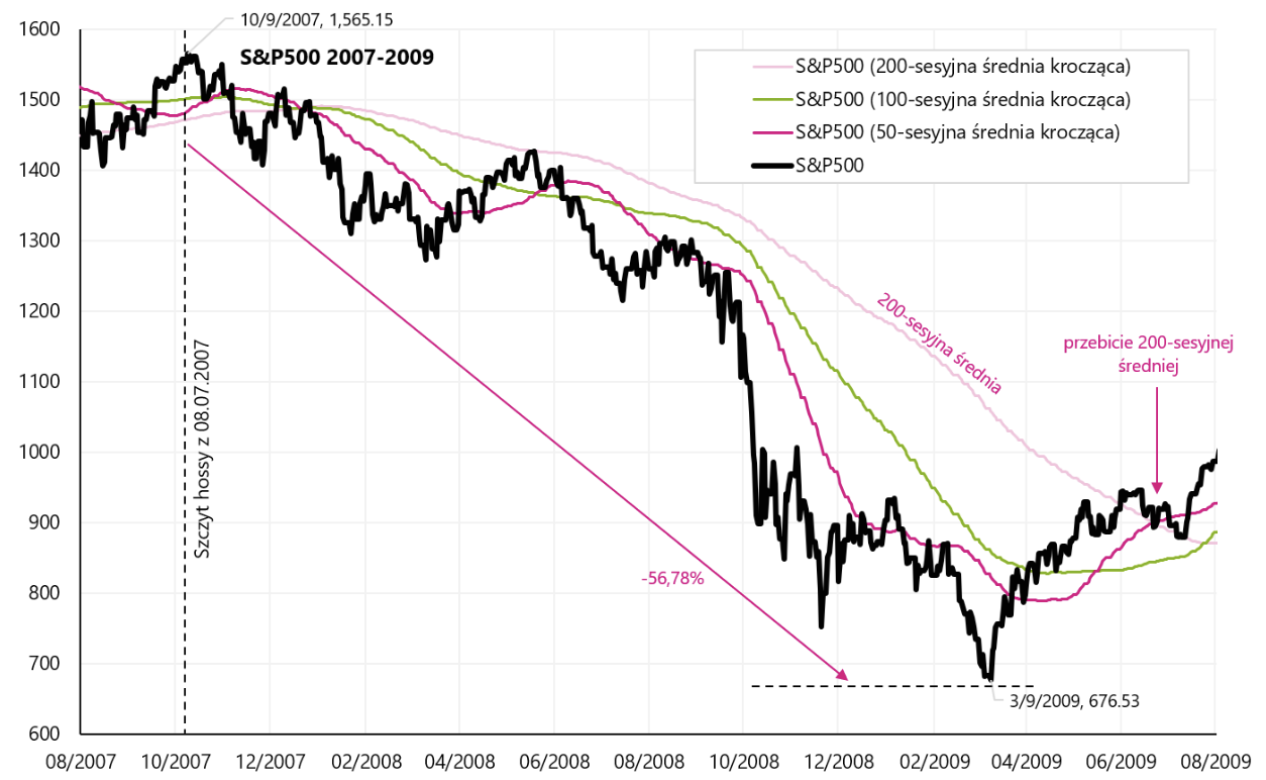
Indeks S & P500 in years 2007-2009. Source: own study, stooq.pl
During the declines in 2000-2002, the index moved "closer" to the 200-day average, giving the wrong signal in the first quarter of 2002. This bear market was the longest after World War II and lasted over 2,5 years (hence the index could naturally approach the 200-session average more often). It may be similar today because (due to a sharp spike in inflation) the stock market cycle was far ahead of the economic cycle (it was similar in 2000, when the S&P 500 peaked 12 months before the beginning of the recession). The strong labor market in the US suggests that the recession is moving in time, and the decline in the stock market has been going on for 11 months. Therefore, I would be careful with the interpretation that the current break of the 200-day average may herald the end of the bear market.
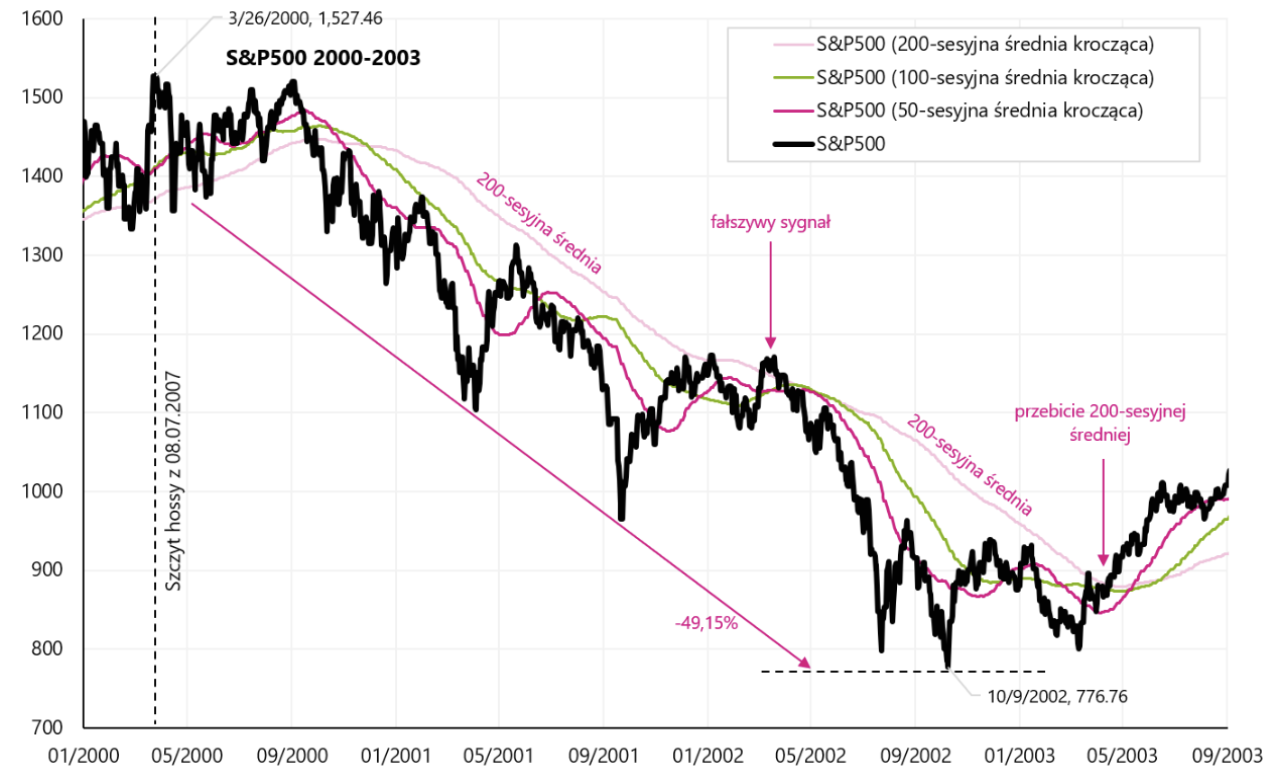
Indeks S & P500 in years 2000-2003. Source: own study, stooq.pl
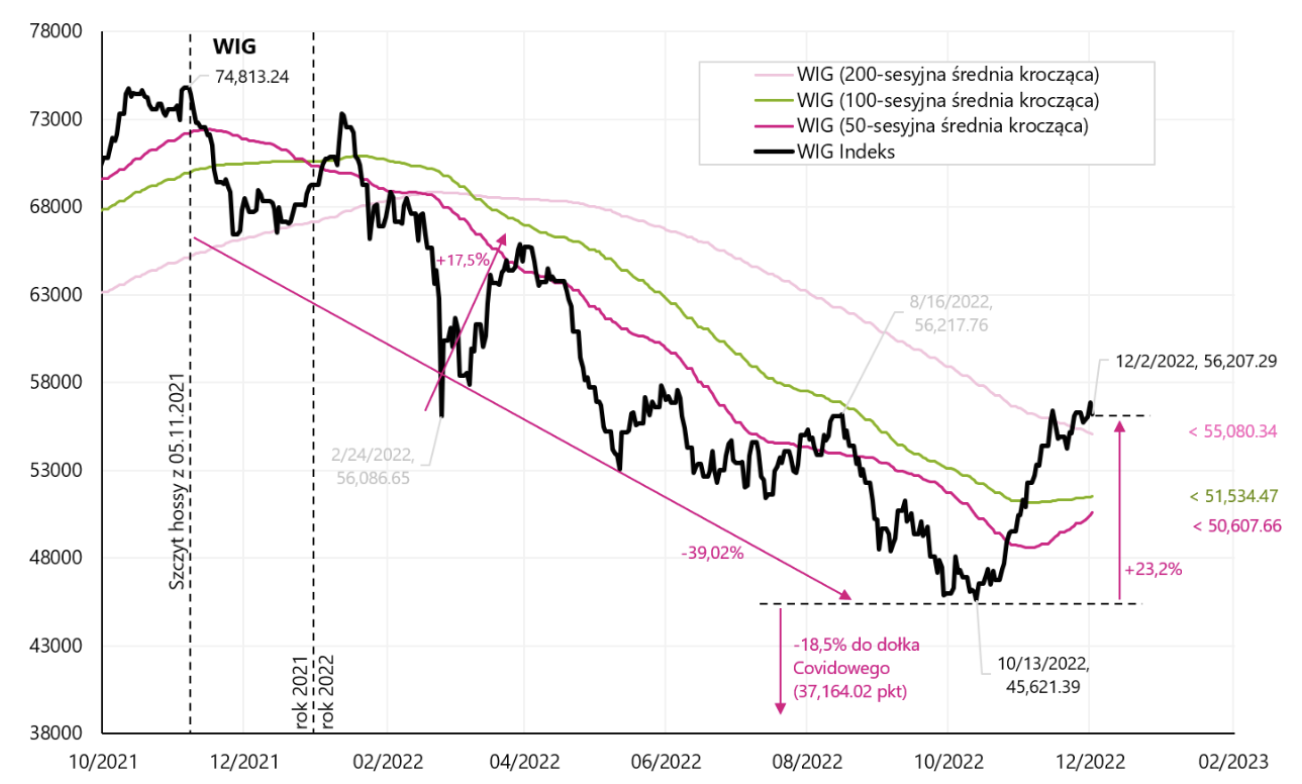
The WIG ended the week on a symbolic minus (-0,13%) and is now +23,2% above the bearish low of October 13.10.2022, 500. and like the S&P200 above the XNUMX-day moving average. The chart below shows the details.
Indeks WEDGE until December 02.12.2022, XNUMX. Source: own study, stooq.pl
Historically, the breaking of the WIG during the bear market of the 200-session average marked the end of the bear market in both 2009 and 2002. The next two graphs show those situations. I would treat today's break above the 200-session average as a "return to the average" after previous strong declines and as a testimony to the strength of the current global "risk-on". Nevertheless, I would assume that the S&P500 index will determine the bottom of the bear market in the first place.
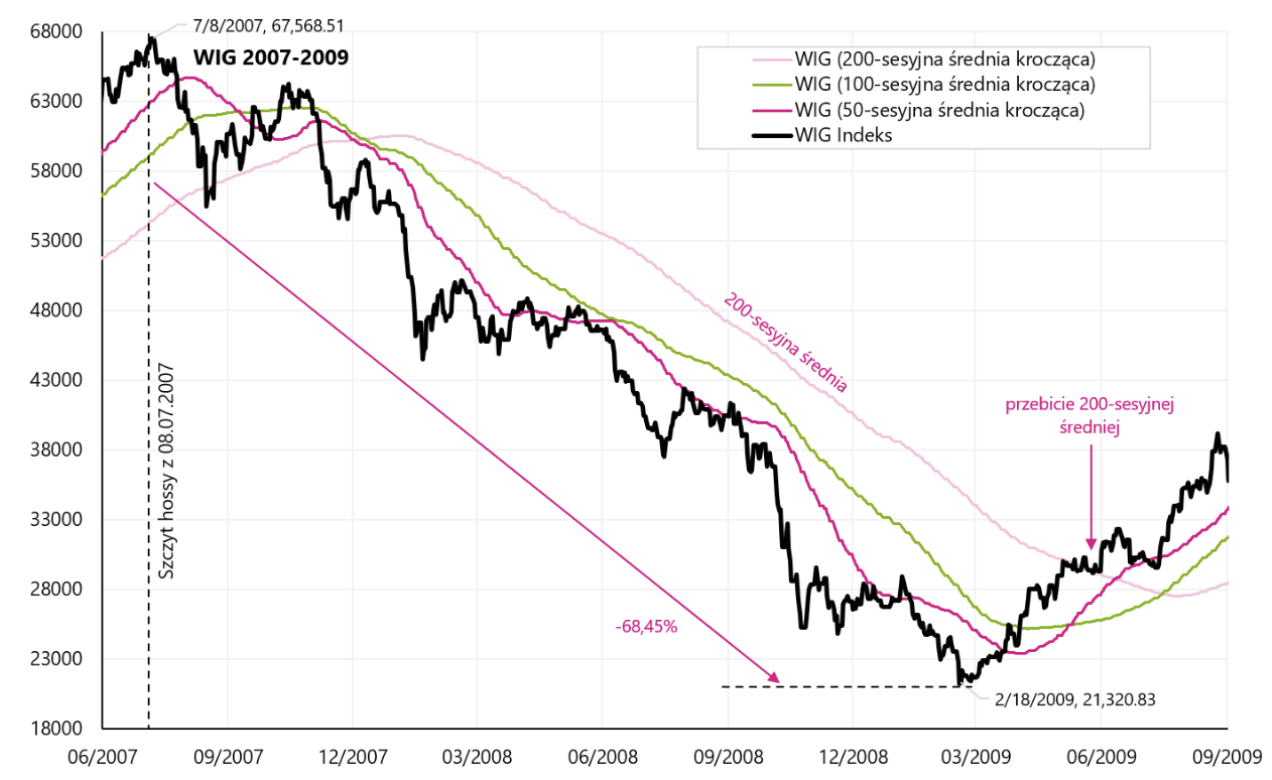
Indeks WEDGE in years 2007-2009. Source: own study, stooq.pl
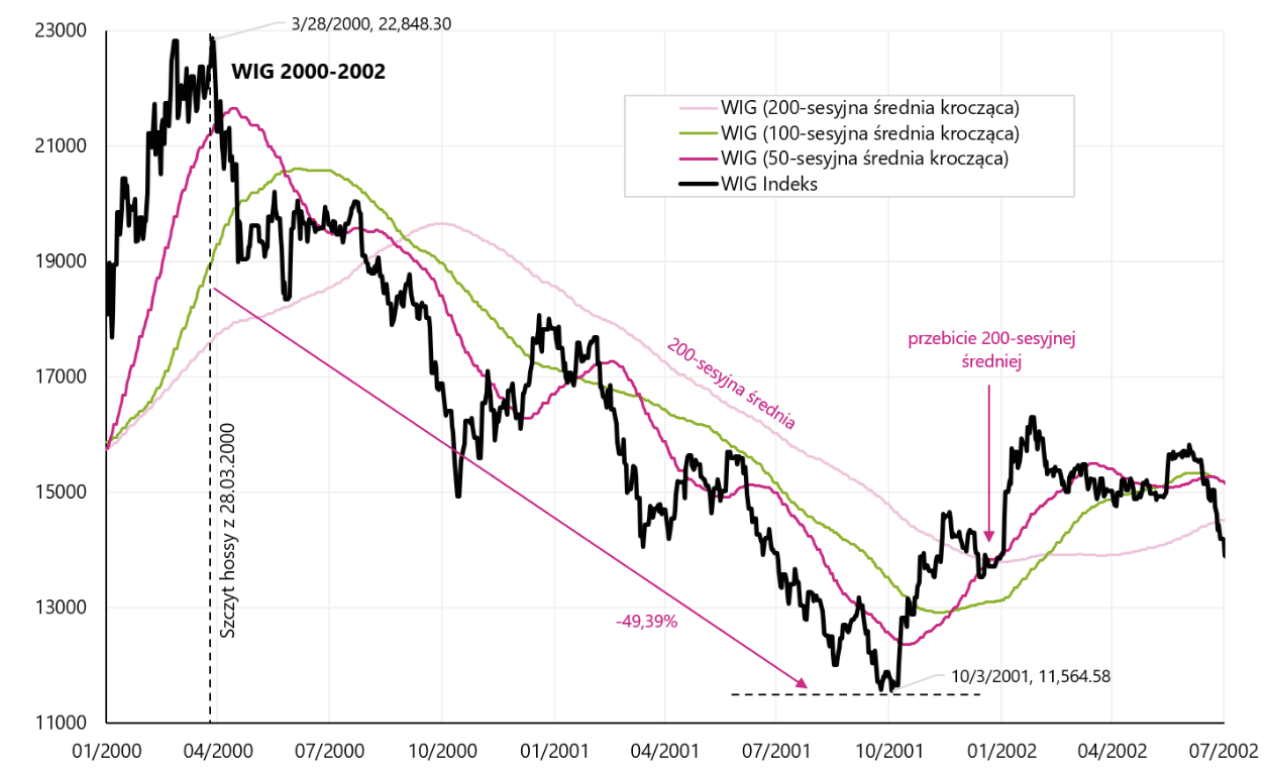
Indeks WEDGE in years 2000-2002. Source: own study, stooq.pl
How Powell intends to fight inflation
Powell's speech at the "Brookings Institution" on November 30 this year. it was by no means dovish and in my opinion is in line with the recent (hawkish) statements of other FOMC members. The market wanted to increase (for many technical reasons) and found a good excuse, e.g. in this sentence by Powell: “it makes sense to moderate the pace of our rate increases as we approach the level of restraint that will be sufficient to bring inflation down. The time for moderating the pace of rate increases may come as soon as the December meeting.”
But this sentence is taken out of context. OK, 50 bps (bps) rate hike in December instead of 75 bps – the market could go strong. But Powell then added: "the timing of that moderation is far less significant than the questions of how much further we will need to raise rates to control inflation, and the length of time it will be necessary to hold policy at a restrictive level."
So not the rate of increases but (i) the level where rates will reach and (ii) how long they will stay there are the most important. And this is consistent with, for example, recent statements by J. Bullard, another member FOMC, which indicates a suitably restrictive one interest rates between 5% and 7%.
The market only needed a confirmation that there will be no 75 bps rate hike at the next FOMC meeting. Finally, Powell added: “It is likely that restoring price stability will require holding policy at a restrictive level for some time. History cautions strongly against prematurely loosening policy. We will stay the course until the job is done.”
Since, in my opinion, this is one of Powell's most important speeches this year, and at the same time it is a kind of signpost for investors for 2023 (in terms of likely actions of the Fed), so let's explain exactly what Powell really wanted to convey:
- Inflation is too high and we will continue to fight it,
- Neither the forecasts of rapidly falling inflation (to some extent incorrect, because the forecasts suggested a decline in inflation a long time ago, and this has not happened yet), nor its recent declines are sufficient,
- Much more hard data is needed to conclude that inflation is actually falling (only then pivot?),
- Despite slower economic growth and recent interest rate increases, there is still no clear progress in the fight against inflation,
- The FED mainly looks at core inflation, which can be broken down into 3 parts: core housing services inflation, core goods inflation, and core services other then housing inflation,
- Core commodity inflation is in a downward trend and will probably continue to fall,
- Core housing inflation will continue to grow for many months, but market indices of current rents (such as Zillow, CoreLogic, RealPage or ApartmentList) are already falling sharply today, so housing core inflation may also fall in the medium term (here there is traditionally a large time shift – in other words, for now, core housing inflation is not a problem for the Fed),
- But the most important (to fight inflation) is the core inflation of services other than housing, which accounts for about 50% of the core PCE inflation basket (FED formally looks at PCE inflation, not CPI). Powell stated "This is the largest of our three categories, constituting more than half of the core PCE index. Thus, this may be the most important category for understanding the future evolution of core inflation. Because wages make up the largest cost in delivering these services, the labor market holds the key to understanding inflation in this category”,
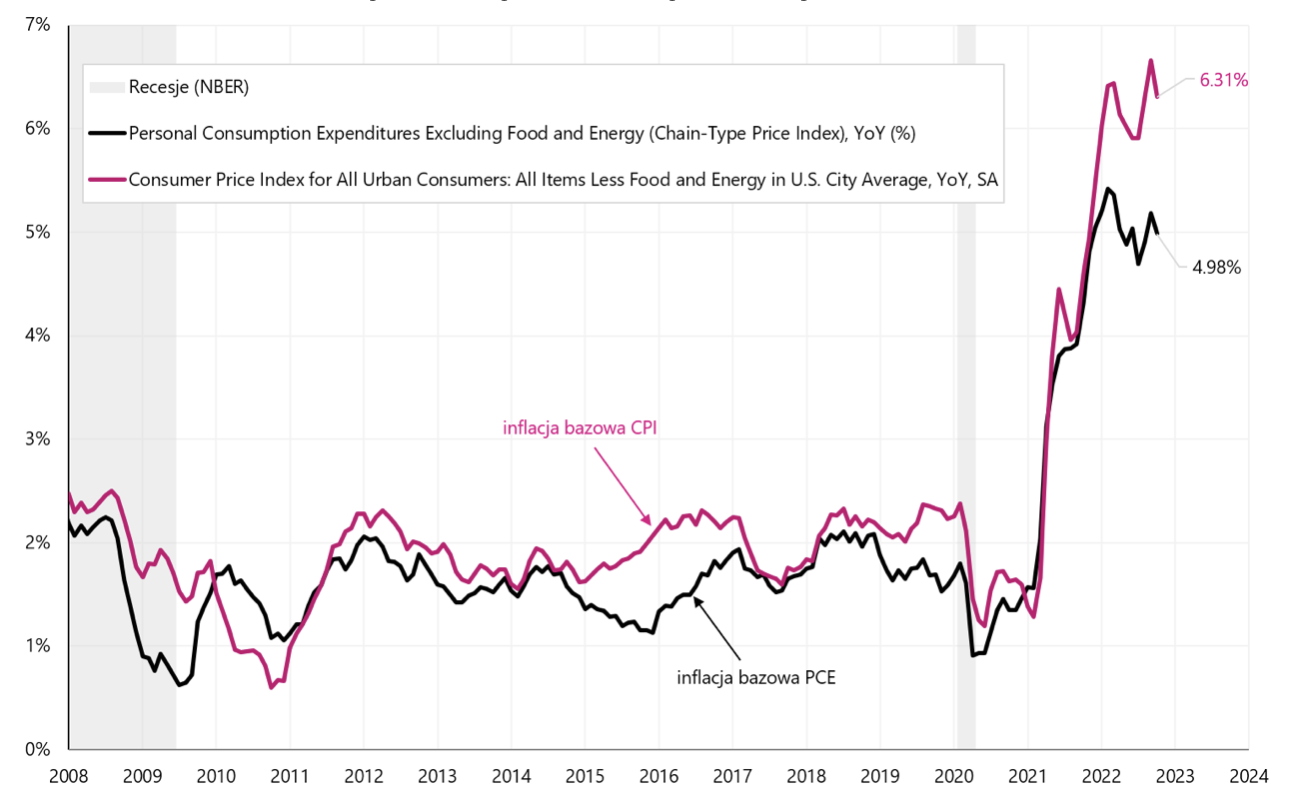
Annual change in core CPI inflation and core PCE inflation in 2008-2022. Source: own study, FRED
- So the labor market is "the most important in the fight against inflation", and the labor market after the pandemic lacks about 3 to 3,5 million people (in other words, this is the imbalance between demand and supply on the labor market, the restoration of which would be consistent with the 2% inflation), and this situation affects the increase in wages,
- Since it is rather unlikely that these people will return to the labor market, the main way to restore the balance is to reduce the demand for labor by these 3-3,5 million people - which should be achieved by slowing economic growth and, at the same time, higher interest rates,
- Only that today the number of unemployed is only 6,01 million people (the unemployment rate is 3,65%), if theoretically the number of unemployed were to increase by 3,5 million, the unemployment rate would increase to about 5,78%,
- And the market is unlikely to be ready for such a scenario,
- Of course, such an increase in unemployment is only a general illustration of the problem, and in reality it is a decrease in labor demand by 3 to 3,5 million people, which could also be at the expense of a decrease in job openings, i.e. jobs not yet filled by new employees, but to which places companies are actively recruiting, or some employees leave the labor force, and then such people are no longer included in the calculation of the unemployment rate,
- Why are there no "chances" for these 3 to 3,5 million people to return to the market? Because of a few reasons…
- First, about 280 to 680k people will not return to the labor market because of the so-called symptoms of "long Covid" (long-term health effects that do not allow you to return to the labor market),
- Secondly over 2 million missing people are the result of the so-called "excess retirements", i.e. earlier than normal retirement (the reasons include, among others, fear of contracting Covid; difficulties in re-entering the labor market of older people who lost their jobs at the beginning of the pandemic; but also large gains on the stock and real estate market in the first two years of the pandemic may have prompted some people to retire early),
- And thirdly, about 1 to 1,5 million people is the result of a slower growth of the working-age population. Here, the main reason is lower net immigration, as well as an increase in the number of deaths during the pandemic,
- Powell also noted the continued strong employment growth, which remains well above 100. jobs per month (an increase in jobs in the amount of about 100 per month makes it possible to manage the growth of the entire working-age population).
What does this mean for markets and future Fed monetary policy? Certainly, fighting inflation by cooling down the labor market remains a top priority for the Fed. Powell did not yet know the latest employment report for November this year, which could only further reinforce his fears of further wage growth and little progress in cooling the labor market. Higher interest rates, higher unemployment and a greater economic slowdown in 2023 - these may be direct costs of fighting inflation.
The labor market in the US - still too strong
US Labor Market Report for November this year. turned out to be too good for the markets, but only "for a while", as during the day the stocks were able to recover their initial losses. A strong labor market only confirmed Powell's thesis from Wednesday's speech that the imbalance in the labor market (lack of sufficient supply) puts pressure on the increase in wages, which are the main cost of core inflation services (exactly core inflation of services other than housing). The hourly wage rate increased in November by 0,55% month-on-month (only +0,3% was expected) and amounted to 5,1% year-on-year (only 4,6% was expected). Nevertheless, the labor market is slowing down, only much slower than the Fed would like. If the labor market does not significantly slow down in the coming months, the FED will be willing to raise rates even above 5,25%.
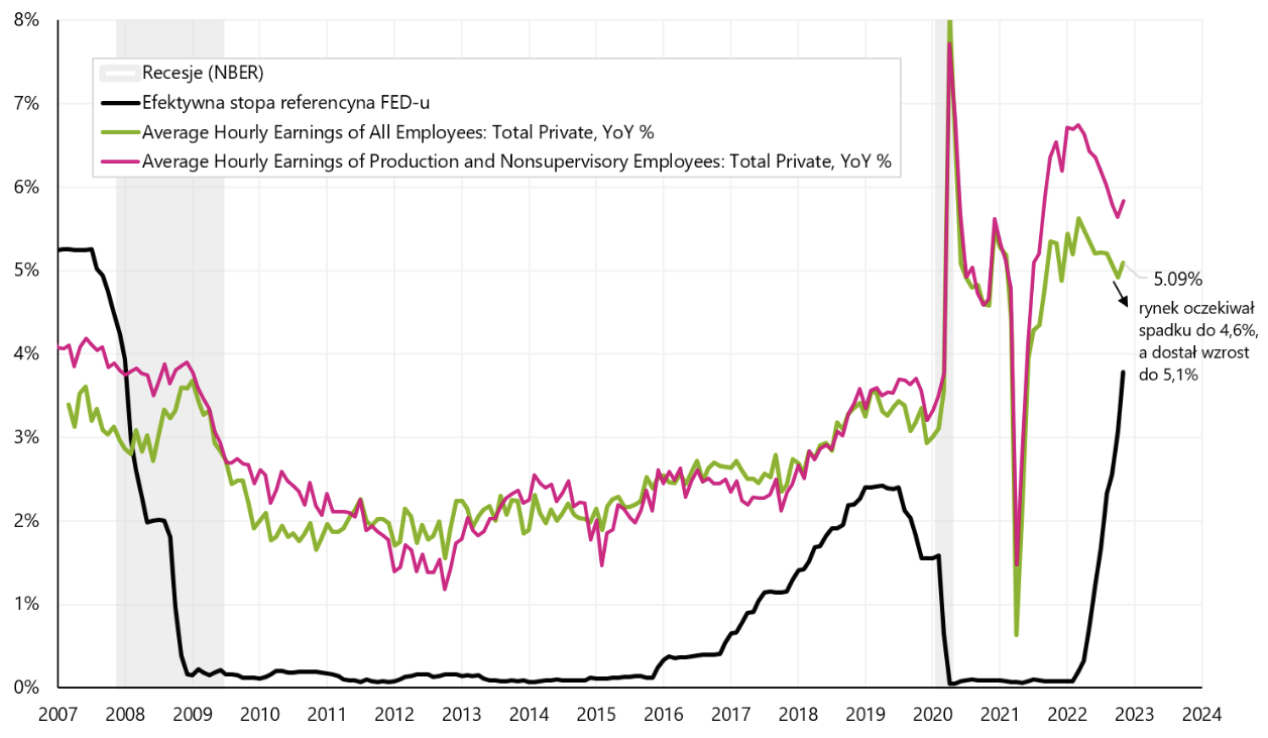
Annual change in the US hourly wage rate (two series), and the Fed's effective interest rate. Source: own study, FRED
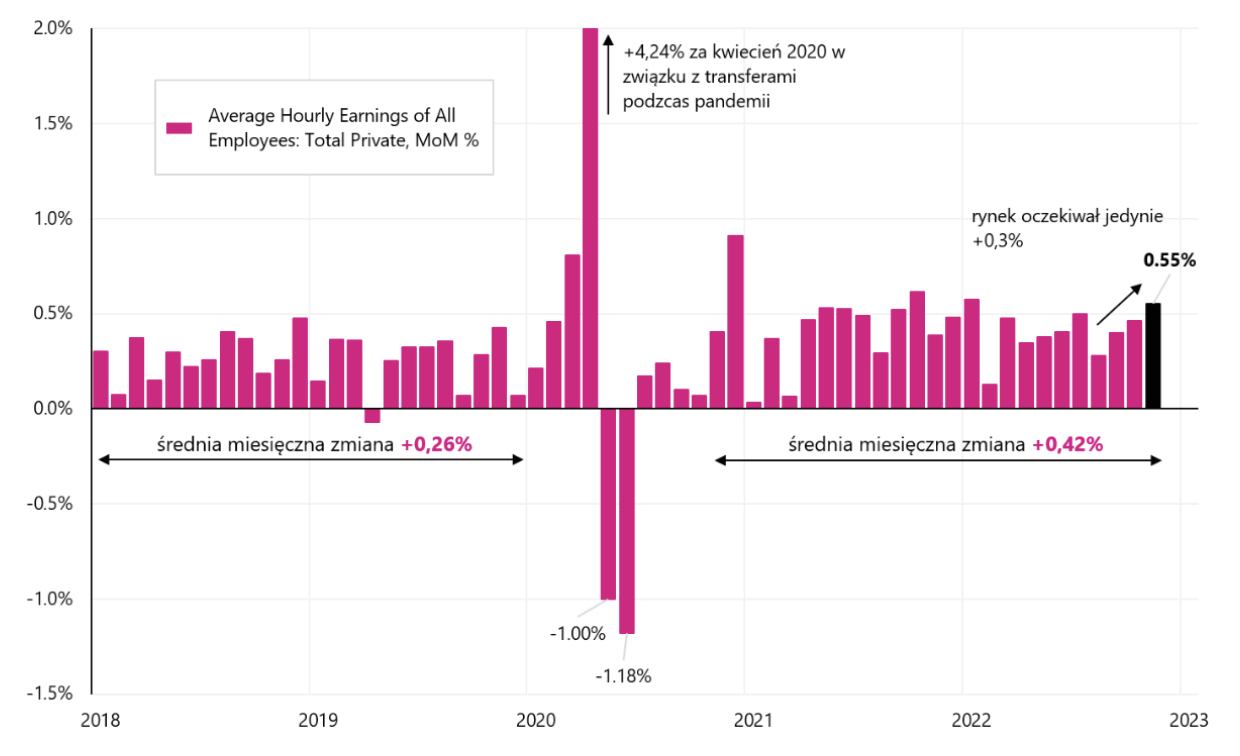
Monthly change in US hourly wage rate. Source: own study, FRED
It's not just rising wages that are problematic for the Fed. The slowdown is also not visible in the monthly increase in jobs (+263 in November, the market expected 200, and the 3-month average is as much as 272 per month). The unemployment rate is also not growing and in November it even fell to 3,65% from 3,68% in October. The number of unemployed fell by 48 in November. people, while the labor force decreased by 186. as a result, the participation rate decreased from 62,25% to 62,14% (the participation rate is calculated by dividing the number of unemployed by the number of people in the "labor force"; the lower the participation rate, the lower the labor supply - which is the main challenge for the FED- in the fight against inflation. We will also receive very similar signals from the data on initial claims, only that the latter are available in weekly (not monthly) intervals, hence their greater usefulness as leading data. In the week ending November 28 (released December 1), the number of jobless claims fell by 16. up to 225 (this is bad news for the Fed, although the trend is more important here than the one-week change). The chart below shows the details.
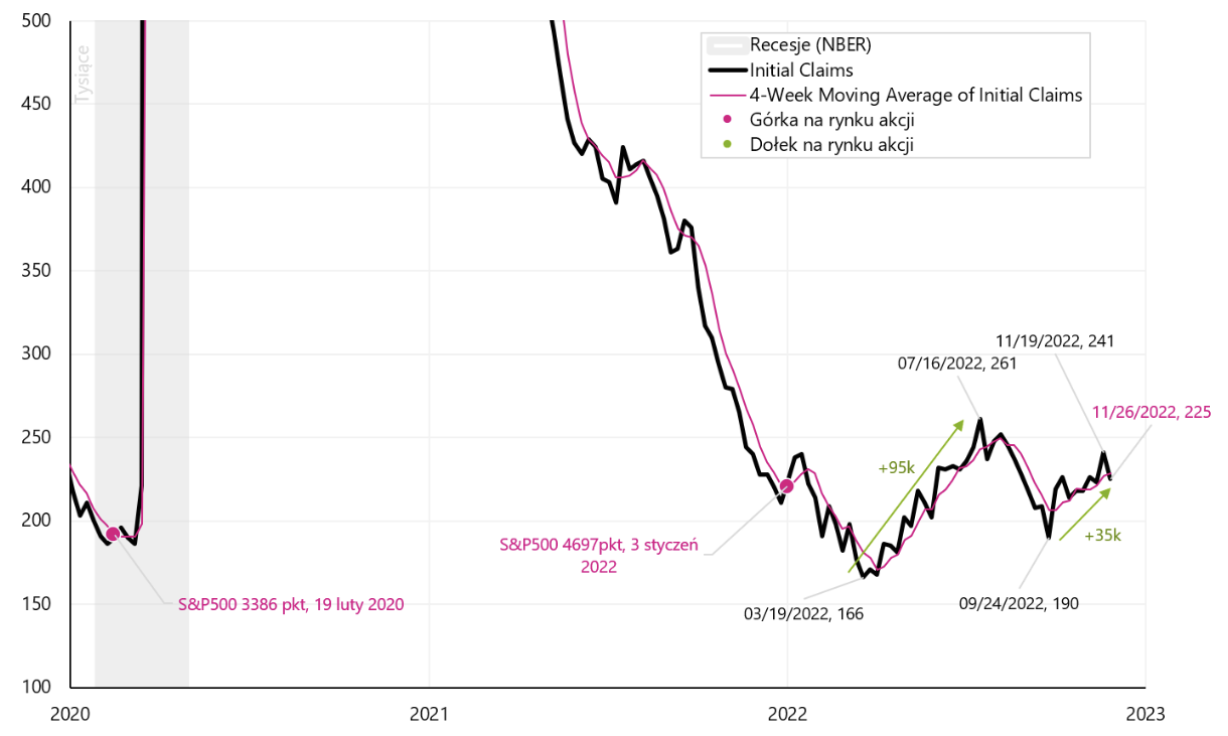
First-time unemployment benefits in the USA in 2000-2022. Source: own study, FRED
In the previous weekly report we analyzed Initial Claims in detail, so we know that historically we have had 7 cycles of increasing benefits (related to recessions, at the same time we omit the case of 2020, which is too specific). If we hook the low from each of the previous cycles into the low of the current cycle (on March 19, XNUMX), we can present it on the next chart.
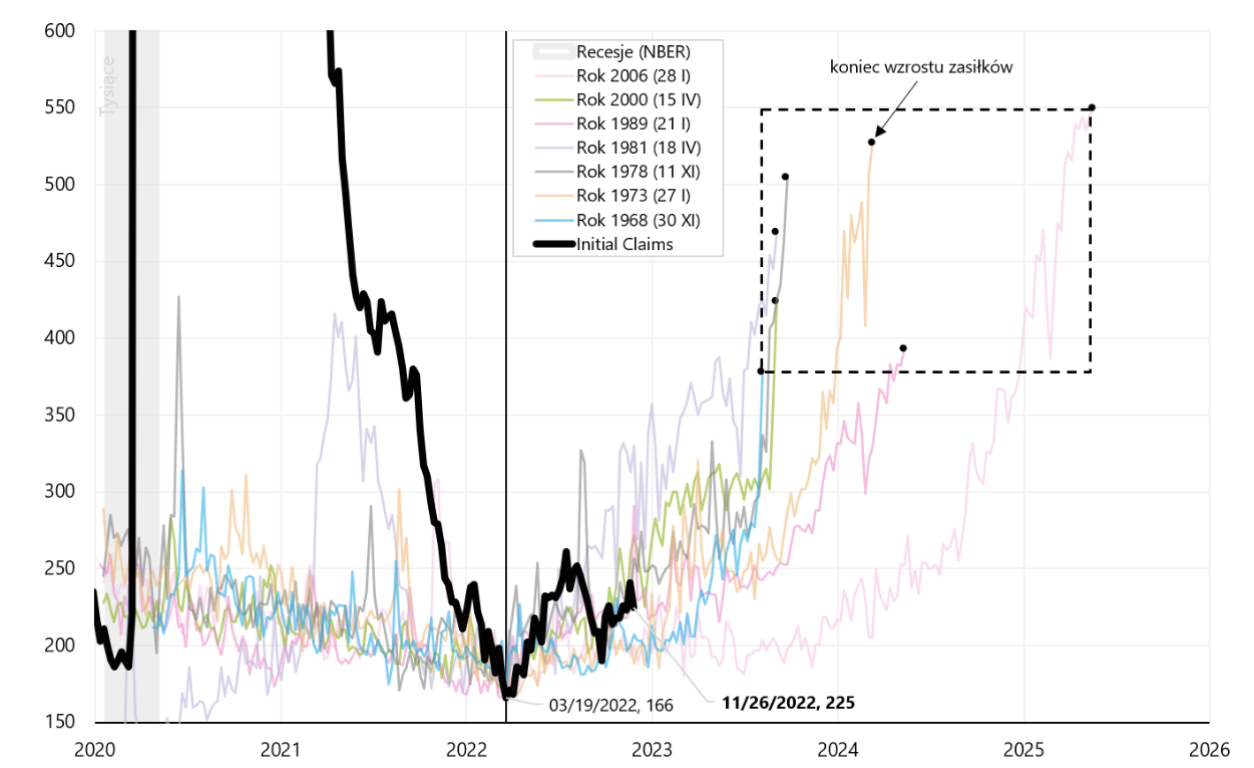
First-time unemployment benefits in the US, 2000-2022, with previous cycles of increases in the number of benefits marked. Source: own study, FRED
The black square with the dashed line shows the extent to which unemployment benefits have historically increased (compared to today's benefit levels). Historically, an increase in first-time unemployment benefits has generally been associated with a bear market in the S&P500 index. The next chart shows how long (historically) the bear market in the stock market lasted during unemployment cycles.
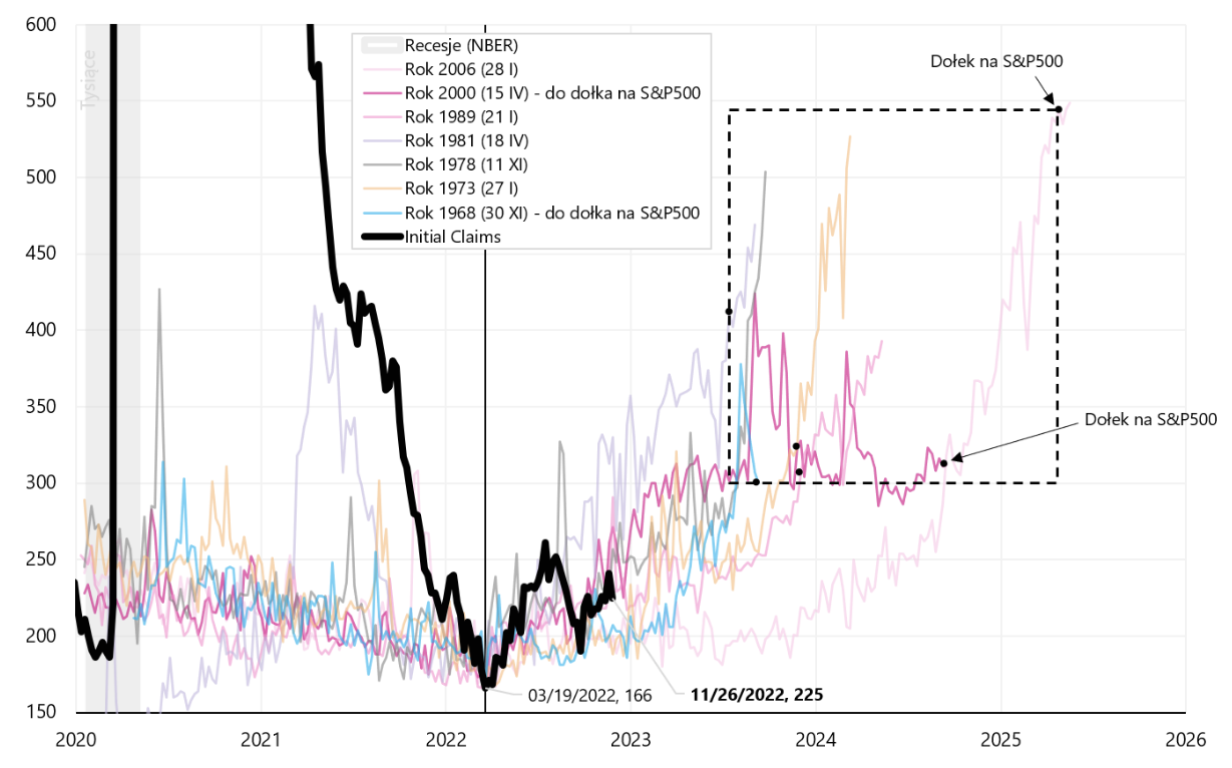
First-time unemployment benefits in the US in the years 2000-2022, with previous cycles of increases in the number of benefits and the lows of the S&P500 index in each of these cycles. Source: own study, FRED
In the next graph, we plot both squares showing the historical ranges of the cycles of rising benefits and then falling stock prices. Historically, stocks have preceded the cycle of rising unemployment by marking downtrends both in terms of time (X-axis) and the size of the increase in benefits (Y-axis). The bear market of 2008-2009 is a clear exception here (aS&P500 low and a high in the number of benefits occurred simultaneously very late in the cycle - this is the upper right corner of both squares).
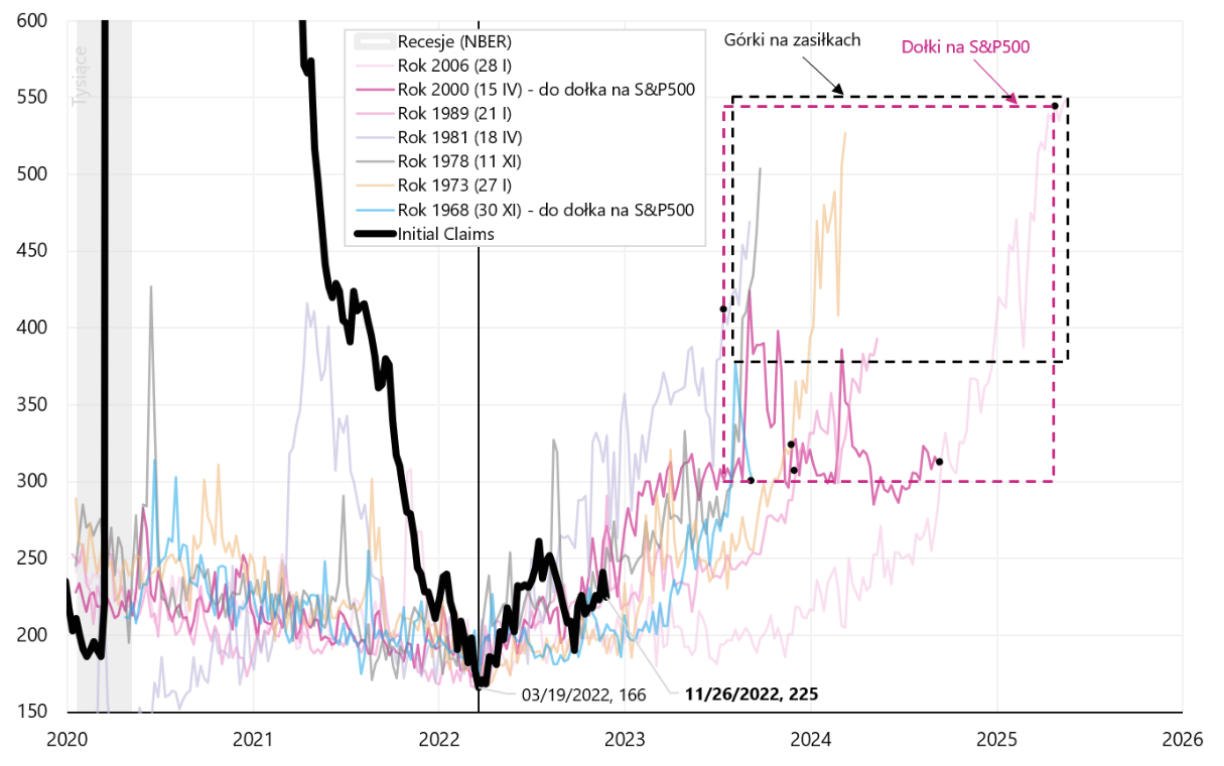
First-time unemployment benefits in the US in the years 2000-2022 with previous cycles of increases in the number of benefits and S&P500 index lows and highs in the number of benefits in each cycle. Source: own study, FRED
What conclusions can be drawn from the above analysis in terms of today's cycle? If the historical analogy were to repeat itself, assuming that we are now at the beginning of the increase in the number of benefits (and this is quite likely given the determination of the Fed to cool the labor market by further raising interest rates), there is still a lot of room and time to set low by the S&P500 in the current cycle. First, unemployment benefits should increase from today's level of 225. to the range of at least 300-350 thousand, for which we still need 6 to 12 months of time.
A short comparison of inflation in Poland, the Eurozone and the USA
We got the preliminary readings last week inflation in Poland and Europe. Practically in most countries we had positive surprises with falling inflation. In Poland, inflation fell from 17,9% to 17,4% mainly due to energy prices (annual inflation rate fell by 0,5pp, which roughly consists of food +0,1pp; energy -0,8pp; core inflation +0,2pp ). In the euro area, inflation also fell, mainly due to energy prices, from 10,6% to 10,0%. The chart below shows the contribution to the annual change in inflation in the Eurozone. For October this year (latest data available) the impact of energy prices on overall inflation was 4,44 percentage points (from 10,62%) and it accounted for as much as 42% of the entire annual change in inflation.
Inflation in the Eurozone, annual change and changes' contributions. Source: own study, Eurostat
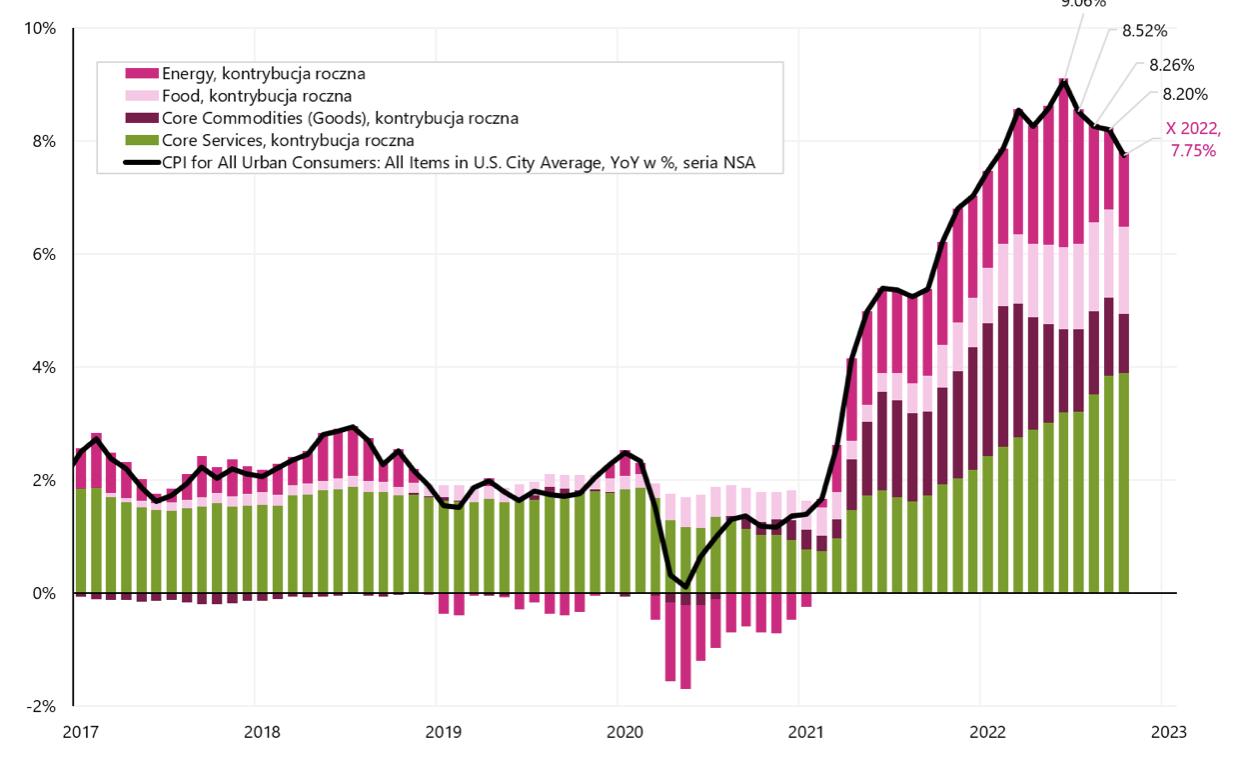
The next chart shows the contribution to the annual change in inflation in Usa. For October this year the impact of energy prices on overall inflation was 1,3 percentage points (from 7,75%) and it accounted for only 17% of the entire annual change in inflation.
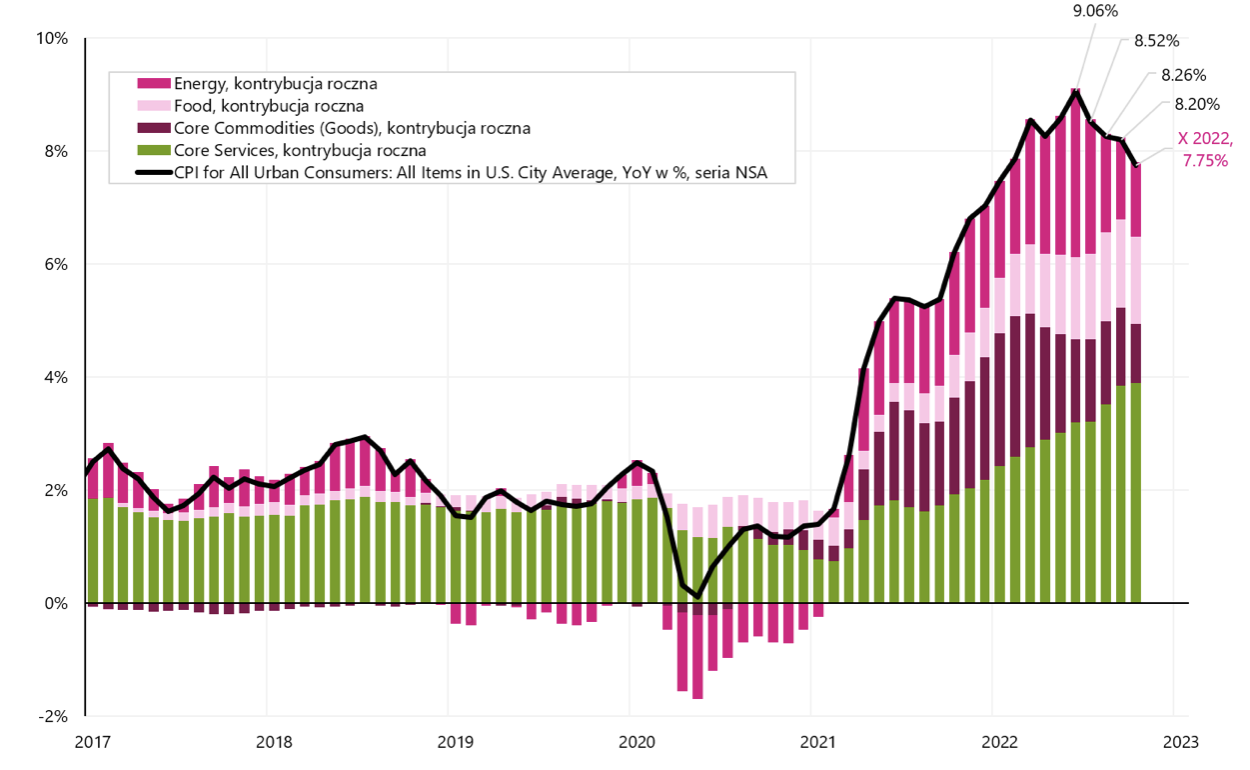
US inflation, annual change and change contributions. Source: own study, FRED
In Europe, the main problem is energy prices, and the impact of core inflation on the annual change in inflation is only 32,4%. In the US, the main problem is core inflation, which accounts for as much as 63,9% of the annual change in inflation. Under normal circumstances, the US would have a bigger problem with inflation (because there were greater fiscal stimulus during the pandemic and inflation is more rooted in the base part of the basket). In Europe, however, the inability to quickly replace Russian energy supplies with supplies from other producers has resulted in high increases in energy prices, which have the greatest impact on the level of current inflation in Europe. But on the other hand, inflation has the right to fall faster in Europe, once the issue of energy supplies is resolved.
Summation
The past week has provided us with a lot of interesting data in terms of forecasting the markets in 2023 – even though stock indices changed little throughout the week.
Powell's speech at the Brookings Institution shed light on the FED's determination to fight inflation, but also showed how important the slowdown in the labor market will be for the FED, which should translate into slower wage growth and ultimately lower core services inflation. Due to the effects of the pandemic, the labor market has the right to remain strong for longer than usual in this cycle. The latest employment report only underlined the Fed's concerns that the cooling down of wage growth and the entire labor market is unfortunately still ahead of us.
About the Author
 Jaroslaw Jamka - Experienced fund management expert, professionally associated with the capital market for over 25 years. He holds a PhD in economics, a license of an investment advisor and a securities broker. He personally managed equity, bond, mutli-asset and global macro cross-asset funds. For many years, he managed the largest Polish pension fund with assets over PLN 30 billion. As an investment director, he managed the work of many management teams. He gained experience as: Member of the Management Board of ING PTE, Vice-President and President of the Management Board of ING TUnŻ, Vice-President of the Management Board of Money Makers SA, Vice-President of the Management Board of Ipopema TFI, Vice-President of the Management Board of Quercus TFI, Member of the Management Board of Skarbiec TFI, as well as Member of Supervisory Boards of ING PTE and AXA PTE. For 12 years he has specialized in managing global macro cross-asset classes.
Disclaimer
This document is only informative material for use by the recipient. It should not be understood as an advisory material or as a basis for making investment decisions. Nor should it be understood as an investment recommendation. All opinions and forecasts presented in this study are only the expression of the author's opinion on the date of publication and are subject to change without notice. The author is not responsible for any investment decisions made on the basis of this study. Historical investment results do not guarantee that similar results will be achieved in the future.


