


Indicators of technical analysis

Technical analysis indicators are mathematical formulas that are based on the price (sometimes also the volume) of financial instruments and its derivatives. They are divided into many types, eg trend indicators, oscillators or based on the volume of transactions. Investors use them in their trading systems to determine the entry or exit point from the market, determine the directional tendency or measure the potential range of movements. Rarely does a single indicator constitute a system. A popular way is to create their sets, where the generation of signals (or so-called confirmations) from several formulas at the same time determines the investor's action.
ATR (Average True Range)
ATR is an indicator for measuring price volatility. The higher the value the index takes, the greater the volatility on the market, while low values may indicate stabilization or even consolidation. It is usually used to catch local peaks and holes, where the extreme of the indicator may suggest a turning point.
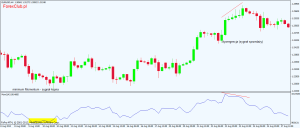
Bollinger Bands
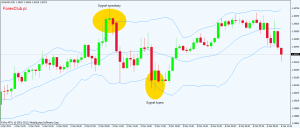
Indicator based on the volatility of the course, which determines the channel in which it should theoretically move. At the moment when the course in sideways trend Suddenly it begins to go beyond these limits is a signal that a short-term reversal of this movement may occur.
A buy signal is made when the price is below or near the bottom of the band. On the other hand, a sell signal occurs when the rate breaks above or approaches the upper band. These signals only apply when the market is moving sideways.
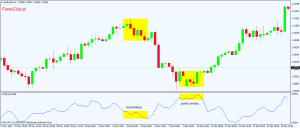
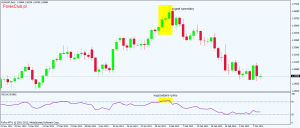
CCI (Commodity Channel Index)
Wskaźnik Index of the Commodity Channel has two uses. The first is the oscillator function, which is overbought and oversold regions. A break above 100 (below -100) indicates a situation where prices are excessively high. So we are dealing with an overbought (similarly for a negative value it is the oversold level). The second function is based on the divergence of indications CCI and the rate of the instrument. When the price is getting higher and higher and the CCI value decreases, it means a downward divergence and a signal to take a short position (similarly for a long position).
MACD
One of the most popular technical analysis indicators, it is based on the difference between two exponential moving averages (EMAs) of different periods. The line that generates signals to open positions is the average of the values MACD. A break from the bottom of a more periodic line through another one less than 0,00 generates a buy signal. On the other hand, a rebound at the top of the MACD gives a sell signal. The MACD histogram shows the discrepancy between the two moving averages.
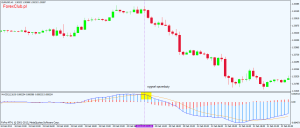
On the MT4 platform, the MACD with only one moving average is available as standard.
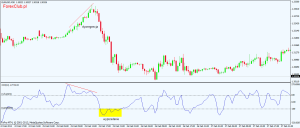
Momentum
Impetus rate, which measures the scale of price change in the indicated period. The buy signal is the situation in which Momentum strikes a new minimum, and then begins to grow. The sales signal is generated in an analogous situation when the indicator sets a new maximum and begins to fall. The second type of signals is the divergence between the value of the indicator and the price of the instrument.
Moving Average (MA)
Moving Average is one of the most popular and simplest indicators used in technical analysis. Their main function is to smooth the price of a financial instrument by adding together the prices (open, close, high, low or a combination thereof) from a given period and divide them by the number of prices taken into account.
SEE ALSO: Technical Analysis Indicators for MT4 and MT5 [DOWNLOAD]
Moving averages are widely used and can be interpreted in several ways. They can generate a buy / sell signal at the moment of crossing the price of an instrument or, in the case of a combination of more than one MA of different periods or types, at the moment of crossing each other. They are also often only used to smooth the chart or identify the trend in the market (mainly averages with an extended period).
There are several basic types of medium:
- Simple Moving Average (SMA - Simple Moving Avarage)
- Exponential moving average (EMA - Exponential Moving Average)
- Weighted moving average (WMA - Weight Moving Avarage).
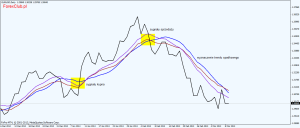
SMA (blue) is calculated in the simplest possible way, i.e. using the arithmetic mean. The sum of prices from the selected period is divided by the number of periods taken into account.
EMA (brown) assigns more and more weight fresher prices in an exponential way, thanks to which the average responds faster to the price behavior.
WMA (purple) is based on the weighted average formula. Like EMA, it assigns more weight to the latest prices but only takes data from the designated period and omits older quotes.
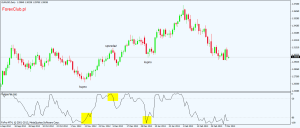
A stochastic oscillator
(STS - Stochastic Oscilator) - the indicator is used to monitor the change in the closing price from the low point in relation to the range between the low and high rates, while averaging these changes using a moving average. The stochastic oscillator consists of three parameters on which it is based: the number of periods to calculate% K, the number of periods used to calculate the% D signal line, and the% K line smoothing factor. This gives us two lines:% K, which is the main line (solid blue) and% D, which is a smoothed form of% K called the signal line.
STS generates three types of market entry signals:
- the intersection of the% D line by% K (the bottom line means buying, selling at the top),
- intersection by the sales (20.0) or overbought (80.0) indicator,
- divergence between the index and the price.
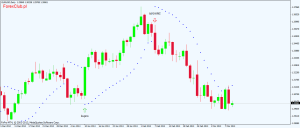
Parabolic SAR
The author of the indicator is Wellesa Wilder, creator of the RSI and DMI. It is most often used to designate the position to close a position. Buy positions are closed when the rate is below the Parabolic SAR. On the other hand, Sell positions are in a situation where the quotations are above the SAR indications. After a breakthrough occurs, the indicator continues to move in the direction of that movement, and only the absolute course change is taken into account. Only when there is a breakthrough does the movement return on the indicator.
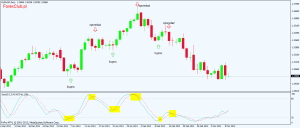
Pivot Points
Turning points, or Pivot Points are nothing more than a mathematical formula on the basis of which supports and resistances are determined. It uses the highs and lows in the indicated period, where potential turning points are determined in a given period of time in which the market will move. In the case of Forex, one day is most often used as a unit of time.
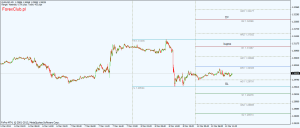
There are a lot of trading techniques on which Pivot Points are based, but usually the foundation is entering a position after breaking the assumed support (S) or resistance (R) and taking profits at subsequent levels, while SLs are set at opposite turning points.
The Pivot Points indicator is not available in the MT4 standard, but it can be downloaded from our forum. On JForex platform Dukascopy is built into the platform.
RSI (Relative Strength Index)
One of the most popular oscillators in AT. Its values range from 0 to 100. The main function RSI is an oversold and overbought study. When it goes above 70.0, the market is overbought. In the case of a value below 30.0, the oversold market is signaled. Leaving these extreme regions can be treated as a signal to open a position.
The indicator is also used to seek divergence between the RSI and the price of the instrument.
Williams Percent Range
The idea behind this indicator is quite similar to the STS. The main function is to catch situations in which the price of an instrument is overbought or oversold. The most expressive signals are generated when the value is in a sideways trend. It is accompanied by a large amplitude of fluctuations. The overbought area is between 80% and 100% (sell signal when exiting this area) and oversold is 0% to 20% (buy signal when the break is above 20%).
Volume
The volume is the cumulative value of the trades expressed in the base currency that have been made in a given period of time. On the Forex market, its interpretation is a bit different than on the stock exchange and it is difficult to obtain a reliable source regarding the volume due to the fact that the currency market is decentralized. AT ECN brokers we will get access to transactions that take place within the liquidity they provide (the larger the broker and liquidity, the more reliable the volume).
READ ALSO: What is the Forex market volume?
The volume confirms the credibility of the technical analysis pattern (its increase at key moments) and may suggest future changes in the trend.
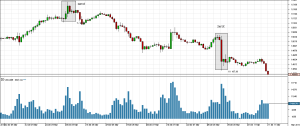
When the price of the asset systematically maintains the given tendency and suddenly there is a clear increase in the volume, one of two situations may occur:
- change of direction (most often),
- acceleration of growth (rarely).
Note:
There is no actual transaction volume on MT4 platforms. This is the number of ticks, i.e. the amount of price change in a given period.


