


Stocks in a sideways trend, US labor market

Another quiet week in the financial markets is behind us. The Polish stock market remains in a sideways consolidation trend, and the WIG index is still above the 200-session average. The US market was a bit more nervous as the S&P500 moved down from a 200-day to a 100-day moving average in three sessions and closed the whole week there.
Next week, however, we may witness two of the most important events in December: American CPI inflation for November (Tuesday) and the Fed's decision to raise interest rates (Wednesday). Could these events move the markets more strongly?
Certainly it is possible, especially with higher inflation (on Friday we already learned higher than expected PPI for November this year). If inflation and the FED do not cause stronger movements in the markets, then the next chance to exit the current consolidation is rather in January.
Stocks in a sideways trend… but is this the start of a new bull market?
Last week the WIG index fell slightly by 0,66% and has been in a sideways trend with small deviations for almost 3 weeks. It looks similar Wig20or even the EUR/PLN exchange rate (also here we have been consolidating around PLN 4,70 per euro for over a month).

W.1 Index WEDGE until December 09.12.2022, XNUMX, Source: own study, stooq.pl
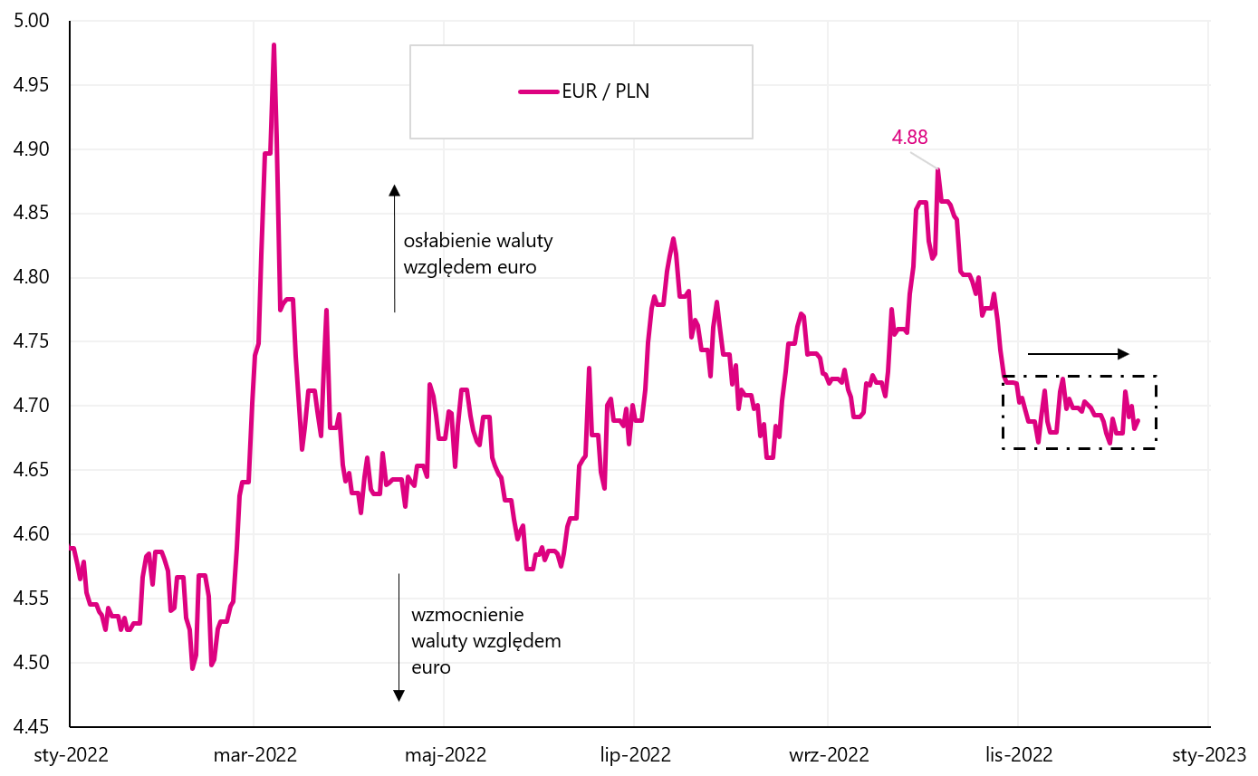
W.2 Course EUR / PLN until December 09.12.2022, XNUMX, Source: own study, stooq.pl
The past week, however, has not been a good one for US stocks. S & P500 index fell by 3,37%, stopped at the 100-session moving average and is now less than 10% above the lows of the current bear market (for comparison, the WIG is 22% above the lows).
W.3 Index S & P500 until December 09.12.2022, XNUMX, Source: own study, stooq.pl
Is the bottom of the market in the current cycle behind us? - always remains a valid question. Let's check how the current increases from the lows of October this year. look compared to the bear markets of 2008-2009, 2000-2002 and 1973-1974.
During the bear market of 2008-2009, we had three significant upward corrections (bear-market rallies, 1st +12,04% in 71 days; 2nd +7,44% in 28 days and 3rd +24,22% in 48 days), which in the next chart we hook in the S&P500 low of 12.10.2022/XNUMX/XNUMX
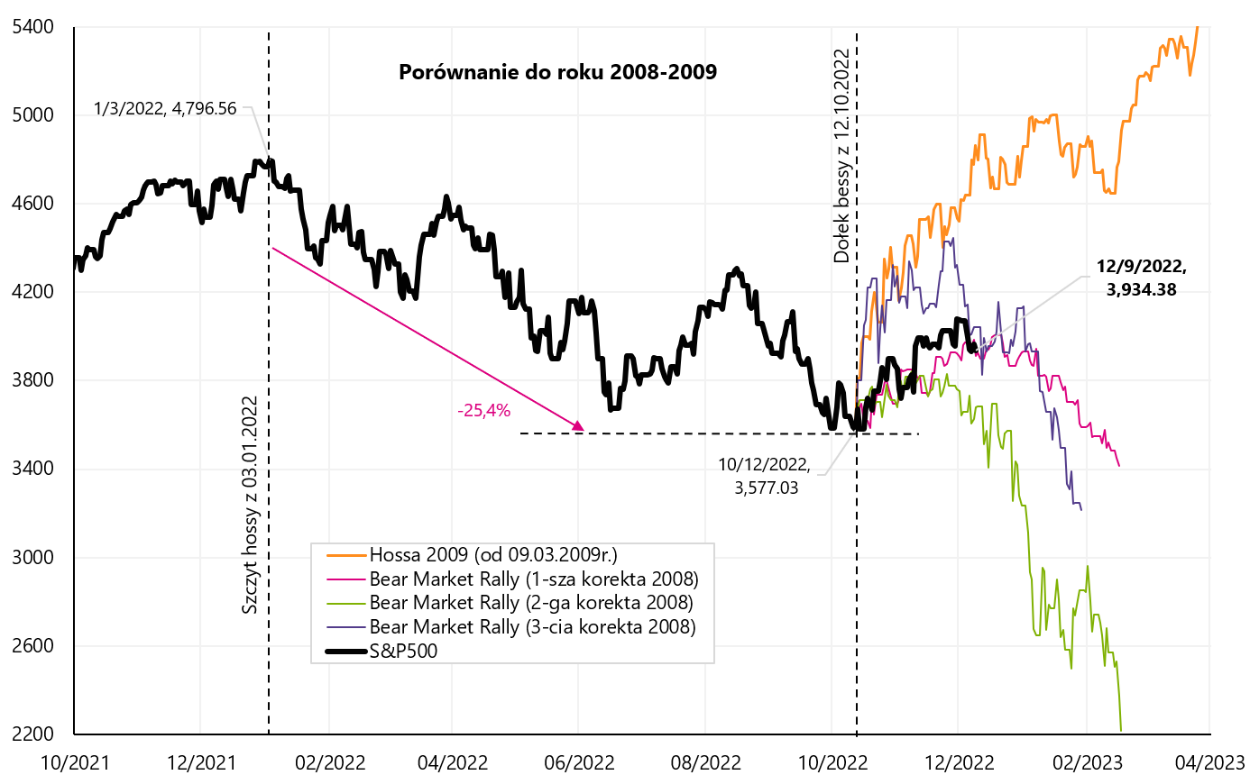
W.4 Index S & P500 until December 09.12.2022, 2008. with three corrections of "bear-market rallies" from 2009-09.03.2009, and another bull market from March XNUMX, XNUMX, Source: own study, stooq.pl
The next two charts show situations from the years 2000-2002 (5 major bear-market rallies: 1st +7,70% in 26 days; 2nd: +8,62% in 42 days, 3rd +18,99% in 48 days, 5th +21,40% in 106 days and 5th +20,68% in 31 days ).
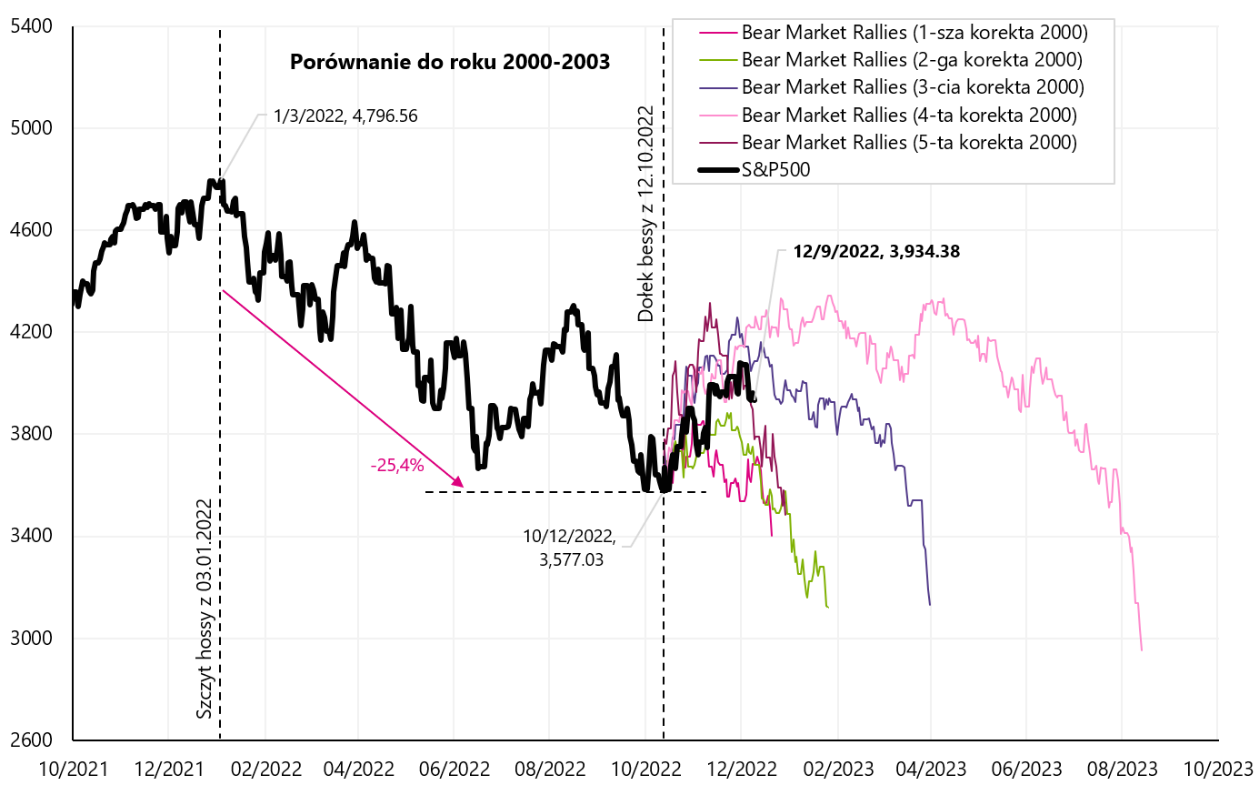
W.5 Index S & P500 until December 09.12.2022, 2008. with five significant corrections of "bear-market rallies" from 2009-XNUMX, Source: own study, stooq.pl
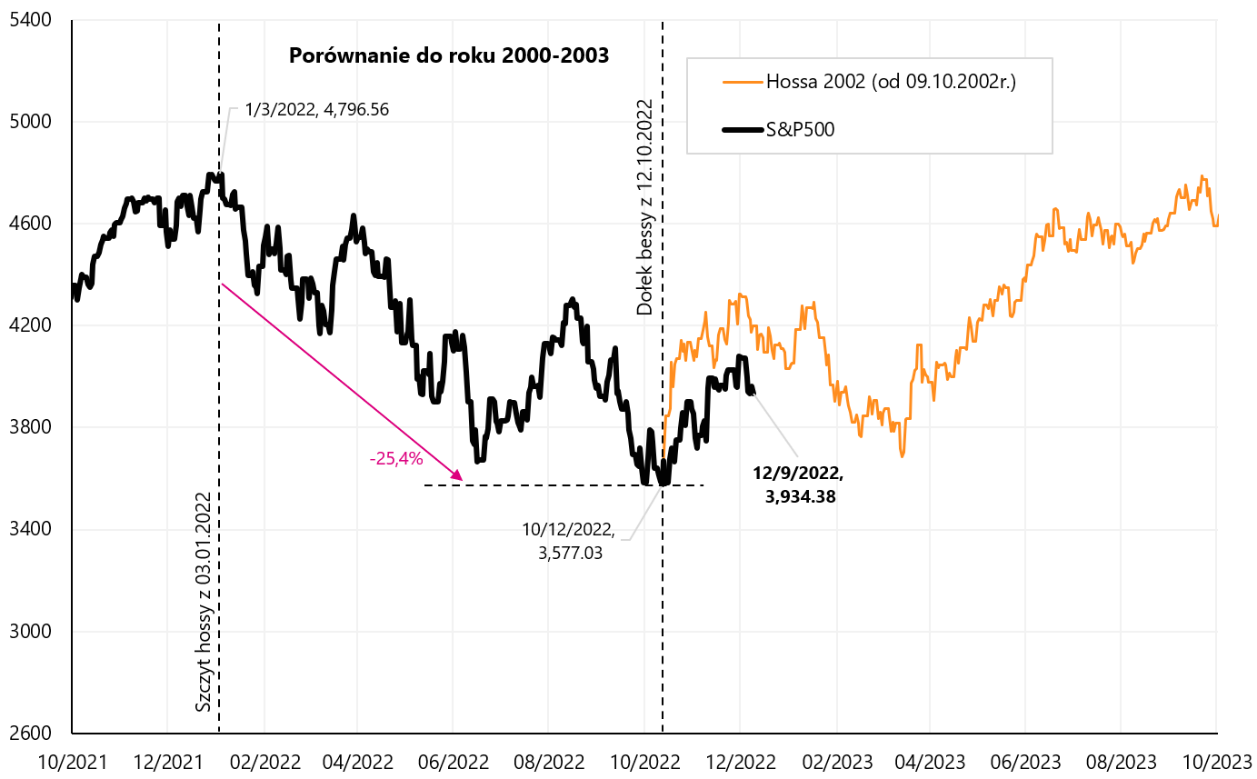
W.6 Index S & P500 until December 09.12.2022, 2002. with the beginning of the bull market from XNUMX, Source: own elaboration, stooq.pl
In the bear market of 1973-1974, we had four significant upward corrections during (1st +8,46% over 21 days; 2nd: +10,85% over 52 days, 3rd +10,02% over 31 days and 4th +7,15% in 13 days).
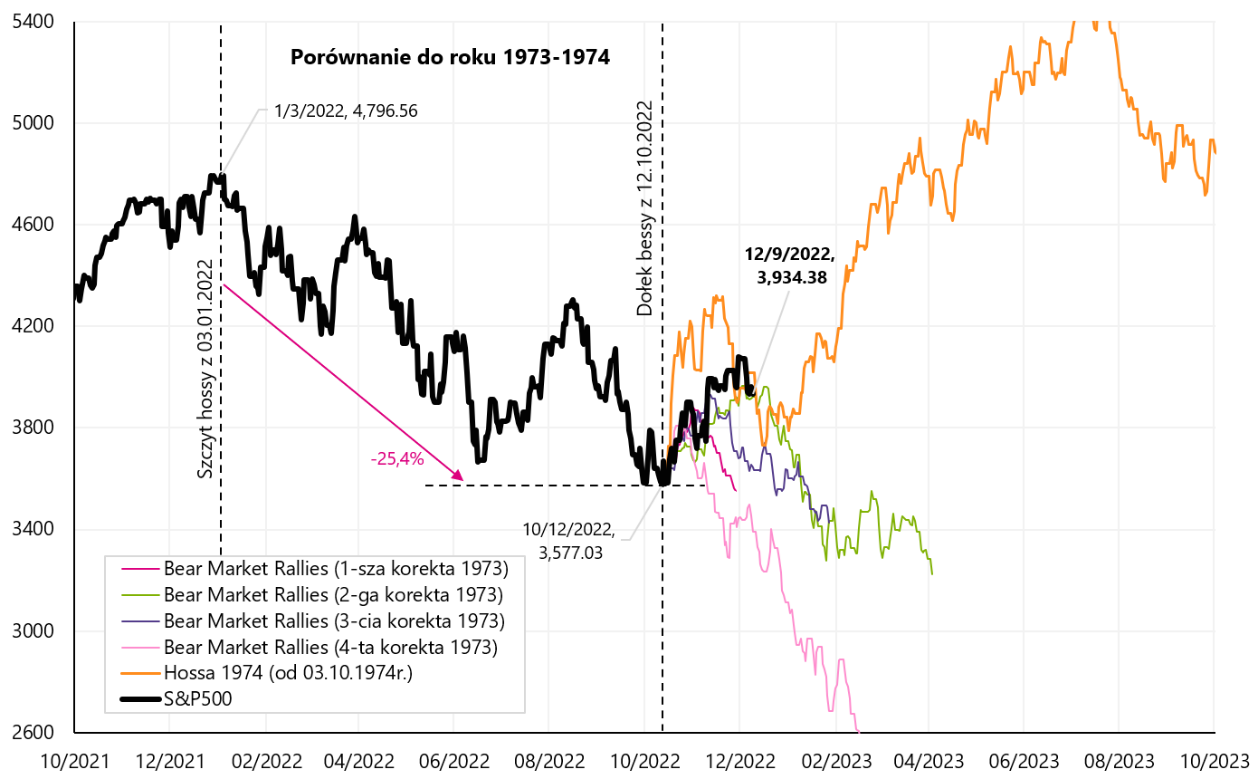
W.7 Index S & P500 until December 09.12.2022, 1973. with four corrections of "bear-market rallies" from 1974-03.10.1974, and another bull market from October XNUMX, XNUMX, source: own elaboration, stooq.pl
During the current declines in there were three significant bounces (bear-market rallies), which, for comparison, we also "hook" in the hole of October 12.10.2022, XNUMX. The next chart shows the details.
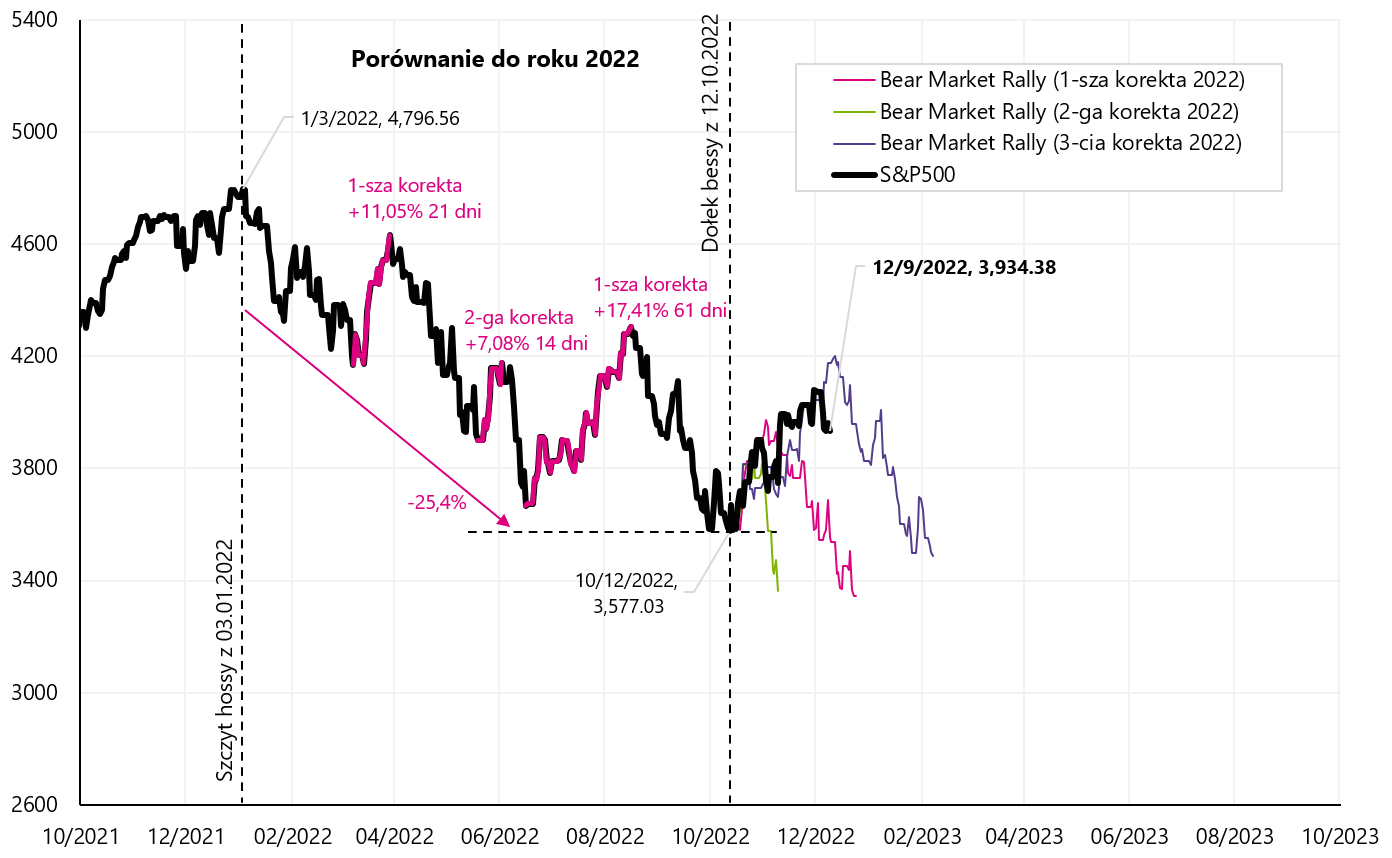
W.8 Index S & P500 until December 09.12.2022, 2022. with three corrections of "bear-market rallies" from XNUMX, Source: own study, stooq.pl
In the end, we're left summary of a total of 15 upward corrections during bear markets.
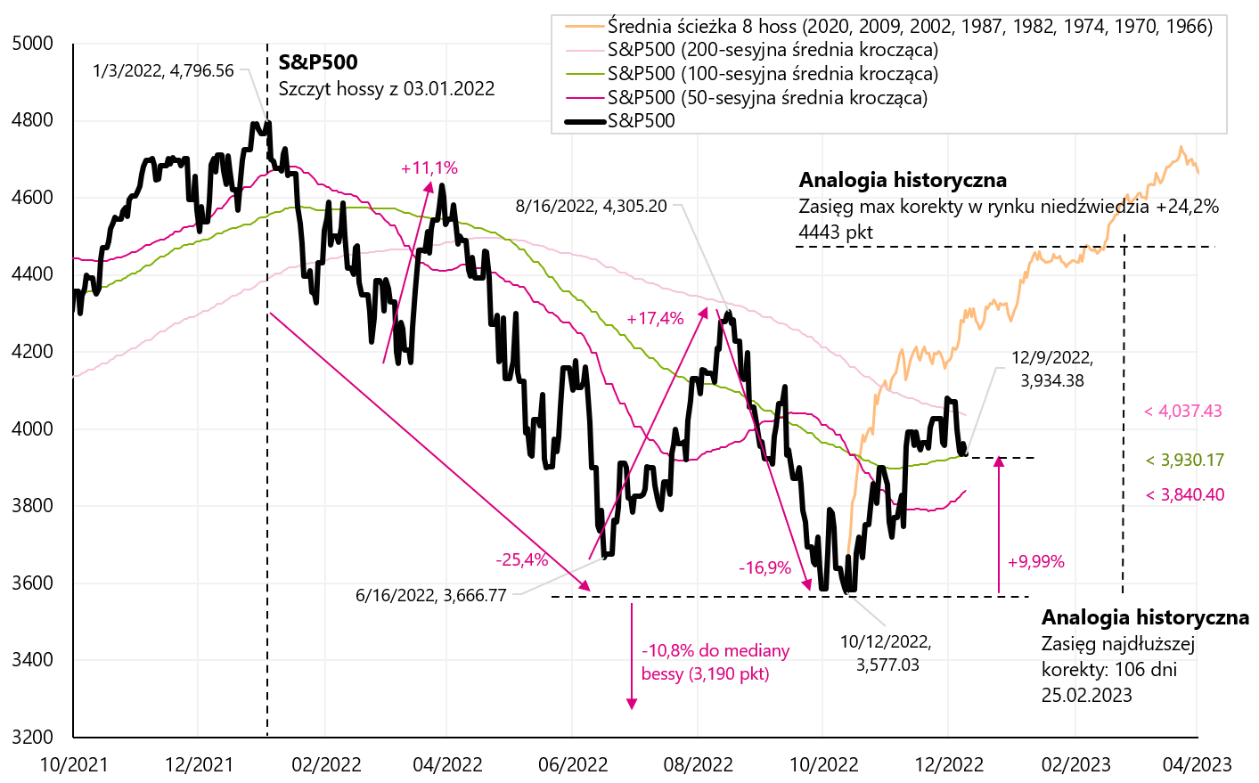
In the next chart, we present two dashed squares: the first indicates the range of the rebound to the "bear-market rally" high, and the second square the range of the next decreases, until the next bear market low. In addition, on the chart we mark the average path from 8 bulls, which also starts in the hole of October 12.10.2022, XNUMX.
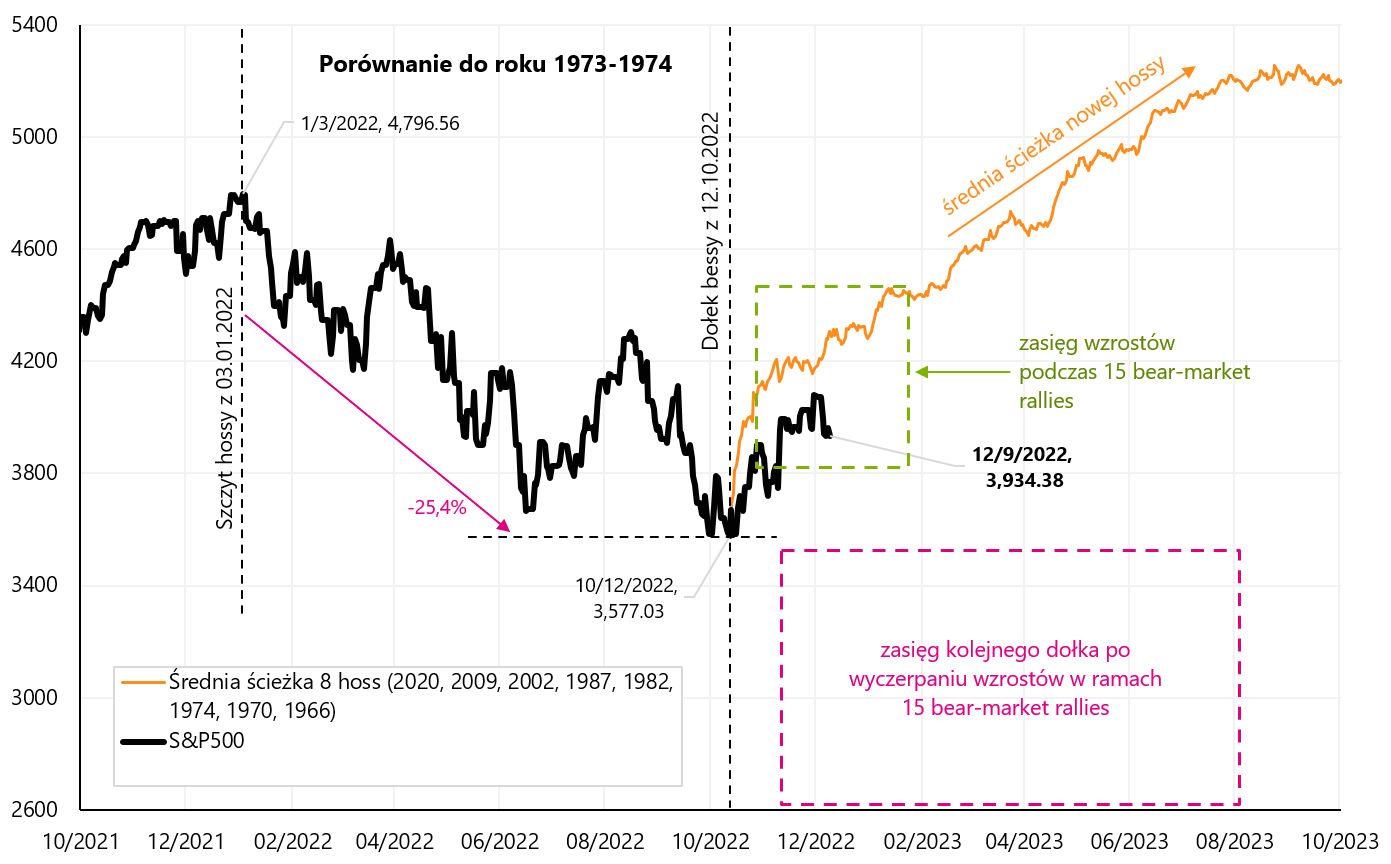
W.9 Index S & P500 until December 09.12.2022, 15. and a summary of 2022 "bear-market rallies" from bear markets in 2008, 2009-2000, 2002-1973 and 1974-XNUMX, Source: own study, stooq.pl
The current upward rebound on 30.11.2022/4080/15 at XNUMX points is roughly in the middle of the green square (around the average bear-market rally based on XNUMX historical cases). If the current increases are to be the beginning of a new bull market, we are growing a bit too slowly for historical analogies, but "historical verdict" - whether we currently have a new bull market or just another "bear-market rally" has not yet been decided.
US: PPI & CPI
Next week promises to be very interesting because on Tuesday we will know the CPI inflation reading for November in the US, and on Wednesday the FED will have the opportunity to "react" to it, or at least take it into account in its decision to raise interest rates again.
We got a foretaste of CPI inflation this week in the form of publications PPI producer price inflationwhich turned out to be very hot. As a rule, PPI inflation tends to outpace changes in CPI inflation (consumer prices), or at least indicates the direction of changes. PPI inflation rose +0,3% MoM (expected +0,2%), resulting in an annual change of +7,4% (expected +7,2%). The chart shows the monthly change in PPI (series SA).
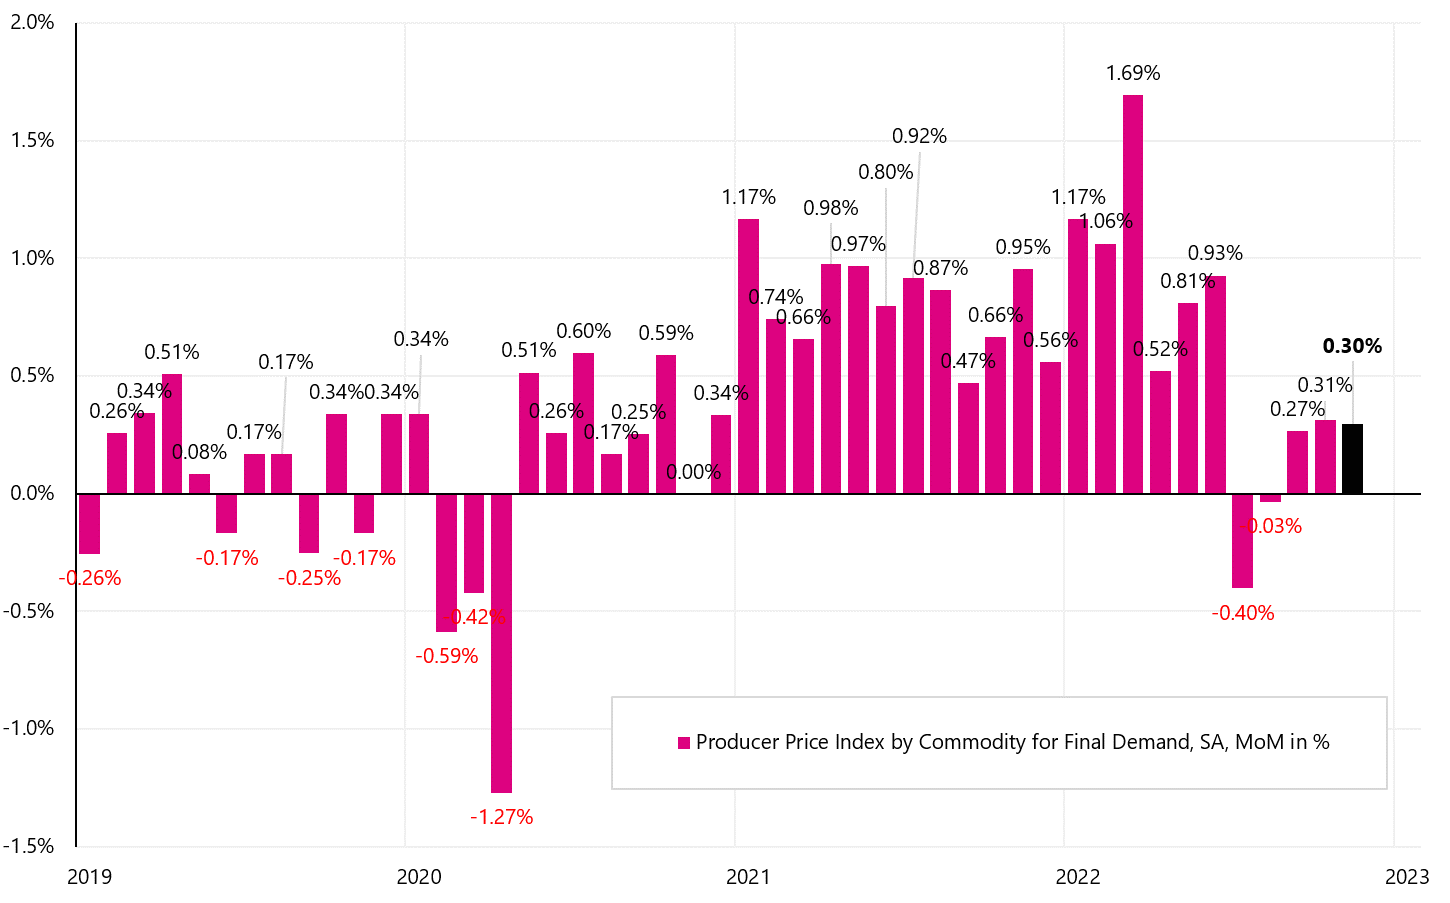
W.10 Monthly change in inflation PPI in the USA (SA series - seasonally adjusted), Source: own study, FRED
The basket of PPI inflation consists of three main components: PPI inflation for services (65,1%), goods (33,1%) and construction prices (1,74%). Monthly PPI growth was generated in the "worst" configuration for CPI, as the increase of +0,3% MoM is mainly due to Services +0,4% MoM. And in consumer CPI inflation, it is services that pose the biggest problem in the fight against inflation. Commodities PPI rose only 0,1% MoM.

W.11 Inflation PPI in the US for November 2022, Source: Bureau of Labor Statistics, PPI News Release of 09.12.20022, Table A
PPI inflation indices continue to rise, apart from goods whose prices can also fall in CPI inflation. Inflation indices show absolute price changes (and not just year-on-year dynamics - which can be misleading, because a falling annual change dynamics does not necessarily mean a decrease in prices).

W.12 Change of major indices PPI in the USA (NSA series - not seasonally adjusted), Source: own study, FRED
The debt market reacted negatively to PPI inflation, yields of 10-year US bonds rose by the end of the day to ca. 0 basis points.
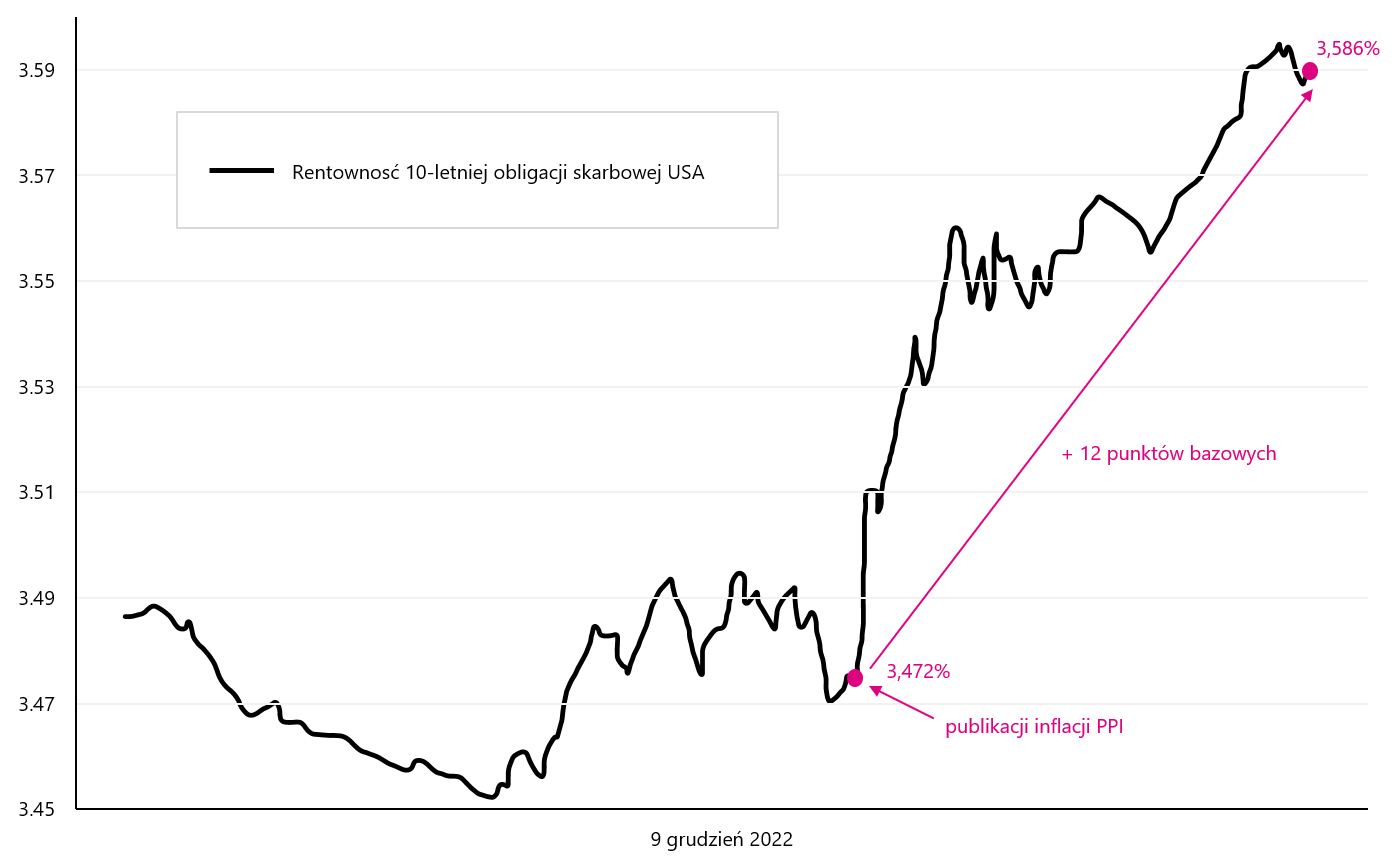
W.13 Change in profitability 10-year US Treasury bonds December 9.12.2022, XNUMX (on the date of publication of the PPI for November this year), Source: own study, stooq.pl
What can we expect from CPI inflation next Tuesday? The inflation forecast according to the Cleveland FED model is currently +0,37% MoM for November 2022. More details on the website Cleveland Fed. Certainly, the publication of CPI inflation next Tuesday will be one of the most important events on the financial market in December this year.
More about the US labor market: strong or weak?
Almost for Powell, head of the Fed, the labor market is the key to beating inflation, it is worth taking a closer look at the data published every month by the BLS (Bureau of Labor Statistics). The BLS publishes labor market data based on two separate surveys: the Current Population Survey (CPS; household survey) and the Current Employment Statistics Survey (CES; establishment survey).
According to the first survey, employment in the US increased by 2022 from March 2022 to November 12. people. Whereas according to the second poll (which is more looked at by the markets i FED) employment in this period increased by 2 million 692 thousand. people. Impossible? Yet the difference is substantial. So is the US labor market strong (bad news for the Fed and markets in terms of inflation) or weak (good news)? According to the first survey, employment in the USA is 158.47 million people, while according to the second, it is 153.548 million people. First, let's check the formal differences between these surveys.
The CES survey (establishment survey) publishes such data as jobs (payrolls) per industry, earnings, working time, overtime. Data is collected from 131 businesses and government agencies. The CPS (household survey) collects data from 60. households and publishes employment data (number of people) and quite a few unemployment statistics. The main differences in the number of employees between the two surveys are:
- CPS (household survey) includes farmers, self-employed, people working at home, also free of charge - these people are not included in CES,
- CPS counts only people over 16 years old, there are no restrictions in CES,
- CPS counts people, and CES counts jobs - if someone has 3 full-time jobs, they will be counted as 1 in CPS and as 3 in CES.
Of course, both employment series come in two versions: seasonally adjusted and unadjusted. The next chart shows the details.
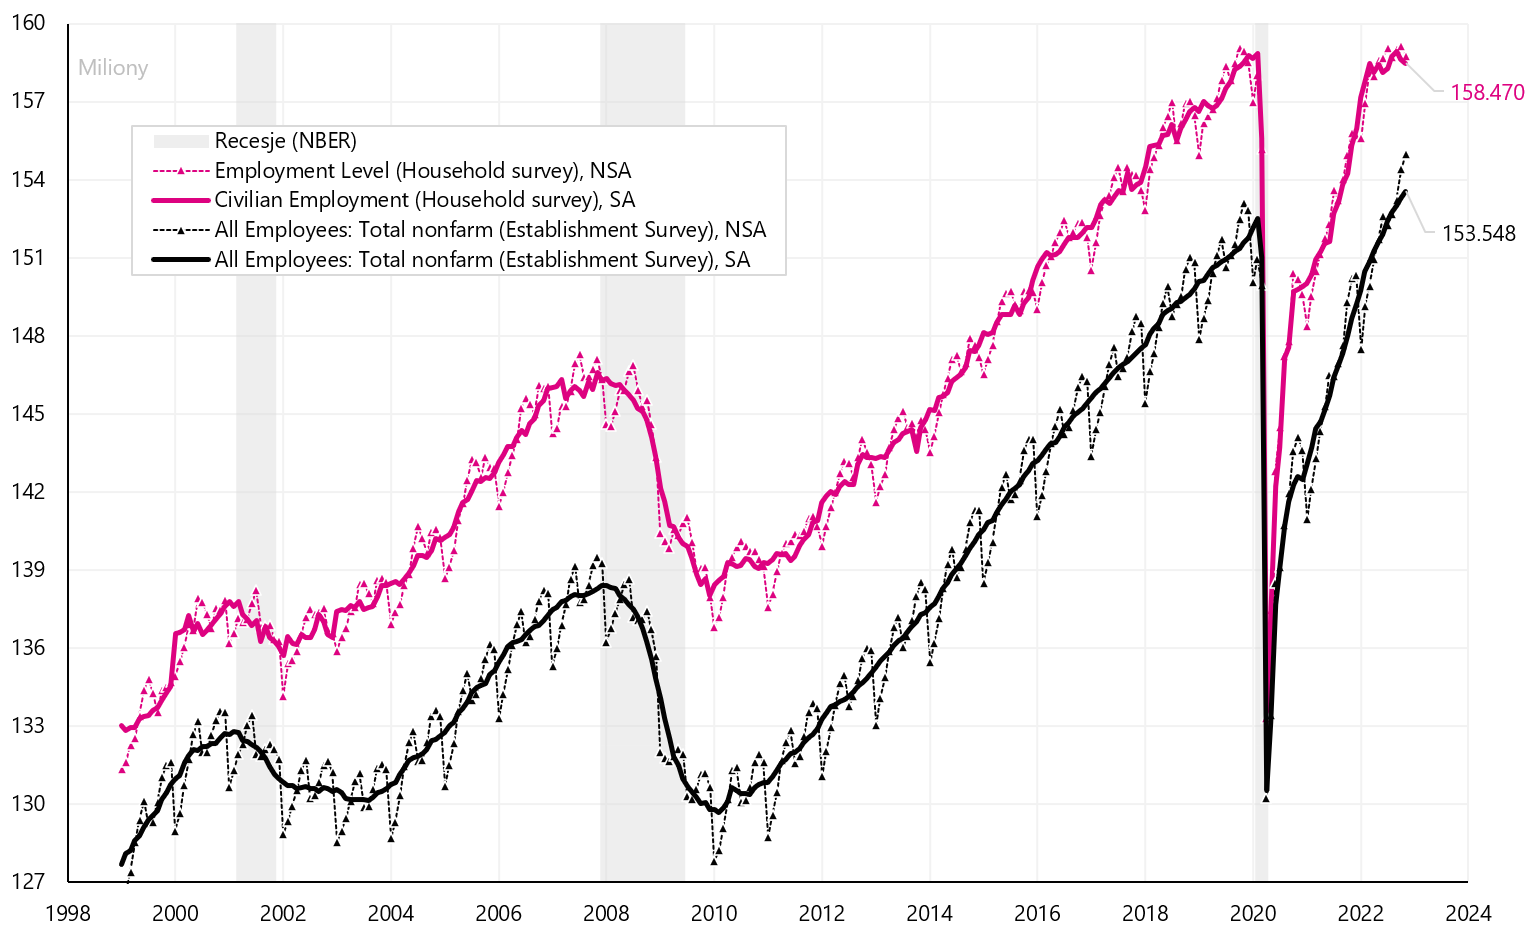
W. 14 Employment in the US according to CPS (household survey) and CES (establishment survey), two series (seasonally adjusted and unadjusted), Source: own study, FRED
The difference between one series and the other was created in 2022, which is shown in the next chart.

W. 15 Employment in the US according to CPS (household survey) and CES (establishment survey) - difference in employment change in 2022, Source: own study, FRED
The reasons for such a big difference can be found in two places:
- the number of people who work more than one job, and rising inflation and related costs have forced Americans to work many jobs (hence the "artificial" increase in the number of jobs, not the number of employees), and
- (possible erroneous assumptions regarding the so-called "birth-death" model, with which BLS estimates how many net jobs were created in connection with the establishment of new companies and the liquidation of existing ones (because such companies are not reached by interviewers, therefore BLS estimates how many net jobs created in such places).This model usually adds the number of jobs to the official employment change statistics. For example, from March to November, the model "created" 1 jobs (against a total of 332 jobs created - these data are only available for the NSA series).
In the case of number of people holding more than one job, we actually had an increase in such people in 2022, but if we compare the current increases to previous cycles, we will not find anything extraordinary here, because we also had increases in the number of such people in previous cycles (and in previous cycles there were no such differences in the number of employees between the two surveys).
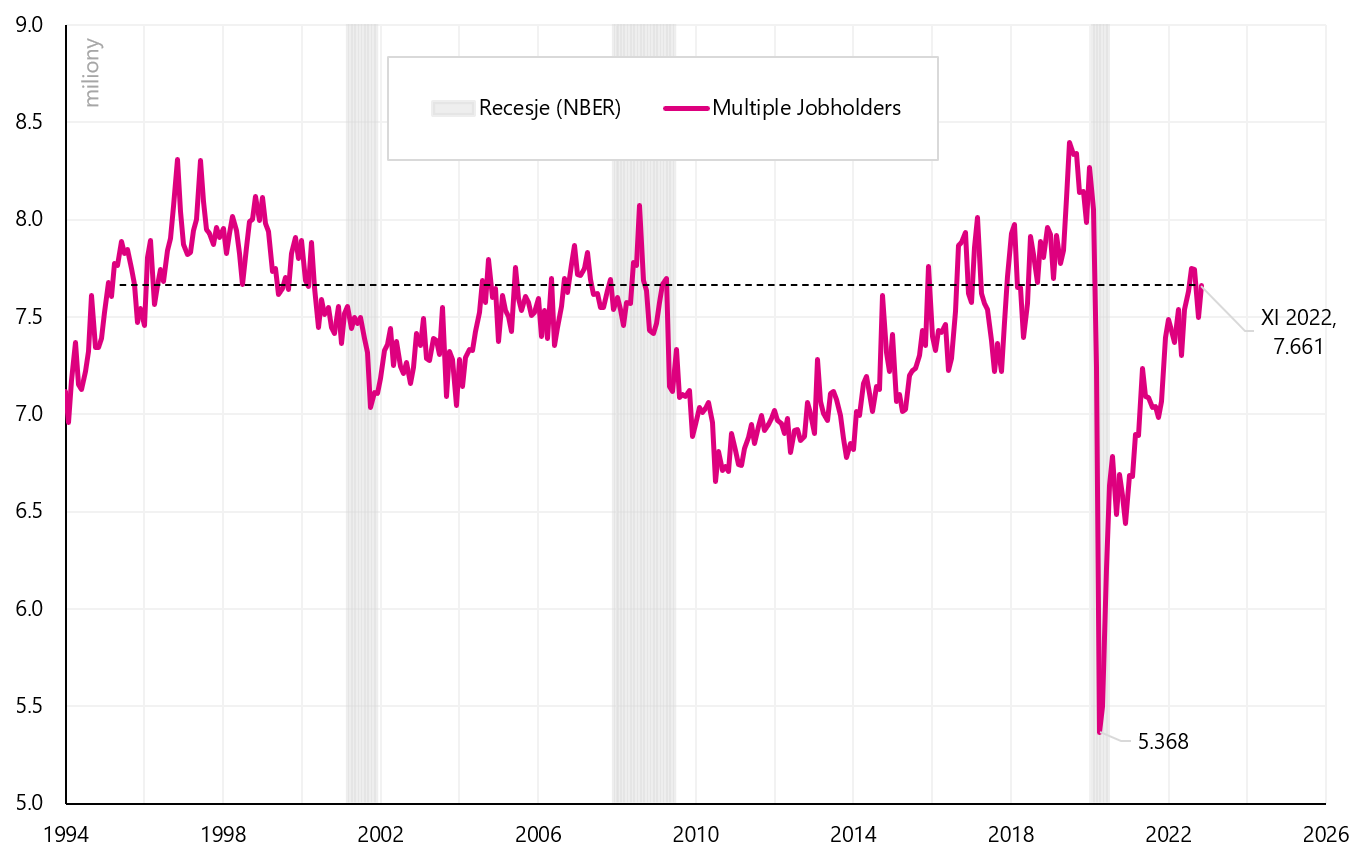
W.16 Number of people working in more than one job in the USA, Source: own study, FRED
Similarly, we will look at the birth-death model adding jobs (green arrow in the chart below), where no anomalies are seen in 2022, or directly around the pandemic.
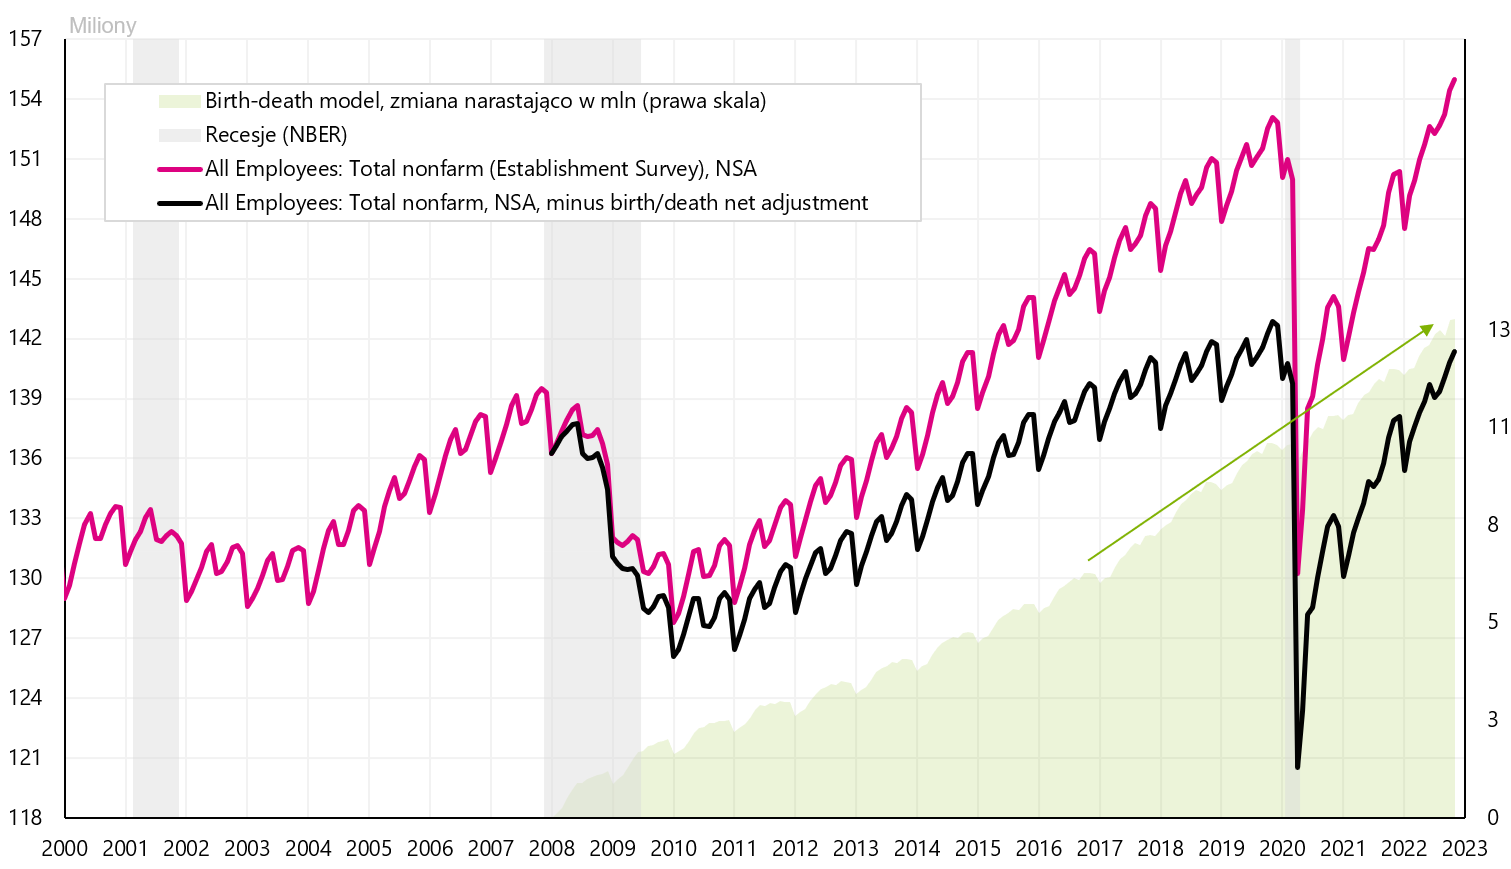
W. 17 Number of jobs in the USA according to the Establishment Survey - with and without the birth-death model (NSA series), Source: own study, FRED
In conclusion, the large difference in both surveys can be partly explained (in favor of the household survey, i.e. we have a smaller increase in employment than the establishment survey suggests), the growing number of people working more than one job, and possible overestimations of the number of jobs by the birth model -death.
If this is the case, we also have lower demand for labour, which should result in lower pressure on wage growth (which would be good news in terms of future inflation).
Summation
The past week was a calm one for Polish assets (equity market, zloty). Nevertheless, the US indices ended the week with bigger declines. The S&P500 fell by 3,37% and stopped at the 100-day moving average and is now less than 10% above the lows of the current bear market (for comparison, the WIG is 22% above the lows).
However, next week will be much more important in terms of potential price movements in the financial markets. On Tuesday in the US we will know the CPI inflation for November this year, which is crucial for the Fed and the markets. And on Wednesday we will know the next decision of the Fed regarding the next interest rate hike. As usual, the press conference of the head of the Fed will attract a lot of attention.
About the Author
 Jaroslaw Jamka - Experienced fund management expert, professionally associated with the capital market for over 25 years. He holds a PhD in economics, a license of an investment advisor and a securities broker. He personally managed equity, bond, mutli-asset and global macro cross-asset funds. For many years, he managed the largest Polish pension fund with assets over PLN 30 billion. As an investment director, he managed the work of many management teams. He gained experience as: Member of the Management Board of ING PTE, Vice-President and President of the Management Board of ING TUnŻ, Vice-President of the Management Board of Money Makers SA, Vice-President of the Management Board of Ipopema TFI, Vice-President of the Management Board of Quercus TFI, Member of the Management Board of Skarbiec TFI, as well as Member of Supervisory Boards of ING PTE and AXA PTE. For 12 years he has specialized in managing global macro cross-asset classes.
Disclaimer
This document is only informative material for use by the recipient. It should not be understood as an advisory material or as a basis for making investment decisions. Nor should it be understood as an investment recommendation. All opinions and forecasts presented in this study are only the expression of the author's opinion on the date of publication and are subject to change without notice. The author is not responsible for any investment decisions made on the basis of this study. Historical investment results do not guarantee that similar results will be achieved in the future.


