


Continued optimism in the gold and copper markets as oil consolidates

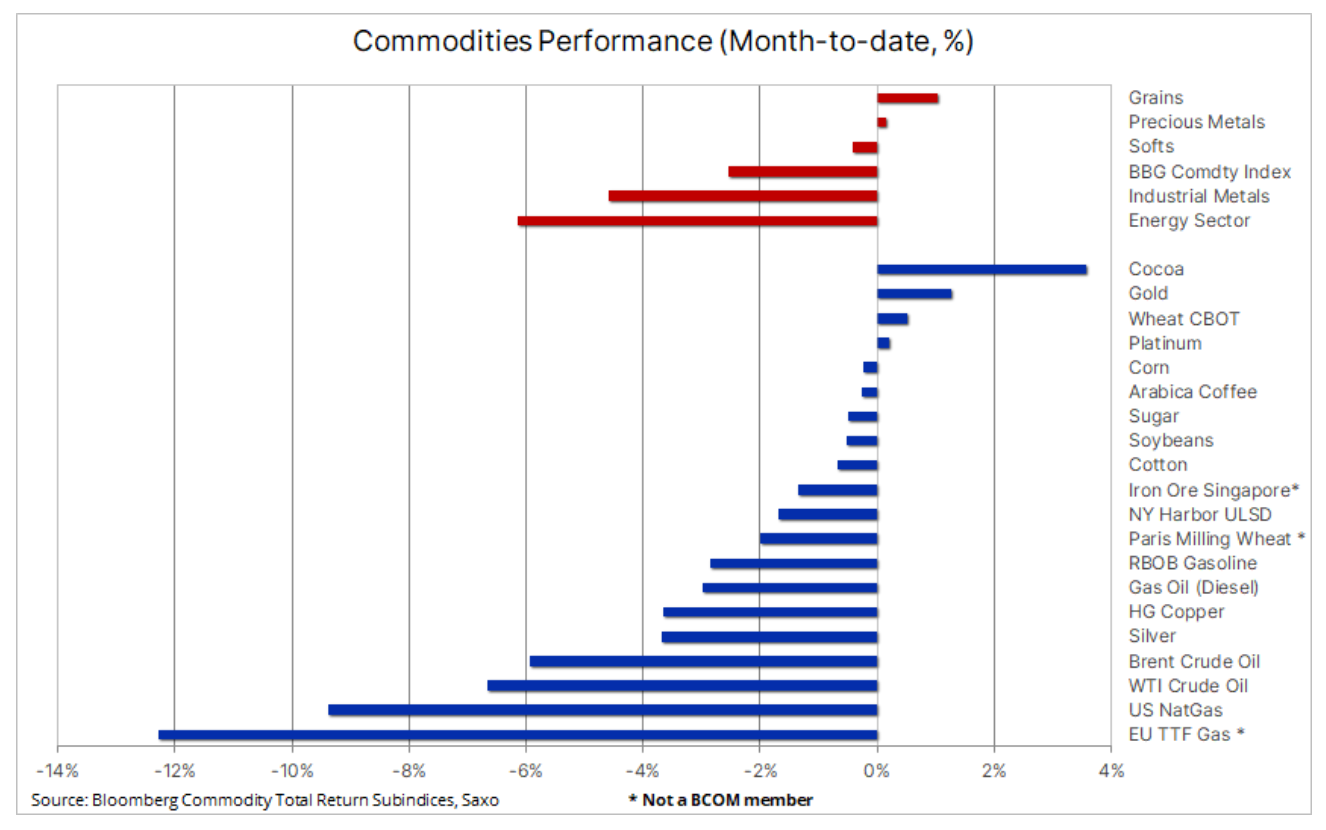
The commodities sector remains under pressure this month and is now headed for a sixth straight month-on-month decline with the Bloomberg Bloomberg Commodity Total Return index dropping to near its lowest levels since January 2022. This month, energy and industrial metals markets have seen lingering concerns about the global economic outlook, and in particular the pace of China's recovery, which has turned out to be less commodity-driven than the government-backed growth phases so far.
Overall, the index, which tracks the performance of the 24 most important commodity futures, spread evenly across energy, metals and agricultural commodities, was down around 2,5% on a monthly basis, with the largest losses being, almost as usual, natural gas in the US in the US and Europe in the face of high supply and waning demand during the summer months. Crude oil is also at the bottom of the table, after a rollercoaster ride in recent months involving a banking crisis, OPEC+ surprise production cut and demand concerns in China, it is now near the low of the cycle.
A weaker-than-expected outlook for China also contributed to a sharp decline in industrial metals prices; copper – the preferred long-term investment in the context of green transition demand and lack of resilient supply – suffered from speculative selling immediately after breaking a key technical level.
Copper and silver - the two biggest victims of last week's risk aversion
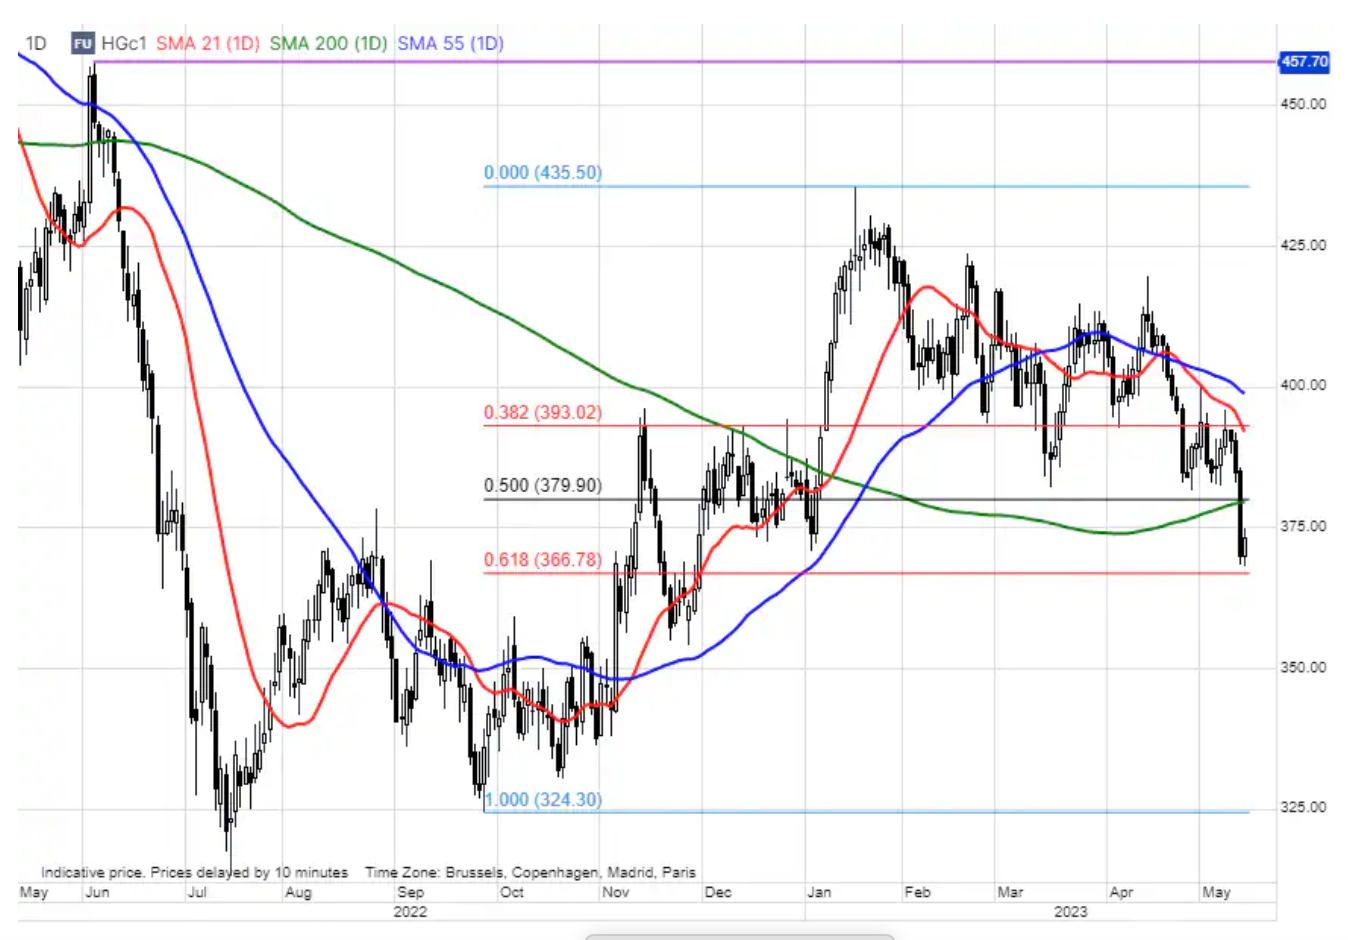
Futures contracts for copper dropped to a seven-month low amid rising concerns about the health of the Chinese economy. Selling accelerated as a key support and now resistance level of $3,80/lb was broken for the first time in four months, providing support for the latest wave of sells from momentum funds and hedge funds already short net position on the futures market. The next key support level remains $3,6680/lb, a 61,8% retracement from the October-January rally line.
At Saxo, however, we believe that the current drop in copper prices is temporary as the theme of the green transition will continue to provide strong support for copper as the best conductor of electricity in the coming years in the context of a green transition including batteries, electric traction motors, renewable energy generation , energy storage and grid modernization. This is due to the fact that in the coming years the mining industry will face challenges related to the deterioration of ore grades, rising production costs and a post-pandemic lack of investment appetite as the focus on ESG has reduced the available investment pool offered by banks and funds.
The drop in copper prices caused a sell-off silver down 5%, its largest one-day loss since February 2021, with sales picking up after the metal broke the $24,50 support. After showing resistance during the March-April 31% rally, the risk of a correction has increased and although the action looks bad on the chart, it can be considered a normal and almost inevitable correction after a strong 31% rally in March-May . In terms of support, traders will now focus on $23,72, a 38,2% retracement from the rally line, while a move back above $24,5 will be needed to stabilize the market.
Persistent optimism on gold
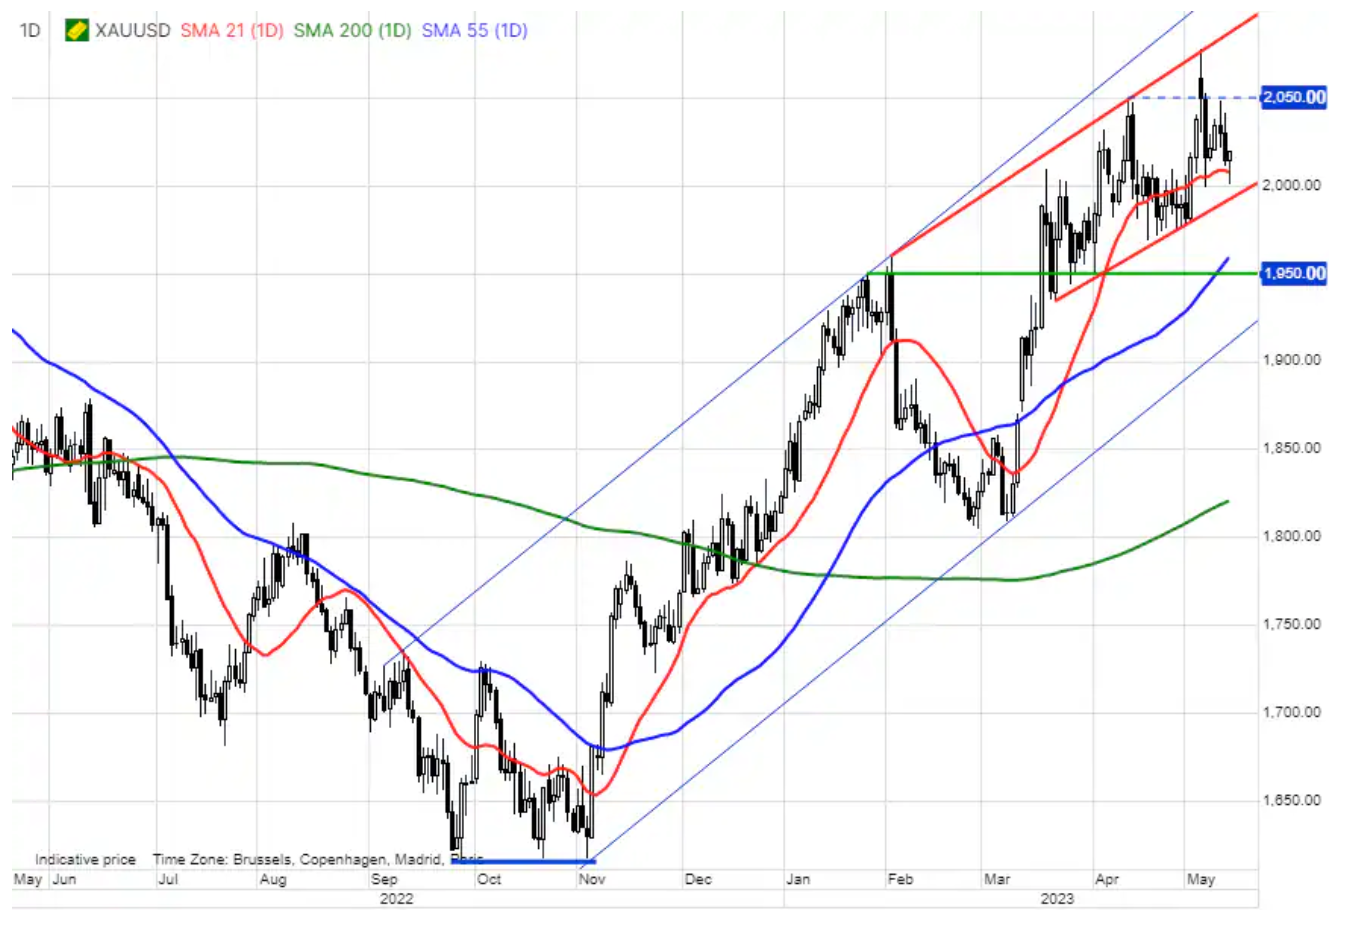
The overall weakness in the industrial metals sector, including the silver market, saw profit taking push the price down gold back to the key support area. The lower CPI reading, which boosted expectations for the Fed to hold off on interest rate hikes, surprised holders of the latest long positions, and after the price of silver fell by 5%, there was a risk of a deeper correction. However, rising US debt ceiling concerns, de-dollarization flows, geopolitical tensions, interest rate cut expectations later this year remain key reasons why the yellow metal is currently in very good shape. This is evident from the relationship gold to silver which rose to 84 (an ounce of silver to one ounce of gold), the highest since March 29. Aside from strong fundamentals, gold's short-term direction will be determined by flows, the dollar, and changes in US short-term rates and bond yields.
Since the March banking crisis brought rates and yields down sharply, hedge funds have increased their net long position in COMEX gold futures to a thirteen-month high. The most recent increase in the week ending May 2 was primarily the result of new long openings rather than short overlapping, bringing the long to short ratio to a three-year high of 7,1 longs to shorts. The value-weighted average gold futures price (VWAP) last reporting week was $2, indicating a level below which an exit from recently established long positions may begin. Below that, you can find additional support at $002,50, followed by significant support at $1, while resistance remains consistently above $990.
Oil: Demand concerns continue to weigh on the market
Petroleum spent the past week consolidating after a dip in early May that culminated weeks of weakness after OPEC+ unexpectedly cut production on April 2. Low refining margins pointing to the possibility of lower demand for oil, concerns about economic growth in China and the fact that traders were forced to withdraw from long positions established after OPEC cut production contributed to the sharp drop in prices. After breaking the support of $80 Brent and $76 WTI, there was a sell-off wave as in March from new shorts before finding support around the March lows, potentially pointing to a possible breakout favorable for double bottom prices.
In the short term, concerns about low demand continue to grow in the oil market, with US economic data on declining inflation and labor market conditions further fueling fears of an economic slowdown, and China inflation and credit data dispelling hopes for an upturn in demand in the this country. Late in the week, however, there were some reports that provided support for oil prices, most notably US Energy Secretary Jennifer Granholm announcing that the government intended to buy oil to replenish strategic reserves after congressional reserve releases ended in June. Simultaneously OPEC increased its 2023 oil demand forecast in China, thus supporting expectations of an increase in global demand of 2,33 million bpd, which is at odds with the current downward trend in oil prices.
For now, crude oil continues to struggle, and a lot of stabilization and consolidation work will be required to change that. As the first signal of stabilization, we would consider a return above these levels, primarily the psychologically important USD 80 level in the case of Brent oil.
Biggest Short Selling Wave in Cereals of 2020 as Crops Gain Speed
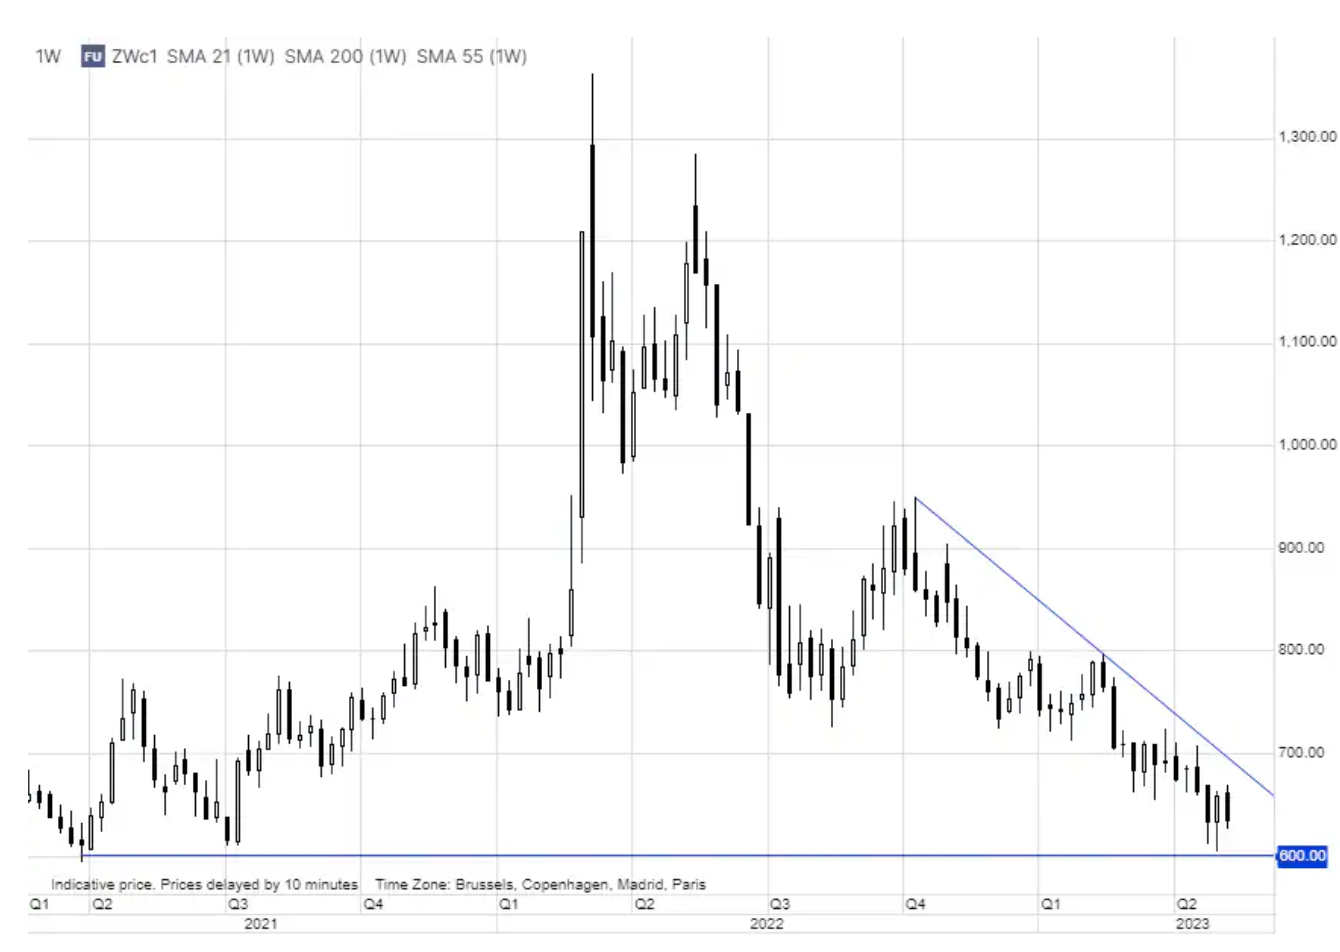
As a result of this year's high production forecast, the Bloomberg Grains Index hit a 15-month low followed by a rebound, with speculative investors reacting to the decline by taking a net short position in the grain sector for the first time since August 2020. On May 2, all six grain and soybean futures posted net sales, primarily for corn and soybeans. Highlights currently include weekly seeding progress reports released on Mondays by the USDA; in the most recent of them, as of May 7, the American soybean planting was at 35%, the second fastest rate in history. Corn crops were 49%, exceeding the five-year average of 42% and last year's average of 21%. By contrast, wheat sowing was just 24%, well below the five-year average of 38%.
The market was also awaiting Friday's report from the US Department of Agriculture on estimated supply and demand in global agriculture. This report presented the first USDA expectations regarding the level of stocks of key agricultural crops at the end of the 2023/2024 season. Average trade projections for 2023/2024 maize stocks could reach a five-year high of 2,1 billion bushels, a 53% increase from current levels, according to a study by Reuters. By contrast, soybean stocks could reach a four-year high of 293 million bushels, up 38% from this year.
Under pressure lately wheat, which is currently subject to the biggest short selling wave of any futures contract, may receive some support from this report, according to weekly data covering hedge fund positions in major commodity futures markets, as research results point to the lowest closing US stocks in nine years and the world's smallest harvest in eight years. This is due to production challenges in war-torn Ukraine and the drought in the US Great Plains, but this will be partly offset by the significant shift in the Russian harvest from last year's productive year to this year.
About the Author
 Ole Hansen, head of department of commodity market strategy, Saxo Bank. Djoined a group Saxo Bank in 2008. Focuses on providing strategies and analyzes of global commodity markets identified by foundations, market sentiment and technical development. Hansen is the author of the weekly update of the situation on the goods market and also provides customers with opinions on trading goods under the #SaxoStrats brand. He regularly cooperates with both television and printed media, including CNBC, Bloomberg, Reuters, Wall Street Journal, Financial Times and Telegraph.


Leave a Response