Better moods, but neither a bull nor a bear
Another successful week for the broad US stock market is behind us. The S&P500 is up for the third week in a row, delivering a return of +1,43% in order; +1,39% and last week +3,48%.
So, is the banking crisis completely over? Not necessarily ... if we look at the indices of American or European banks. If S & P500 is 2,94% above the level since the beginning of the banking crisis (i.e. from March 8 this year), while the index of American regional banks is currently as much as 23,99% below the level from March 8 this year.
After two weeks of decline (-20% and -6,75%), the Polish WIG0,48 index turned its streak and increased by +5,29% last week.
There is a good chance for the continuation of good moods in the markets in the near future.
Better moods in the markets
The end of the week, month and quarter brought better moods on the stock markets. He was the best last week WIG20 indexwhich increased by 5,3%. If we look at the result for March this year. Nasdaq100 provided the highest rate of return, growing as much as 10,4%. The summary of the results since the beginning of the year looks interesting, where the best rate of return was also provided by Nasdaq100 with a score of +20,5%. The table below shows the details.
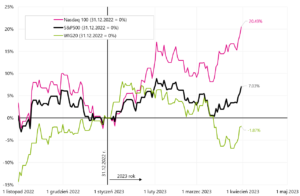
On the other hand, in the chart below, we compare the rates of return of the main indices since the beginning of 2023. The difference between Nasdaq100 and WIG20 has been over 22 percentage points since the beginning of the year.
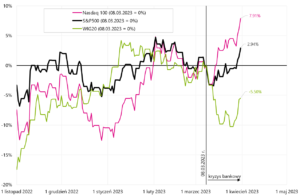
The chart of rates of return since March 8 this year, i.e. since the outbreak of the banking crisis, looks similar for the above indices.
The banking crisis seems to be limited to the financial sector today (with a tendency for further increases in bank share prices, with the exception of US regional banks). WIG Banks from March 8 this year. is down only 5,96% – which is the best result compared to other banking indices. iShares STOXX Europe 600 Banks UCITS ETF down 12,4% over the same period. On the other hand, the largest drop since March 8, as much as 23,99%, was recorded by US regional banks (SPDR S&P Regional Banking ETF). The chart below compares the rates of return for these indices since March 8 this year.
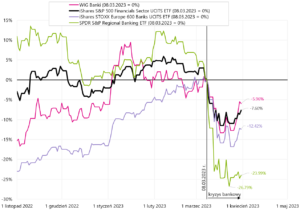
W. 3 Selected banking indices from March 08.03.2023, XNUMX. Source: own study, stooq.pl, ishares.com
Nevertheless, if we compare the rates of return for the entire first quarter of 2023, European banks, including Polish ones, fare better than American ones. Year to date iShares STOXX Europe 600 Banks UCITS ETF is up 5,02%.
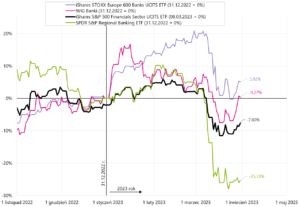
W. 4 Selected banking indices from March 31.12.2023, XNUMX. Source: own study, stooq.pl, ishares.com
In the past week, Polish banks gained the most (+7,8%), and the index of American regional banks increased by only 0,8%. Details for different periods are presented in the table below.
Cryptocurrency-related assets provided high rates of return this year. The development and popularity of blockchain technology has also made them appear ETFs exposure to this market segment. For example iShares Blockchain Technology UCITS ETF closes the first quarter of 2023 with a rate of return of as much as 63,4%. By comparison, bitcoin is up 72,5% this year.
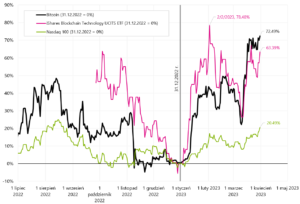
W. 5 Behavior of iShares Blockchain Technology UCITS ETF against Bitcoin and Nasdaq100 from December 31.12.2022, XNUMX. Source: own study based on data from Stooq.pl, ishares.com
The current market is neither like a bull market nor a bear market
In the previous report, we proposed four scenarios for how markets and the economy would develop in the context of ending the current cycle of slowdown/recession and price hikes interest rates. Our forecasts regarding the easing of the banking crisis (at least for now) are coming true - which generally improved investor sentiment in the past week. We can therefore slightly change the probabilities of individual scenarios (yes, we change them after a week..., but "markets pricing their scenarios" can change drastically, not gently, even in one day):
- golidilocks scenario: 5%
- Banking crisis scenario: 25% (was 30%)
- Scenario that something is about to break: 55% (was 50%)
- Recession scenario in the economy and calm markets: 15%
The calming banking crisis, rising share prices last week bode well for the next week, and maybe the whole of April. Markets may continue to rise in the short term and play (combined) scenarios one and four. In the following days, if further increases are maintained, we will see a further improvement in the narrative regarding the end of the crisis, strong economy and upcoming interest rate cuts (and, for example, rising stocks are due to the FED's balance sheet growing again).
So why can't our subjective probabilities in scenarios 2 and 3 be lowered? Because the most important part of the cycle, i.e. the FED interest rate cuts are still on in front of us. And the rising stocks increase the chance of another rate hike on May 3 this year. (the current market valuation is a 48,4% chance of an increase of 25 basis points). Even within one week, the market can drastically change its mind regarding even the nearest path of the FED rate (which is presented in the chart below).
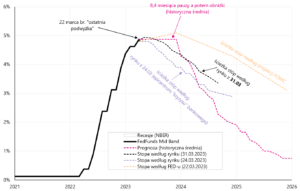
W. 6 The Fed reference rate and the various future paths of this rate (by market, projection of FOMC members and by historical average). Source: own study, FED, cmegroup.com
Can stock markets attack historic highs in the meantime? This is possible in the short term. Although in the case of the S&P500 it seems to be out of reach (16,7% is missing), but e.g. in the case of the DAX index, it is only 4,1% short of the all-time high. If this happens, we will certainly read about it in virtually every commentary on the markets. Of course, you should also remember one of the old Wall Street sayings that "markets are not the economy."
Why is the current cycle not like the previous ones? There are several reasons:
- We now have a post-Covid economy, and Covid generated: (i) huge savings as a result of the stimulus, (ii) then inflation, and additionally (iii) significantly changed the labor market,
- Accumulated extra savings are still being spent today, they mitigate the effects of inflation and make the economy stronger than in the standard cycle (i.e. more resistant to interest rate hikes),
- In the USA, up to 3,5 million people have permanently disappeared from the labor market due to Covid - which means a strong labor market and at the same time "resistant" to raising interest rates,
- The economy remains relatively strong with very high inflation,
- The Fed therefore has to raise rates higher or leave them high for longer (to beat inflation),
- In a standard stock market cycle, the stock market usually peaks after the last rate hike by the Fed (and not before the first hike, as is the case today),
- Although the stock market has been falling for 15 months - it still has to "wait" for the economy to weaken and corporate profits to fall,
- The key to the weakening of the American economy may be the labor market, and specifically the growing unemployment rate (which still does not want to rise),
- The FED will not be willing to cut rates much - if the unemployment rate does not start to rise,
- And in the meantime, high interest rates cause "cracks" in the economy (like the last banking crisis),
- Such cracks are something "natural in the cycle" and may ultimately accelerate the slowdown in the economy and the start of the cycle of interest rate cuts by the Fed.
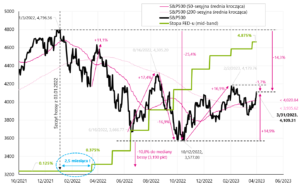
In the chart below, we present the peak of the previous bull market against the background of the FED reference rate. Unusually compared to standard cycles, the peak occurred 2,5 months before the first rate hike by the Fed.
In the 2009-2020 cycle, the S&P500 climbed only after three interest rate cuts in 2019. In the 2002-2007 cycle, the S&P500 peaked in October 2007, after the first interest rate cut by the FED. The current "crossroads" between the stock market and the rate hike/cut cycle by the FED is most similar to the years 2000-2002, when the first rate cut came 9 months after the S&P 500 rally. Indeed, the slump of 2000-2002 was the longest in post-war history and lasted 31 months (March 2000 – October 2002). The current bear market is also likely to be long, as stocks fell too "early" compared to the actual rate hike/cut cycle (in other words, inflation spooked the stock market quickly, but had a very slow impact on the economic downturn). Unless, in the meantime, we see new highs on the S&P500 and they will "reset the bear market".
The chart below shows a comparison of the 2000-2002 stock markets and the current bear market. March 25 we just crossed the median length of bear markets after WWII. Details in the chart below.
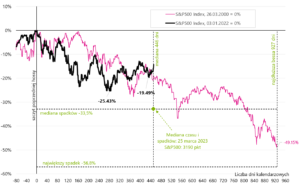
W. 8 Median size of declines and duration of bear markets on the example of 11 bear markets since 1948 for the S&P500. Comparison of declines from 2000-2002 to the current situation. Source: own study, stooq.pl
Why is the current market not like historical bear markets? If we look at the 15 largest growth corrections during the four bear markets in 1973-1974, 2000-2002, 2008-2009 and 2022 (bear-market rally increases), the current rebound of the S&P500 from the low of October 12.10.2022, 2022 does not fit in historical analogies. Certainly, the current market is not like previous bear markets (we should be much lower now if the increases from the XNUMX low were to resemble historical upward corrections in the bear market).
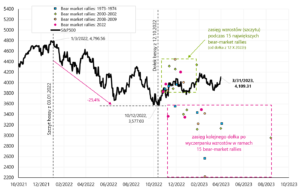
W. 9 S&P500 against 15 bear-market rallies during previous bear markets. Source: own study, stooq.pl
Therefore, is the current market similar to the beginnings of previous bull markets? Assuming a market bottom on October 12.10.2022, XNUMX, the historical comparison looks like this:
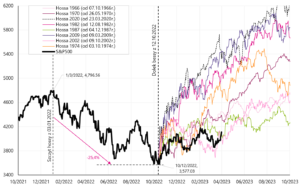
W. 10 The S&P500 against the backdrop of 8 historical bear markets (from the low of October 12.10.2022, XNUMX). Source: own study, stooq.pl
As you can see, we are still in the "weakest" reflections from the bear market (the boom from the 2002 and 1987 lows). But 2-3 months of a sideways trend around 4000 points on the S&P500 would suffice and we would be completely out of historical analogy.
Overall, it can be summed up that the current market is historically "between a bear and a bull" and does not resemble previous analogous situations. The situation is similar with the crossover between the stock cycle and the cycle of rate hikes/cuts by the Fed, not to mention the unusually strong economy despite the increase in rates from zero to 5%. We have presented how the situation on the markets and the economy may develop further in 4 scenarios, including our subjective probability of occurrence of individual scenarios.
Summation
In the past week, the American S&P500 rose by 3,48% and it was the third consecutive week of growth. If we add to this the "calming down" crisis in the banking sector (at least from the market's perspective), it opens the way to possible further increases in shares in the next week, and even throughout April.
To give you an idea of what might happen, we've gone back to the 4 scenarios described a week ago and are slightly tweaking their probabilities (compared to last week). The current cycle in the stock market is hard to place in any historical analogy (at the moment). We are a bit suspended between a new bull market and a possible continuation of the bear market. As usual in such situations, the key will be the monetary policy of the US Fed. It is difficult to have a lasting boom in the markets without interest rate cuts (which still have to wait).
About the Author
 Jaroslaw Jamka - Experienced fund management expert, professionally associated with the capital market for over 25 years. He holds a PhD in economics, a license of an investment advisor and a securities broker. He personally managed equity, bond, mutli-asset and global macro cross-asset funds. For many years, he managed the largest Polish pension fund with assets over PLN 30 billion. As an investment director, he managed the work of many management teams. He gained experience as: Member of the Management Board of ING PTE, Vice-President and President of the Management Board of ING TUnŻ, Vice-President of the Management Board of Money Makers SA, Vice-President of the Management Board of Ipopema TFI, Vice-President of the Management Board of Quercus TFI, Member of the Management Board of Skarbiec TFI, as well as Member of Supervisory Boards of ING PTE and AXA PTE. For 12 years he has specialized in managing global macro cross-asset classes.
Disclaimer
This document is only informative material for use by the recipient. It should not be understood as an advisory material or as a basis for making investment decisions. Nor should it be understood as an investment recommendation. All opinions and forecasts presented in this study are only the expression of the author's opinion on the date of publication and are subject to change without notice. The author is not responsible for any investment decisions made on the basis of this study. Historical investment results do not guarantee that similar results will be achieved in the future.


![Forex Club – Tax 9 – Settle tax on a foreign broker [Download the Application] Forex Club - Tax 9](https://forexclub.pl/wp-content/uploads/2024/02/Forex-Club-Podatek-9-184x120.jpg?v=1709046278)
![Trading View platform – solutions tailored to the needs of traders [Review] trading view review](https://forexclub.pl/wp-content/uploads/2024/03/trading-view-recenzja-184x120.jpg?v=1709558918)
![How to connect your FP Markets account to the Trading View platform [Guide] fp markets trading view](https://forexclub.pl/wp-content/uploads/2024/02/fp-markets-trading-view-184x120.jpg?v=1708677291)
![How to invest in ChatGPT and AI? Stocks and ETFs [Guide] how to invest in chatgpt and artificial intelligence](https://forexclub.pl/wp-content/uploads/2023/02/jak-inwestowac-w-chatgpt-i-sztuczna-inteligencje-184x120.jpg?v=1676364263)


![WeWork – the anatomy of the collapse of a company valued at $47 billion [WeWork, part II] wework bankruptcy story](https://forexclub.pl/wp-content/uploads/2024/04/wework-bankructwo-historia-184x120.jpg?v=1711729561)
![Adam Neumann – the man who screwed up Softbank [WeWork, part AND] adam neumann wework](https://forexclub.pl/wp-content/uploads/2024/04/adam-neumann-wework-184x120.jpg?v=1711728724)


![How to transfer shares to another brokerage office [Procedure description] how to transfer shares to another brokerage house](https://forexclub.pl/wp-content/uploads/2024/03/jak-przeniesc-akcje-do-innego-biura-maklerskiego-184x120.jpg?v=1709556924)

![The most common mistakes of a beginner trader - Mr Yogi [VIDEO] Scalping - The most common mistakes of a beginner trader - VIDEO](https://forexclub.pl/wp-content/uploads/2024/03/Scalping-Najczestsze-bledy-poczatkujacego-tradera-VIDEO-184x120.jpg?v=1711601376)
![Learning patience: No position is also a position - Mr Yogi [VIDEO] Scalping - Learning patience - No position is also a position - VIDEO](https://forexclub.pl/wp-content/uploads/2024/03/Scalping-Nauka-cierpliwosci-Brak-pozycji-to-tez-pozycja-VIDEO-184x120.jpg?v=1710999249)
![When to exit a position and how to minimize losses - Mr Yogi [VIDEO] Scalping - When to exit a position and how to minimize losses - VIDEO](https://forexclub.pl/wp-content/uploads/2024/03/Scalping-Kiedy-wyjsc-z-pozycji-i-jak-minimalizowac-straty-VIDEO-184x120.jpg?v=1710336731)


