


Pepsi Co. - it's much more than sweet drinks [Guide]

The period of increased inflation is, on the one hand, a threat and, on the other hand, an opportunity for many enterprises. Companies that have the so-called pricing power, i.e. the potential to increase your costs per customer. The owners of strong consumer industries have the potential for a price increase. In today's article, we will present operational activities PepsiCo, which is one of the largest companies operating in the drinks and snacks market. The company belongs to the S&P 500 index, which brings together the largest publicly listed companies in the United States. At the end of March 30, 2022, the company's capitalization was in excess of $ 229 billion. Pepsi employed 2021 employees at the end of 309, 000 of them in the United States alone.
Pepsi Co. sells its products in over 200 countries and territories. The two main groups of products are beverages and snacks (salty and sweet). It is also worth mentioning that in 2022 PepsiCo started distributing Hard MTN Dew. It is an alcoholic beverage produced by a publicly traded Boston Beer Company. The alcohol content of the drink is 5%.
In its financial statements, the company divides its activities into seven segments:
- FLNA (Frito-Lay North America)
- QFNA (Quaker Foods North America)
- PBNA (PepsiCo Beverages North America)
- LatAm (Latin America)
- Europe
- AMEASA (Africa, Middle East, South Asia)
- APAC (Asia Pacific, Australia, New Zealand, China)
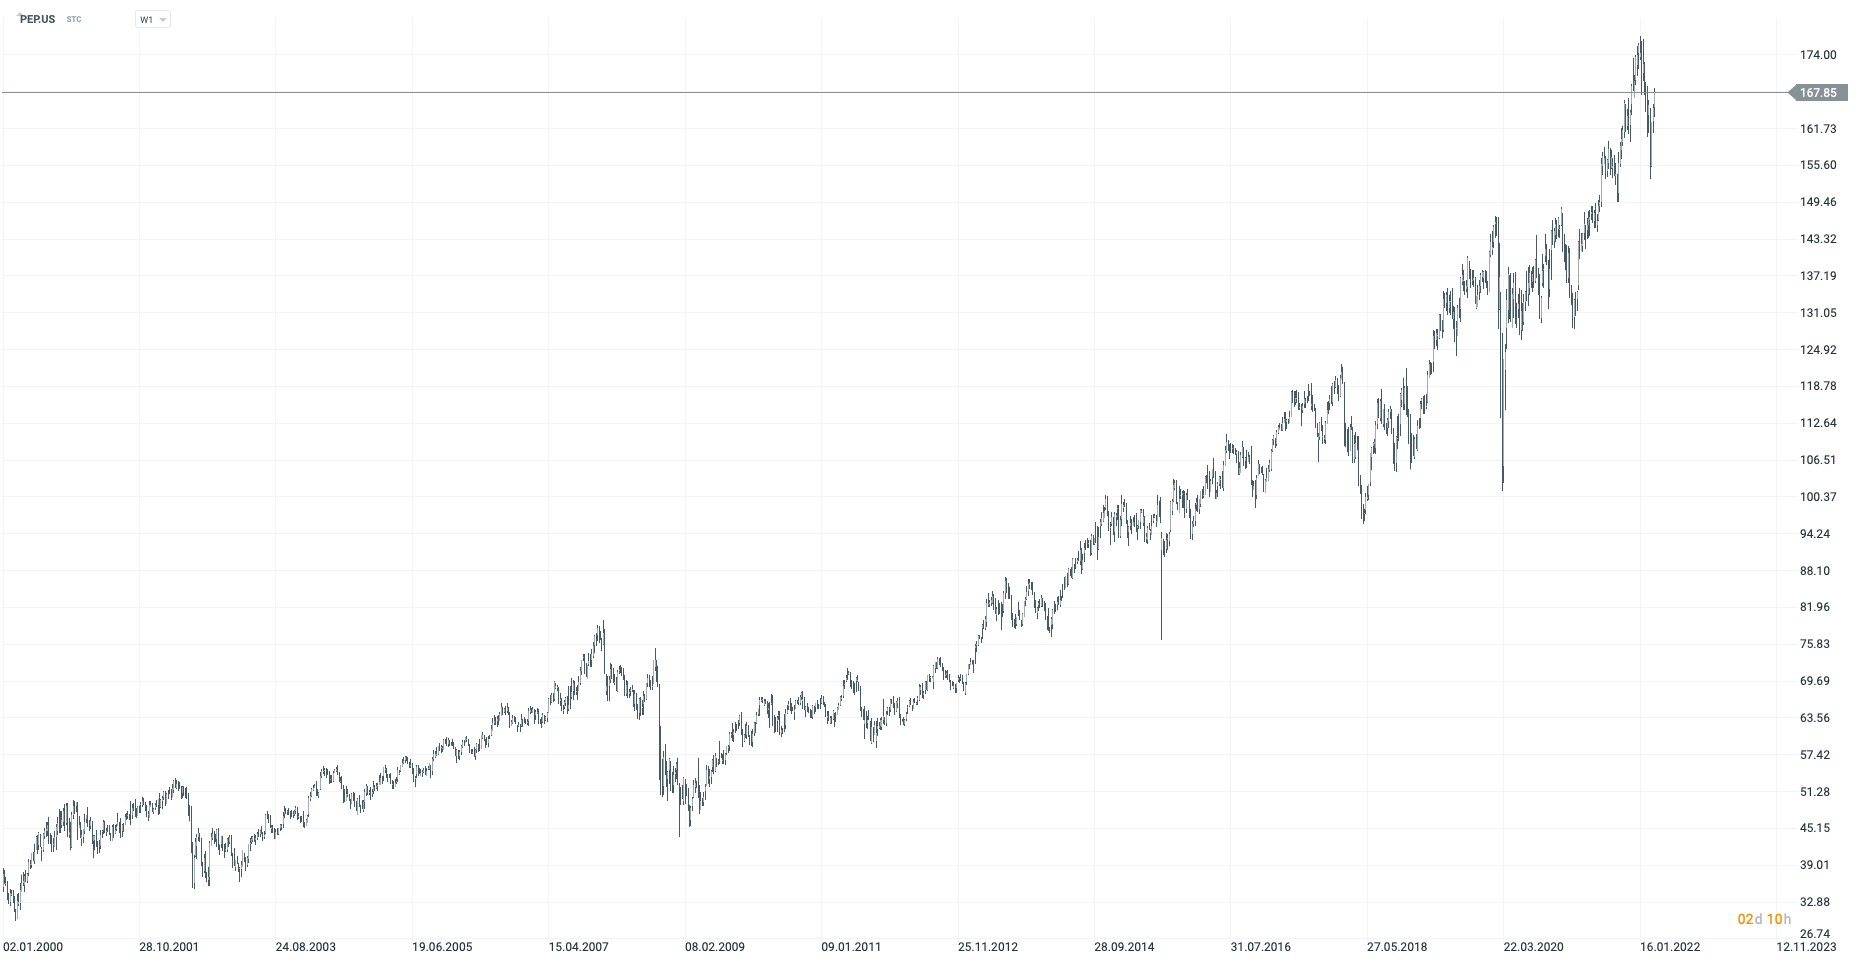
Pepsi Co. stock chart, interval W1. Source: xNUMX XTB.
Frito-Lay North America (FLNA)
Unlike Coca-Cola, Pepsi thanks to the acquisition of Frito Lay has a strong business leg focused on selling snacks. PepsiCo merged with FritoLay in 1965. FLNA is the segment responsible for the sale of savory snacks in North America. FLNA is responsible for the production, distribution and sale of salty snacks under the Frito-Lay brand. Frito-Lay is owned by brands such as Doritos, Fritos, Lay's, Ruffles and Tostitos. In addition, FLNA has a joint venture with the Strauss Group, which produces, distributes and sells Sabra brand dips.
Net revenues increased by 2021% in 8 due to an increase in production volume and an increase in prices. In terms of volume, sales increased by 2%. In addition to better sales of the existing products, the acquisition of BFY Brands Inc. had an impact on better volume sales. The acquisition of BFY Brands more than compensated for the weaker sales of Tostistos (a double-digit decline in sales). In the same period, the operating profit increased by 5,5%, ie much lower than the recognized revenues. One of the reasons was the increase in raw material prices, which reduced the operating profit by 4 percentage points. Profitability was improved by the increase in production and transportation efficiency introduced, which partially covered the higher raw material costs.
| $ million | 2019 | 2020 | 2021 |
| revenues | 17 078 | 18 189 | 19 608 |
| operational profit | 5 258 | 5 340 | 5 633 |
| operating margin | Present in several = 30,79% | Present in several = 29,36% | Present in several = 28,73% |
Quaker Foods North America (QFNA)
Quaker Foods is a brand acquired by PepsiCo in 2001 for approximately $ 14 billion. This was a controversial step and was considered by some analysts to be a waste of the company's capital. For more than 20 years, thanks to the acquisition of Quaker, Pepsi has an exposure in the segments of oatmeal, cereal, granola bars and pasta. This segment also includes Pearl Milling Company syrups and Rica-A-Roni products. Products from the QFNA segment are sold to independent distributors and stores.
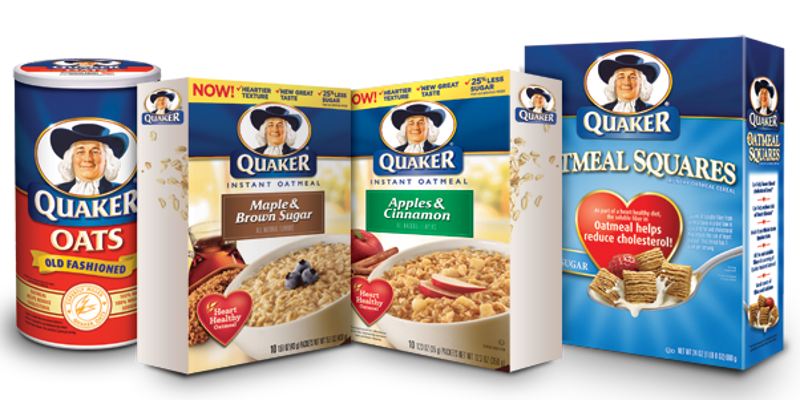
Source: worldbakers.com
In 2021, this segment experienced considerable problems. Contrary to other segments, it did not report a significant increase in revenues. The main reason was the very weak sales volume, which fell by 7% year-on-year. The main reason was the very poor sale of syrups for pancakes and cereals. Sales of these products fell at a double-digit pace. Other product groups, such as oatmeal, also recorded smaller drops (a one-digit drop in revenues). At the same time, the influence of the exchange rate also had a slightly negative impact on the amount of revenues. However, the volume drops were covered by the price increase. Although the company managed to raise its prices, it was not able to pass all costs onto the customer. This resulted in a decrease in operating profit by as much as 14% y / y. The reason was the increase in transport costs or higher raw material prices. The cost of raw materials alone decreased the operating result by 8 percentage points.
| $ million | 2019 | 2020 | 2021 |
| revenues | 2 482 | 2 742 | 2 751 |
| operational profit | 544 | 669 | 578 |
| operating margin | Present in several = 21,92% | Present in several = 24,40% | Present in several = 21,05% |
PepsiCo Beverages North America (PBNA)
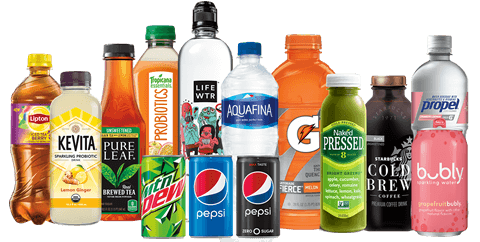
Source: pepsibeveragefacts.com
It is a segment that includes beverages consisting of such mothers as Pepsi, Propel, Aquafina, Mountain Dew, Gatorade. The company realizes that the decrease in sugar consumption in society has a negative impact on the sale of the company's products. For this reason, the company introduces the "Zero" product line, which is less caloric than "normal" products. In addition to the production and sale of beverages in this segment, the company also bottles its beverages. PBNA has its own bottling plants, finished products are sold to independent distributors and stores. It is worth adding that the company also has agreements with independent bottlers, which allows the company to be more flexible in meeting customer demand. Pepsi has joint ventures to sell ready-to-drink tea and coffee. Lipton Iced Teas are sold in partnership with Unilever. In turn, coffee-based drinks are sold in partnership with Starbucks. In North America, Pepsi produces and distributes drinks under the license of Keurig Dr. Pepper (Crush, Dr Pepper, Schweppes). In 2022, Pepsi restructured the PBNA. Shares in brands such as Tropicana, Naked and smaller juice brands were sold to PAI Partners. Pepsi nadaj has a 39% share after the sale of some shares in the juice segment.
Sales of beverages in North America in 2021 increased by approximately 12% y / y. It was caused both by an increase in sales volume (+ 6% y / y) and an increase in prices (+ 5% y / y). The main engine of the growth in sales volume in 2021 were non-carbonated beverages (NCB), the sales of which increased by 7% y / y. The quantitative increase in NCB-type beverages sold was driven by a double-digit increase in sales of bottled water and energy drinks. The Gatorade brand and tea-based beverages were much slower (single-digit). It is worth noting that sales of carbonated beverages increased by 4% in the same year. It is worth noting that Pepsi's operating result was higher by 26% y / y, the reasons were, among others, savings in the production phase and lower tax costs (relief, etc.) caused by COVID-19 pandemic. Like other segments, the production of beverages also struggled with higher raw material costs.
| $ million | 2019 | 2020 | 2021 |
| revenues | 21 730 | 22 559 | 25 276 |
| operational profit | 2 179 | 1 937 | 2 442 |
| operating margin | Present in several = 10,03% | Present in several = 8,59% | Present in several = 9,66% |
Latin America (LatAm)
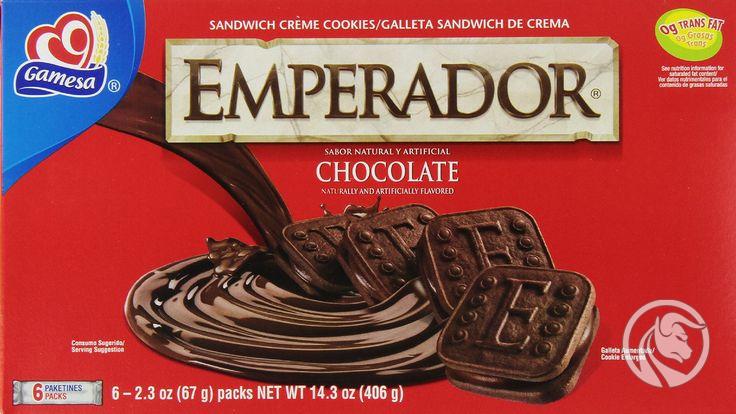
Source: pinterest.com
Another segment is the Latin American market. Pepsi does not separate the Frito-Lay, Quaker and drinks segments in them. In the LatAm segment, the company produces, distributes and sells salty snacks from the following brands: Cheetos, Doritos, Emperador, Lay's, Mabel, Marias Gamesa, Ruffles, Sabritas, Saladitas and Tostitos. The beverages segment sells beverages such as 7Up, Mirinda, Pepsi, Sa Carlos, Toddy, Gatorade and H2oh !. The drinks are sold to authorized, independent bottlers and then sold to independent distributors and stores. The Quaker segment comprises the company's main products (oatmeal, breakfast cereals). It is also worth mentioning that on the Latin American market, Pepsi cooperates with Unilever (joint ventures) in the sale of Lipton iced tea.
PepsiCo's revenues in Latin American countries increased by 17% y / y. The increase was caused by better sales volume than a year ago (+ 4%) and a price increase (+ 10%). Sales of snacks in terms of volume increased by 2021% in 3,5, mainly due to good sales in Brazil i Mexico. In the beverages segment, the volume increased by 8%. Good sales of beverages resulted, among others, from double-digit sales in Argentina and Chile. Latin American market operating profit increased 33%, mainly due to revenue growth, improved production efficiency, and lower tax burdens in Brazil due to COVID-19 corporate aid. These factors more than offset the cost of rising raw material prices for snacks and drinks.
| $ million | 2019 | 2020 | 2021 |
| revenues | 7 537 | 6 942 | 8 108 |
| operational profit | 1 141 | 1 033 | 1 369 |
| operating margin | Present in several = 15,14% | Present in several = 14,88% | Present in several = 16,88% |
Europe
This is one of the most important segments for the company. This is because the market alone has potentially hundreds of millions of wealthy consumers. As in the LatAm market, PepsiCo does not separate further segments. For this reason, reported sales in Europe include beverages, snacks and Quaker products. In the case of snacks, products of such brands as Chhetos, Lay's, Doritos, Ruffles and Walkers are sold in Europe. However, in the case of beverages, it is the leading brands in terms of sales Pepsi, 7UP and Mirinda. Of course, PepsiCo is aware that in European society sugar is "under censorship". For this reason, it develops sales of "zero" products such as Diet Pepsi or Pepsi Max. It is worth mentioning that PepsiCo had a strong presence in Russia, where in 2010 it acquired a majority stake in Wimm-Bill-Dann for over $ 4 billion, which owned such brands as "We like Sad" and "Agusha". In other European countries, the company is also trying to develop its offer of non-carbonated beverages and bottled water. In the case of juices, just like in the USA, PepsiCo owns 39% of shares in joint ventures with PAI Partners (this applies to brands such as Tropicana or Naked). Also in this market, Pepsi cooperates with Unilever in selling ready-made drinks under the Lipton brand (eg Lipton Ice Tea). It is worth adding that in Europe, PepsiCo manages its own bottling plants and distribution centers.
Net revenues in the European market increased by 9% during the year. Sales volume increased by 2021% in 4,5, while the price increase translated into an increase in revenues by 4 percentage points. The snack market grew by 4% in volume, mainly due to double-digit growth in Turkey and good sales in Russia and Poland. This more than compensated for the one-digit decline in UK sales. In the beverages market, sales increased by 8% (volume). This was due to double-digit growth in Russia, Turkey and the United Kingdom. Sales in France also looked very good (increased by over 5%), while the German market did not perform well (sales dropped). The increase in revenues did not translate into an improvement in the margin. The operating profit in the European market decreased by 4,5% y / y. The reason was an increase in raw material costs (+ 28% y / y) and restructuring costs, which reduced the operating profit by 2,5%. The increase in costs was covered by lower public levies (reliefs during COVID-19) and improved operational efficiency. It is worth mentioning that the implementation of the new ERP (Enterprise Resource Planning) resulted in a temporary reduction in the efficiency of operations in the United Kingdom in Q2021 XNUMX.
| $ million | 2019 | 2020 | 2021 |
| revenues | 11 728 | 11 922 | 13 038 |
| operational profit | 1 327 | 1 353 | 1 292 |
| operating margin | Present in several = 11,31% | Present in several = 11,35% | Present in several = 9,91% |
Africa, Middle East and South Asia (AMESA)
Source: betterretailling.com
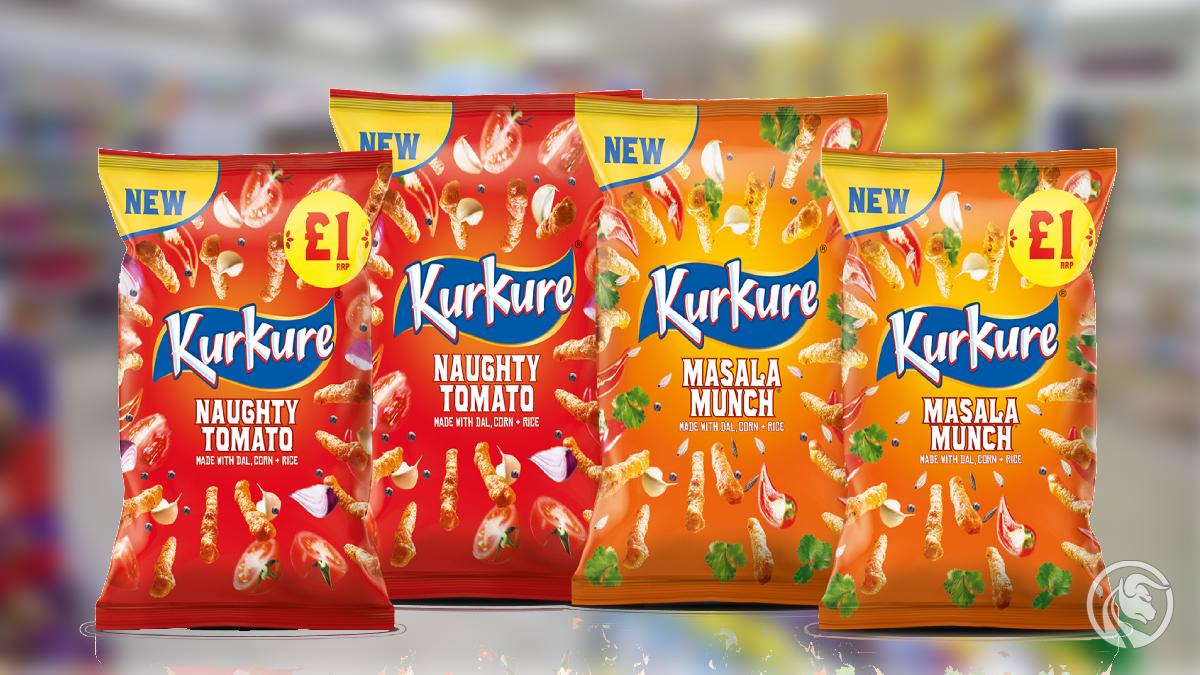
Another segment that PepsiCo gives off is AMESA, i.e. African, Middle Eastern and South Asian countries. These markets are particularly attractive to the company from a long-term perspective. It is true that households in most AMESA countries have much lower incomes than European countries as well as Canada and the United States, they can boast of much faster wage growth and a huge population. It is not surprising then that PepsiCo is trying to be present in countries with a very good demographic structure (mainly African countries). The AMESA segment includes revenue from both the snacks, beverages and Quaker products. In this market, the company sells, in addition to global brands, also local brands such as Kurkure, Sasko, Spekko, and White Star. The beverages segment is dominated by brands such as 7UP, Mirinda, Pepsi, Aquafina, Mountain Dew and Pepsi. As in Europe, PepsiCo has its own bottling and distribution facilities. However, it also supports the sale of its products to independent distributors.
Revenues in the AMESA segment increased by 33% y / y, but the acquisition of Pioneer Foods was responsible for as much as 14 percentage points of growth. On the other hand, 7% of the increase in revenues was due to the increase in volume and 4% of the increase in prices. The Indian and Pakistani markets performed very well in the snacks segment, which both grew at a double-digit pace (net of the impact of the Pioneer Foods acquisition). The Middle East market was also doing well. On the other extreme, the South African market shrank by several percent after deducting the impact of acquisitions. In the Beverage segment, volume grew by 20% over the year, mainly due to strong sales in India and Pakistan. Double-digit growth rates were also recorded in the Middle East countries. Operating profit increased by 43% during the year, of which 31 percentage points were due to the acquisition of Pioneer Foods. Higher sales and improved operational efficiency made it possible to more than cover the increase in the cost of raw materials.
| $ million | 2019 | 2020 | 2021 |
| revenues | 3 651 | 4 573 | 6 078 |
| operational profit | 671 | 600 | 858 |
| operating margin | Present in several = 18,38% | Present in several = 13,12% | Present in several = 14,11% |
Asia Pacific, Australia and New Zealand and China Region
Source: pepsiphilippines.com
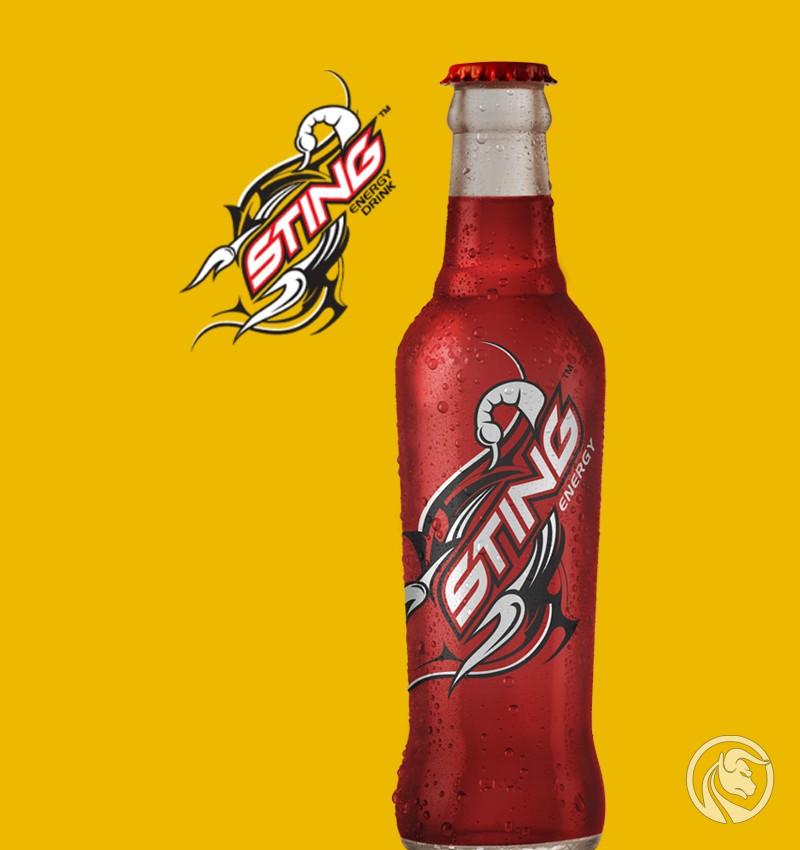
The last segment separated by PepsiCo is APAC. This segment also has a geographical breakdown, not a product breakdown. As a result, it includes both snacks, drinks and Quaker products. In the snacks segment, the best-selling products from the Cheetos, Doritos and Lay's brands. However, the portfolio also includes local brands, the best example of which is BaiCaoWei. In the beverage segment, well-known brands (Mirinda, 7UP, Pepsi) and the regional Sting drink are selling very well. The Tropicana brand is being developed on the APAC market in partnership with Tingyi. The beverages segment is sold to independent distributors and stores. It is worth mentioning that PepsiCo in this market, apart from finished products, also sells concentrates used in the production of beverages.
The net revenues of this market increased by 2021% in 34. Almost half of this increase (15 percentage points) was due to the Be & Cheery acquisition. In the APAC market, sales by volume increased by 12% y / y. This was the best result of all segments reported by PepsiCo. The main reason was very good sales in the beverages market (+ 13% y / y). The Chinese market had the greatest impact, growing at a double-digit pace in 2021. The Filipino and Thai markets developed much slower, where the volume of beverages sold grew at a single-digit pace. PepsiCo did very poorly on the Vietnamese market (sales volume dropped). In the snack market, PepsiCo reported a 19% increase in volume, but the Be & Cherry acquisition was responsible for the 16 percentage points increase. In the snack segment, the Chinese market performed best, reporting double-digit growth rates. The operating profit of the APAC segment increased by 14% last year (2% is the effect of acquisitions). The slower increase in profit than in revenues resulted from the increase in the costs of raw materials and marketing campaigns aimed at increasing the recognition of the company's brands among consumers.
| $ million | 2019 | 2020 | 2021 |
| revenues | 2 919 | 3 445 | 4 615 |
| operational profit | 477 | 590 | 673 |
| operating margin | Present in several = 16,34% | Present in several = 17,12% | Present in several = 14,58% |
What is the distribution of products like
The company's products are delivered through the DSD model (direct-store-delivery), delivery to a warehouse or through an external distribution network. In the DSD model, PepsiCo products are delivered directly to the customer's stores. Delivery is organized both by own resources and through partnerships with external bottlers or distributors. The delivery of DSD most often concerns products that require frequent deliveries.
In the warehouse model, the company delivers its products to customers' warehouses, who then independently replenish the inventory of their stores. It is a cheaper method of delivering drinks and snacks. This delivery model is used for products that have a longer sales time.
The use of external distributors is aimed at cost optimization and usually applies to special sales models or places where the own distribution network is not fully developed. The company uses the services of external distributors in the case of vending machines or deliveries of snack products to restaurants, companies, schools and stadiums.
Suppliers
Vegetables, fruits and grains are used in the production of Quaker snacks, drinks and products. The company has the greatest demand for apples, oranges, corn, potatoes, pineapples, grapefruits, rice, cereals, milk and paprika. In addition, the company consumes a large amount of juice concentrates, essences of flavors, oil, sweeteners and sugar. You cannot forget about water, which is also used in the production process. Pepsi Co. also consumes a large amount of PET bottles, glass, aluminum material etc. The company tries to obtain some of the resources from recycling, but not in all areas it is able to implement the "zero waste" strategy.
Due to the fact that the company is not completely vertically integrated, it has to buy raw materials and semi-finished products on the market. Pepsi Co. has a specialized purchasing team that tries to buy products at an affordable price and minimize the risk of fluctuations in raw material prices. Derivatives are used for this purpose, among others. Another option that the company uses is signing contracts for a fixed price. These activities make it possible to better manage the price of the company's products, which allows it to achieve a relatively stable operating margin.
Pepsi Co. customers
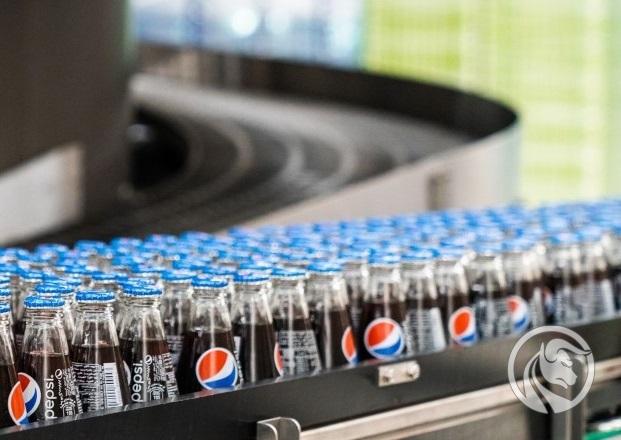
Pepsi bottling plant, source: itsupplychain.com
PepsiCo has a very fragmented customer base. The company's clients include local grocery stores, discount stores, supermarkets, e-commerce sellers, and external distributors. The company's biggest customer is the Walmart chain, which is responsible for 13% of the company's revenues. If the cooperation with this international supermarket chain is terminated, revenues and profits in segments such as FLNA, QFNA and PBNA would be significantly reduced. It is worth noting, however, that subsequent customers are not responsible for more than 5% of the company's revenues. This is on the upside, as the owner of the big brands has the advantage in the negotiations, not the local sales network. However, negotiations do not always go smoothly. The customers of the Polish chain Biedronka, which stopped selling Pepsi Co. products, found out about it. due to non-renewal of the contract.
Pepsi Co. also sells its products to independent bottlers who have exclusive contracts and can sell the finished product in the area defined in the contract. The company also tries to encourage its customers to sell more. Independent distributors and stores receive special discounts depending on sales volume. Agreements are usually signed for a year and after this period they are negotiated, which sometimes allows the company to raise sales limits on which rebates are dependent.
The financial results of Pepsi Co.
Historically, the company generates approximately 45% of its annual sales from beverages. The proportions have not changed over the last three years. It is worth noting that on the Latin American market, the sale of beverages accounts for approximately 10% of the total segment revenues. In the APAC market, beverages account for approximately 20% of all sales, while in AMESA - 30%. Outside of North America, only the European market generates more revenue from drinks than from snacks (55% -45%).
Despite having strong consumer brands, which should translate into "pricing power", the company's operating margin is systematically falling. Between 2017 and 2021, it decreased by almost 2 percentage points. The likely higher inflation in the coming years could be a difficult environment for the company. In the scenario where it is not possible to transfer all costs to the customer, the operating margin will decrease further. The current level of the margin is at the level of the average from 2012-2013. The company still has a very stable business (the "COVID-19 effect" is not visible), which classifies the company among stable companies generating decent profits. It is worth noting that the company effectively allocates its own capital. Pepsi's ROE never dropped below 40% in the period under review. Moreover, the return on assets is also decent and in 2021 it was 8,2%.
| million USD | 2017 | 2018 | 2019 | 2020 | 2021 |
| revenues | 63 525 | 64 661 | 67 161 | 70 372 | 79 474 |
| operational profit | 10 627 | 10 376 | 10 719 | 10 936 | 11 798 |
| operating margin | Present in several = 16,73% | Present in several = 16,05% | Present in several = 15,96% | Present in several = 15,54% | Present in several = 14,85% |
| net profit | 4 853 | 12 513 | 7 314 | 7 120 | 7 618 |
| equity capital | 10 981 | 14 602 | 14 868 | 13 552 | 16 151 |
| ROE | Present in several = 44,19% | Present in several = 85,69% | Present in several = 49,19% | Present in several = 52,54% | Present in several = 47,17% |
source: own study based on the company's annual reports
Cash generated
The company generously shares the generated cash with shareholders. Over the past 5 years (2017-2021), Pepsi has generated approximately $ 32 billion in free cash (operating cash less capital expenditure). The funds were allocated to the payment of dividends ($ 26 billion) and the purchase of shares ($ 9,6 billion).
| $ million | 2017 | 2018 | 2019 | 2020 | 2021 |
| Cash flows from operating activities | 10 030 | 9 415 | 9 649 | 10 613 | 11 616 |
| CAPEX | -2 969 | -3 282 | -4 232 | -4 240 | -4 625 |
| FCF | 7 061 | 6 133 | 5 417 | 6 373 | 6 991 |
| dividend (-) | -4 472 | -4 930 | -5 304 | -5 509 | -5 815 |
| share buyback (-) | -2 145 | - 2 103 | - 3 114 | - 2 096 | -198 |
source: own study based on the company's annual reports
Debt structure
Pepsi has approximately $ 36 billion in interest debt, of which $ 3,87 billion is payable in 2022. The company has no problems with debt service. It is worth mentioning that most of the debt matures in the years 2027-2060 ($ 24,3 billion). The current interest rate on these liabilities has an effective interest rate of between 2,2% and 3,2%. Part of the fixed rate bonds were changed to variable rate bonds. For this purpose, interest rate derivatives were used.
Over the last 5 years, the company has significantly increased its debt, which can be seen both in nominal terms and in the ratio of net debt to EBITDA. It is worth mentioning that in 2012-2016 the company's net debt oscillated around $ 20 billion. The environment of low interest rates encouraged the company's management to use more debt, which resulted in an increase in financial leverage. However, the debt to EBITDA ratio is still at a reasonable level.
| billion GBP | 2017 | 2018 | 2019 | 2020 | 2021 |
| net debt * | 19 771 | 23 328 | 27 890 | 36 292 | 36 390 |
| EBITDA | 12 772 | 12 571 | 12 985 | 13 332 | 14 373 |
| debt / EBITDA | 1,55 | 1,86 | 2,14 | 2,72 | 2,53 |
* net debt also includes pre-tax financial liabilities to former employees. source: own study based on the company's annual reports
Competition
The snack and drink market is very competitive. Pespi Co. it has to compete for customers with both global brands operating in hundreds of countries and local producers of drinks and snacks with an established position. The company's greatest competitor is Coca-Cola, which has a very rich portfolio of beverage brands (including Coca-Cola, Sprite, Fanta). In addition, PepsiCo is still competing with companies such as Kellogg (best known for its flakes and chips), Kraft Heinz, Mondelez, Keurig Dr Pepper, Monster Beverage, Nestle, Red Bull or Utz Brands.
Due to the huge market saturation, PepsiCo has to compete with brand recognition (extensive marketing campaigns), price, product quality, packaging, news and respond to the changing tastes of customers (water, juices, less sugar).
Coca-Cola
The history of the company dates back to 1886. It is one of the most famous companies that produces and sells non-alcoholic beverages. The brands owned by the company include: Coca-Cola, Fanta, Schweppes, Sprite, Aquaris, CIel, Topo Chico, AdeS. Therefore, in addition to its strong portfolio of brands offering carbonated sweet drinks, the company also has segments of juices and bottled water. the company employs over 79 people. The company's headquarters is located in Atlanta (Georgia). The company's capitalization is $ 000 billion.
| $ million | 2018 | 2019 | 2020 | 2021 |
| revenues | 34 300 | 37 266 | 33 014 | 38 655 |
| operational profit | 10 203 | 10 625 | 9 990 | 11 321 |
| operating margin | Present in several = 29,74% | Present in several = 28,51% | Present in several = 30,26% | Present in several = 29,28% |
| net profit | 6 434 | 8 920 | 7 747 | 9 771 |
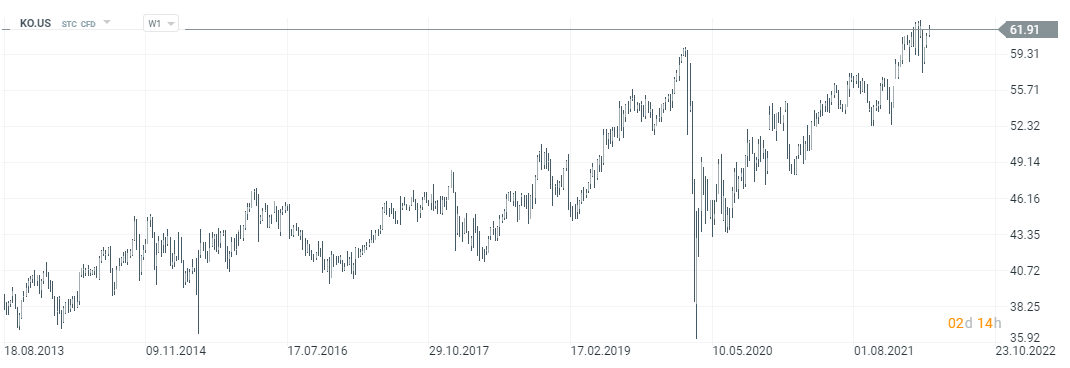
Coca-Cola stock chart, interval W1. Source: xNUMX XTB.
monster drink
The company was founded in 1985. In 2012, it changed its name from Hansen Natural Corporation to Monster Beverage Corporation. The company is a producer of energy drinks, carbonated sweet drinks, non-carbonated drinks, iced tea, lemonade, sports drinks and products based on coffee or milk. The main brand of the company is Monster. The company introduced a number of monster brand products to the market. These include Monster Energy, Java Monster, Muscle Monster, Espresso Monster, Punch Monster or Juice Monster. In addition, the company also sells NOS, Burn, Samurai and Gladiator drinks. The company's capitalization exceeds $ 40 billion.
| $ million | 2018 | 2019 | 2020 | 2021 |
| revenues | 3 807 | 4 200 | 4 598 | 5 541 |
| operational profit | 1 310 | 1 414 | 1 633 | 1 802 |
| operating margin | Present in several = 34,41% | Present in several = 33,67% | Present in several = 35,52% | Present in several = 32,52% |
| net profit | 993 | 1 107 | 1 409 | 1 377 |
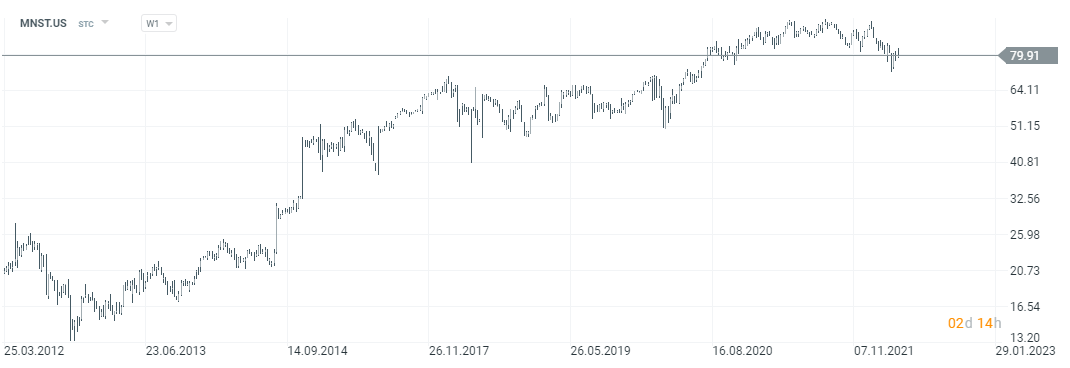
Monster Beverage stock chart, interval W1. Source: xNUMX XTB.
Kellogg
The company was founded in 1906. It is a company that specializes in the production of snacks and packaged food. So it is in part both a competitor to Quaker and Frito Lay. Kellogg is a producer of chips, crackers, cereals, pasta and vege products. It owns brands such as Pringles, Cheez-it, Corn Flakes and Crunchy Nut. The current capitalization of the company exceeds $ 20 billion.
| $ million | 2018 | 2019 | 2020 | 2021 |
| revenues | 13 547 | 13 578 | 13 770 | 14 181 |
| operational profit | 1 803 | 1 606 | 1 855 | 2 022 |
| operating margin | Present in several = 13,31% | Present in several = 11,83% | Present in several = 13,47% | Present in several = 14,26% |
| net profit | 1 336 | 960 | 1 251 | 1 488 |
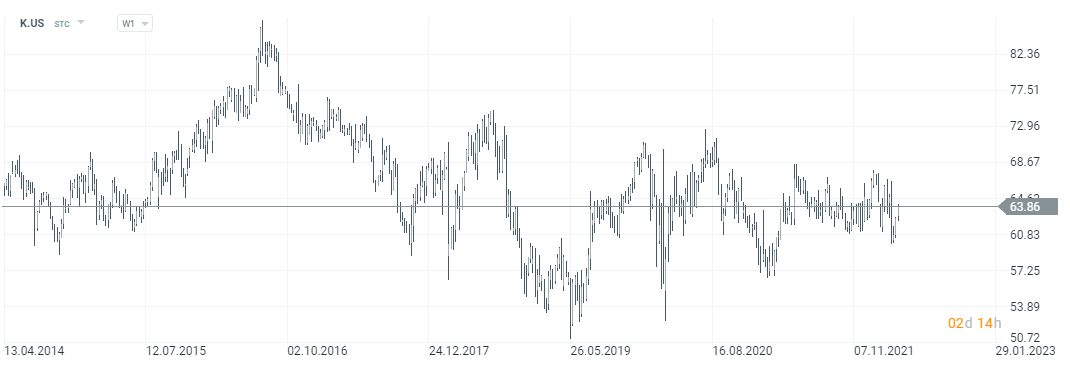
Kellog stock chart, interval W1. Source: xNUMX XTB.
Pepsi Co. as a dividend aristocrat
Pepsi is perfect for dividend investing. This is the company that is now A dividend aristocratbecause they have paid more dividends per share (DPS) every year for the past 49 years. In the last 10 years, the dividend paid by the company per share has almost doubled. The trend should be maintained in the coming years.
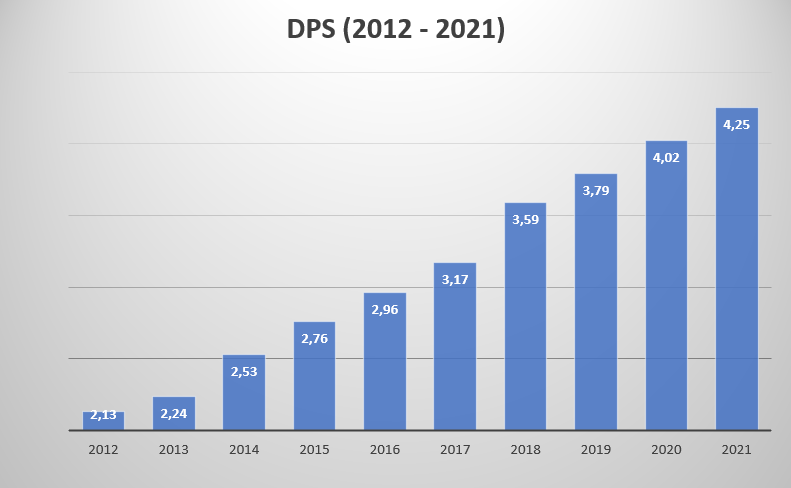
The increase in DPS is due to three factors:
- Increasing profits,
- Raising the payout ratio,
- Purchase of shares.
The higher the net profit, the larger the pool to be shared with the company's shareholders. In the case of Pepsi, between 2012 and 2021, net profit increased from $ 6,18 billion to $ 7,62 billion.
The payout ratio is the ratio of the dividend paid to the generated net profit. The higher the payout ratio, the smaller the room for dividend increase. Currently, it is 76%, while in 2016 it was 67%.
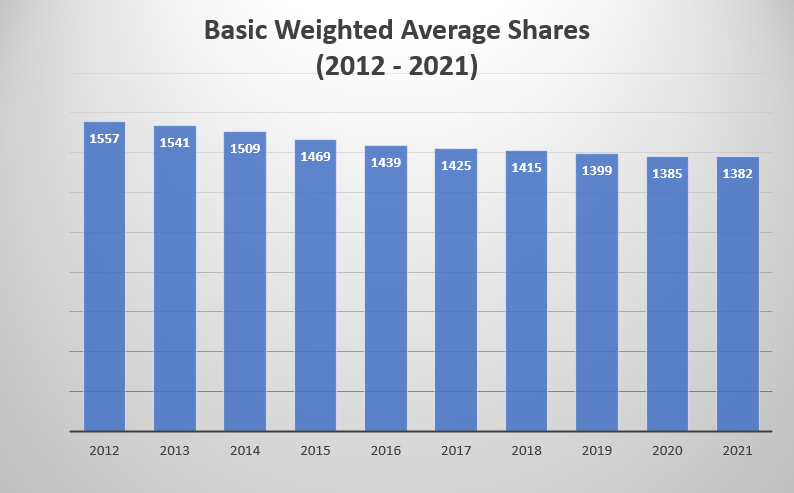
Share buyback is another engine for increasing dividends per share. The share buyback allows the dividend per share to increase even if the nominal value of the dividend paid does not increase. Over the last 10 years, the number of shares has decreased by 11,2%.
How You Can Invest in Pepsi
The company is listed on the US stock exchange as one of the components of the S & P500 index. In addition to investing in stocks, an investor can buy an ETF with exposure to American consumer goods market. One can give as an example iShares US Consumer Staples ETF. As of March 30, 2022, Pepsi was 10,23% by weight in this ETF. In addition, an investor may take advantage of derivatives that give him exposure to PepsiCo equities, for example in the form of CFDs.
Where to Invest in Pepsi Co. and ETF
An increasing number of forex brokers have quite a rich offer of stocks, ETFs and CFDs for these instruments.
For example on XTB Today, we can find over 3500 equity instruments and 400 ETFs, a Saxo Bank over 19 companies and 000 ETF funds.
| Broker |  |
||
| End | Poland | Denmark | Cyprus * |
| Number of exchanges on offer | 16 exchanges | 37 exchanges | 24 exchanges |
| Number of shares in the offer | approx. 3500 - shares circa 2000 - CFDs on shares |
19 - shares 8 - CFDs on shares |
approx. 3 - CFD on shares |
| The amount of ETF on offer | approx. 400 - ETF approx. 170 - CFD on ETF |
3000 - ETF 675 - CFD on ETF |
approx. 100 - CFD on ETF |
| Commission | 0% commission up to EUR 100 turnover / month | according to the price list | Spread depends on the instrument |
| Min. Deposit | PLN 0 (recommended min. PLN 2000 or USD 500, EUR) |
0 PLN / 0 EUR / 0 USD | PLN 500 |
| Platform | xStation | SaxoTrader Pro Saxo Trader Go |
Plus500 platform |
* PLUS500 CY offer
CFDs are complex instruments and come with a high risk of losing money rapidly due to leverage. From 72% to 89% of retail investor accounts record monetary losses as a result of trading CFDs. Think about whether you understand how CFDs work and whether you can afford the high risk of losing your money.
Summation
Pepsi is a stable company that is a free cash flow generating machine. Despite the unfavorable trend of "departing" customers from products based on sugar and fats, the company is constantly increasing its revenues. The company, despite decent margins and high free cash flow (FCF), cares about the effectiveness of the invested capital. For this reason, the company is constantly developing automation and cost reduction projects. The actions are expected to save $ 1 billion by the end of 2026. Pepsi is not heavily dependent on Russian business. This country is responsible for around 4% of the company's revenues. Ukraine's share is even smaller. Pepsi is a very well diversified company in terms of revenues, the best proof of which is the ownership of Frito Lay. Competitive Coca-Cola only operates in the beverage sector.
Pepsi is also closely following changes in consumer habits. It began to invest more in digitization and increasing the share of online advertising (also on mobile devices). Online sales are also being developed. In 2021, the 5 largest e-commerce markets generated $ 4 billion in revenues. The company is constantly expanding its portfolio of companies by taking over brands such as Pioneer Foods, Muscle Milk and Sodastream.. Sometimes, however, there is disinvestment. An example is the recent sale of the Tropicana and Naked brands to PAI Partners for $ 3,5 billion (Pepsi still owns 39% of the joint venture in North America and Europe).
The company has a secure debt-to-equity ratio of 2,58 and a decent net debt-to-EBITDA (2,53). This significantly limits the company's ability to buy back shares. With the current capitalization, a 2% share buyback would cost over $ 5 billion, plus dividend spending (around $ 5,8 billion), this is much more than the generated FCF. For this reason, earnings per share (EPS) will rather increase in line with the dynamics of net income. Stock purchases will not "accelerate" EPS growth.
However, it should be remembered that even the best company should be properly valued. The company's capitalization as of March 30, 2022 was approximately $ 229 billion. This results in high price to profit ratios (PE = 25) and price to free cash flow (P / FCF = 32,7). Of course, the high valuation is a consequence of the fact that Pepsi is a stable company that usually grows at a single-digit growth rate. The company shares its profit with shareholders by buying shares and paying dividends, which encourages investment by dividend investors.


