


The banking crisis continues, the markets are still turbulent

The past week brought increases on American shares (S&P500 +1,4%) and decreases on the Polish stock exchange (WIG20 -6,7%). We still have high volatility in bank stocks, but also in the bond market.
Despite many actions taken to bring the situation under control in the financial sector, the moods could not be fully calmed down. Even if the situation around the banks finally normalizes, will all the problems be behind us? I don't think so. While it is difficult to say whether there will be more bank runs, it can be said that "aggressive" raising interest rates has its price and consequences. In the medium term, more things may "break", with the tendency that it may first concern the financial markets, and then the real economy.
Still turbulent in the markets
Although the S&P500 increased by 1,4% last week, the moods do not want to calm down completely due to the crisis of confidence in banks. Our WIG Banks closes the week with a drop of 9,4%. The American iShares S&P500 Financial Sector ETF is down 5,9% in the past week, and its European counterpart is down 11,5% (iShares STOXX Europe 600 Banks UCITS ETF). As expected, regional banks in the US fell the most, as much as 14,3% (SPDR S&P Regional Banking ETF). The table below shows the details.
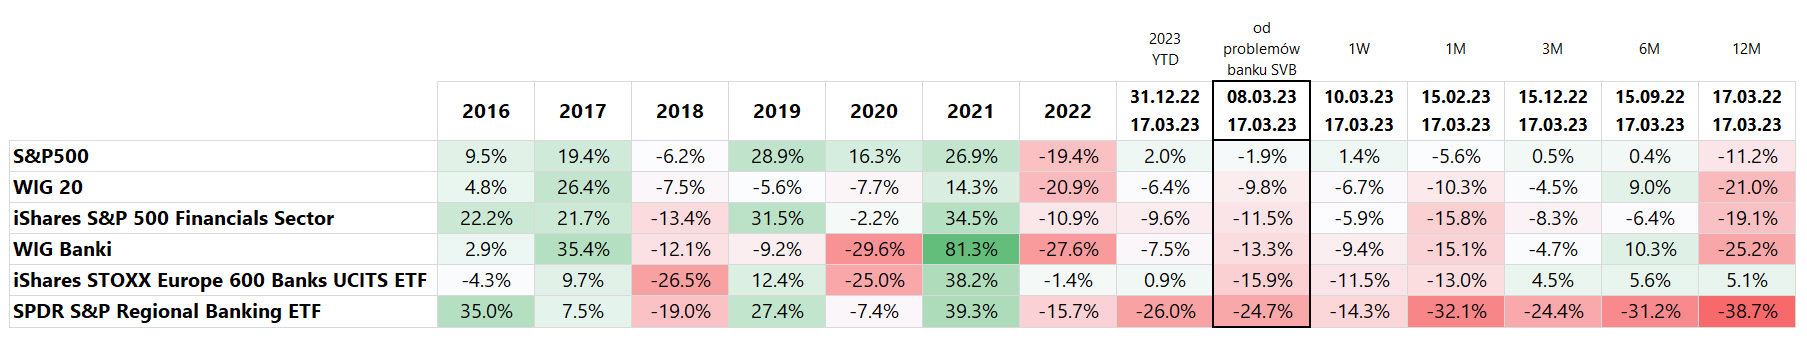
If we look from March 8 this year. (i.e. from the day before the outbreak of the crisis in the banking sector), European banks were the most affected (apart from American regional banks), whose index fell by almost 16% at that time (iShares STOXX Europe 600 Banks UCITS ETF). For the same period, the Polish WIG Banki index fell by 13,3%. The chart below presents the behavior of the main indices of the financial industry since March 8 this year.
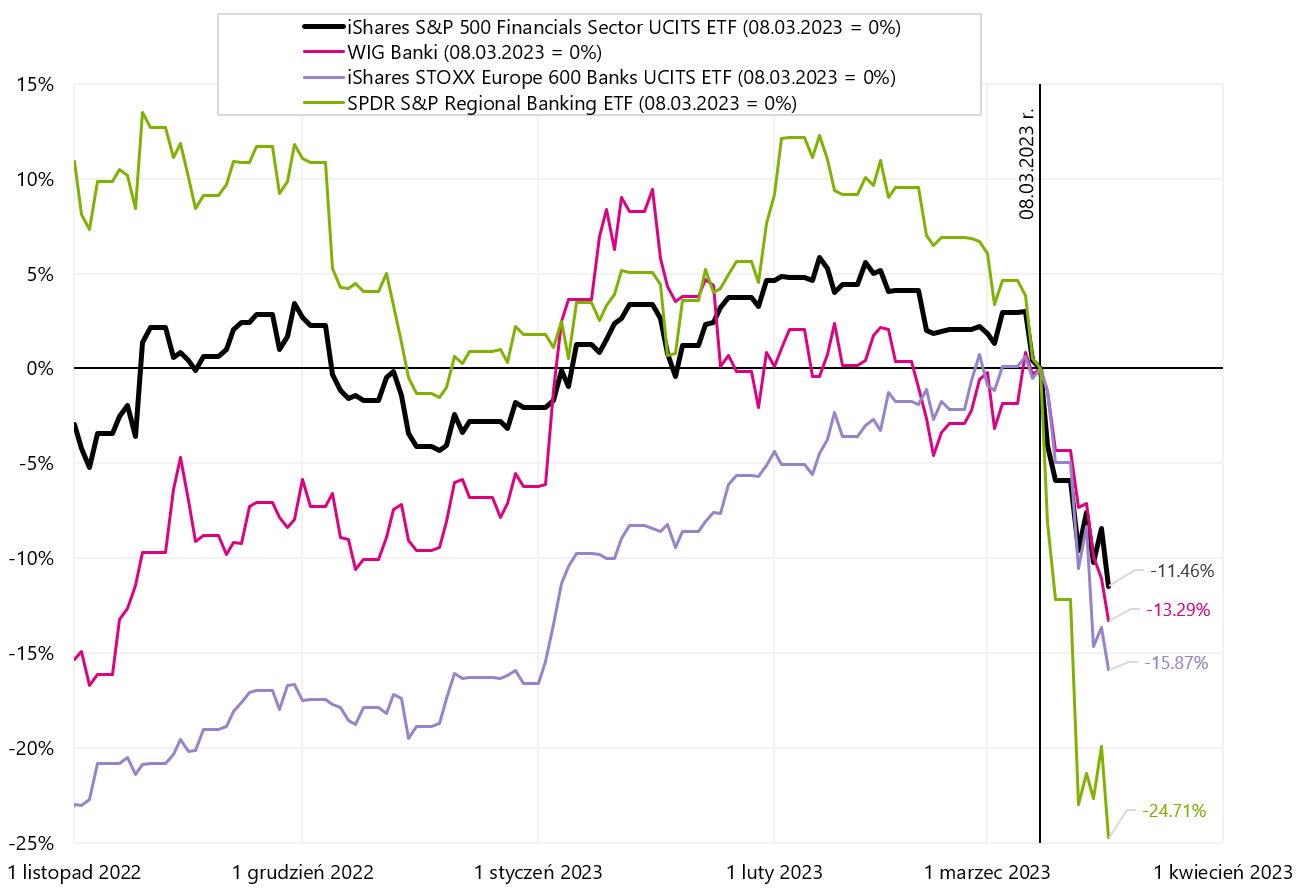
V.1 Selected banking indices from March 08.03.2023, XNUMX. Source: own study, stooq.pl, ishares.com
The main index of American companies The S&P500 is doing much better, and the "whole" crisis around the banking industry cost it only a 1,9% decline (so much has fallen since March 8 this year). Since the beginning of the year S & P500 is in the black with a result of 2,0%. From a local hill from February 2 this year. (i.e. the day before the very strong employment report in the US) fell 6,3% (which means a decrease of 18,3% from the peak of the previous bull market on January 3, 2022). Currently, the S&P500 index is below all three key averages: 50-, 100- and 200-day. Details are presented in the chart below.
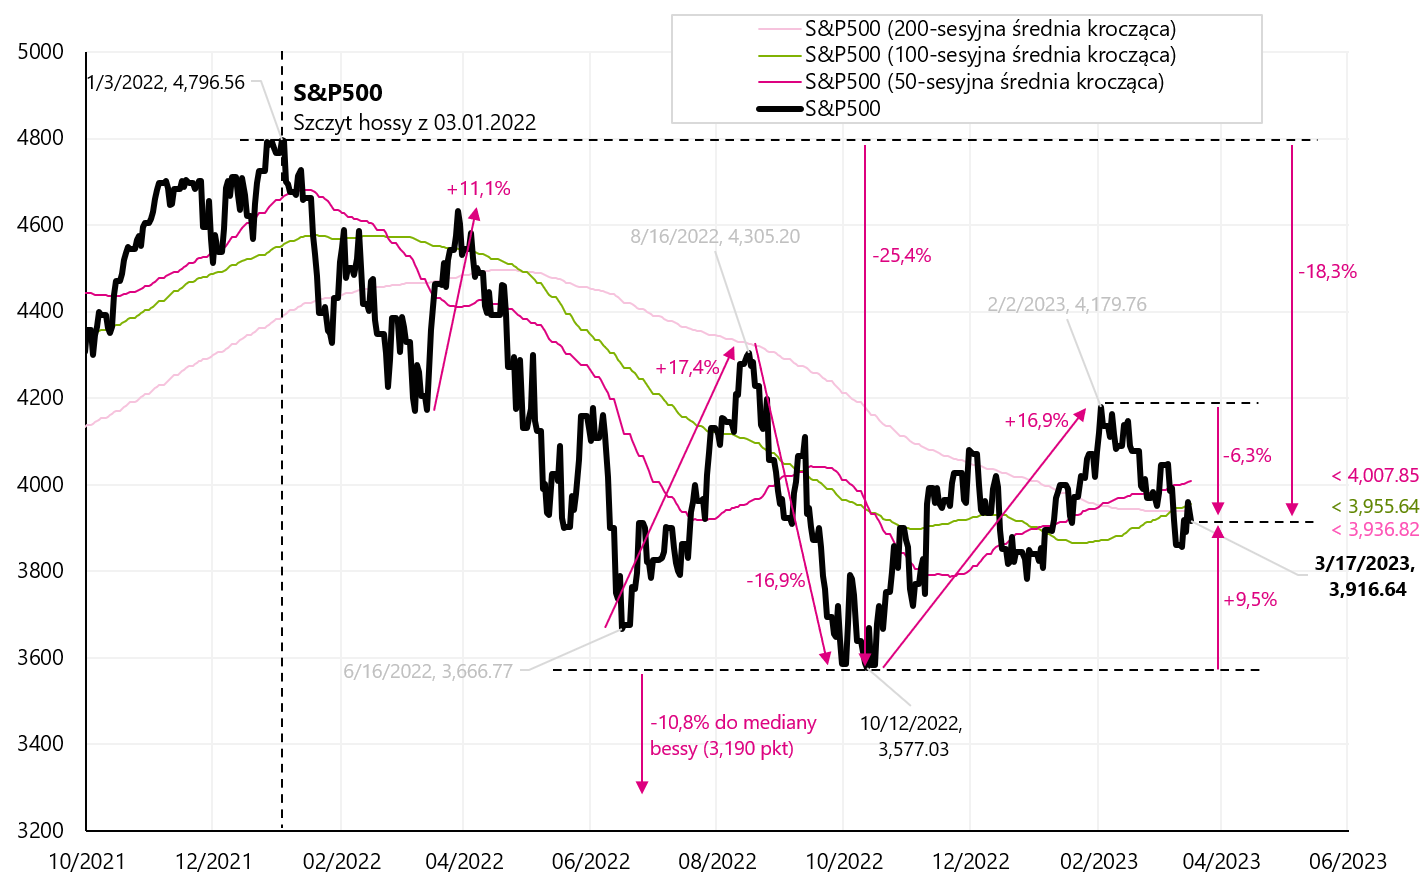
W. 2 S & P500 until March 17, 2023. Source: own study, stooq.pl
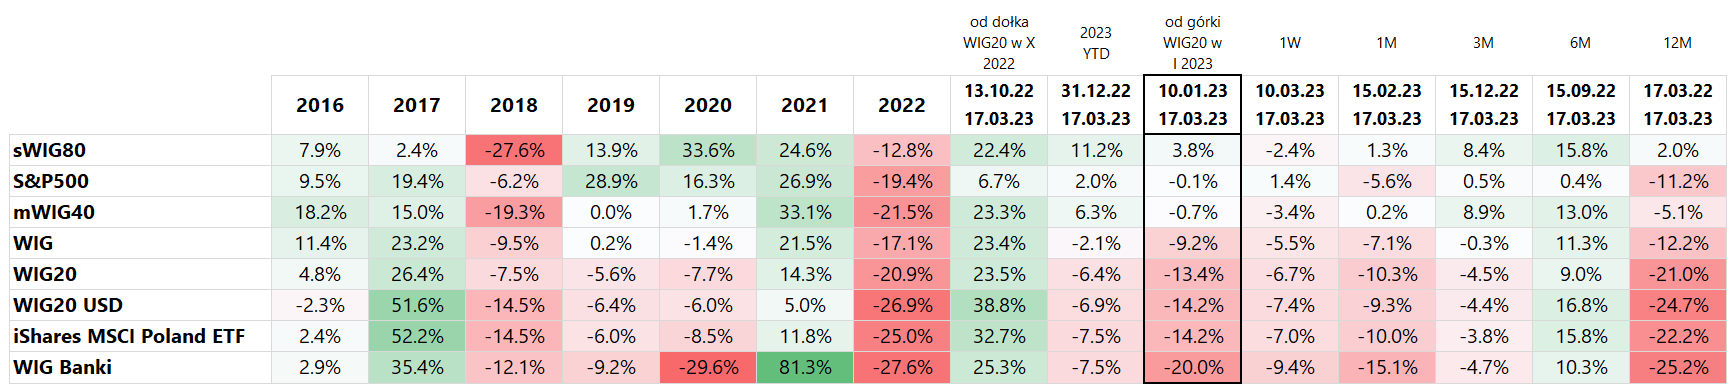
Unfortunately in the case of Polish stocks, the past week can be classified as the worst. WIG20 fell as much as 6,7%. The last time we had such a bad week was on July 15, 2022 (-6,9%), and earlier on February 25, 2022 (-8,1%). If we look from the last local hill on Wig20 (January 10 this year), since then the WIG20 has fallen by 13,4%, and WIG Banks -20%. Details are presented in the table below.
On the other hand, in the chart below we present the WIG, which from the top of January 10 this year. is now -9,2%. However, this is still over 23% from the lows of the current bear market in October 2022.
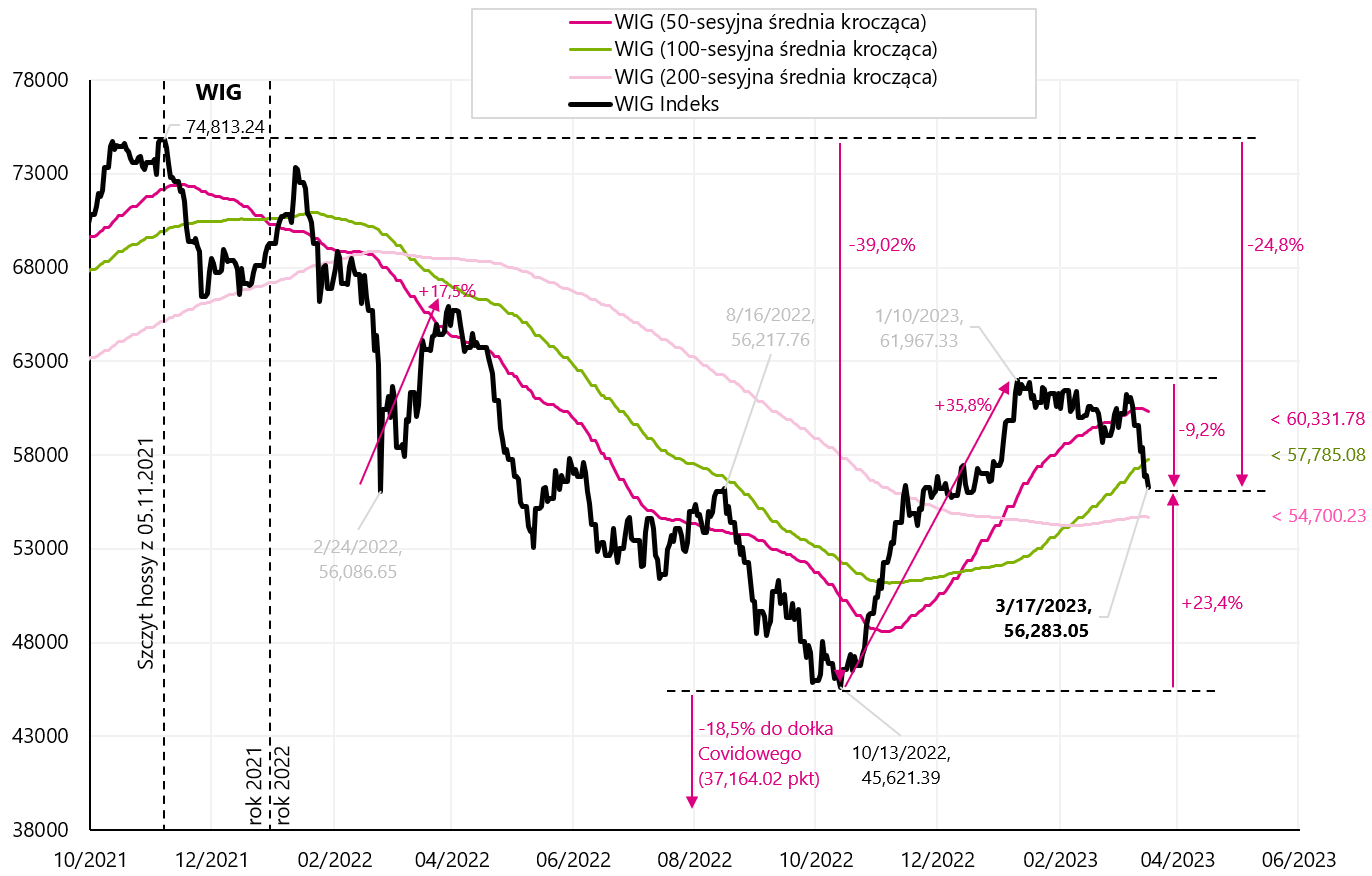
W. 3 WEDGE until March 17, 2023. Source: own study, stooq.pl
The situation on Polish indices since the beginning of 2022 is presented in the chart below. Polish small companies deliver the highest rates of return for many weeks now. We will see how long they will be able to resist the declines of large companies. In the US, the situation is exactly the opposite, with large companies behaving much better than small ones. In the last two weeks, the Russell 2000 is down 10%, while the S&P 500 is only 3,2%. In Poland, the WIG20 fell by 9,8% over the same period, and the sWIG80 fell by only 1,9% (the best strategy was to invest "long" in Polish small companies and "shortly" in American small companies).
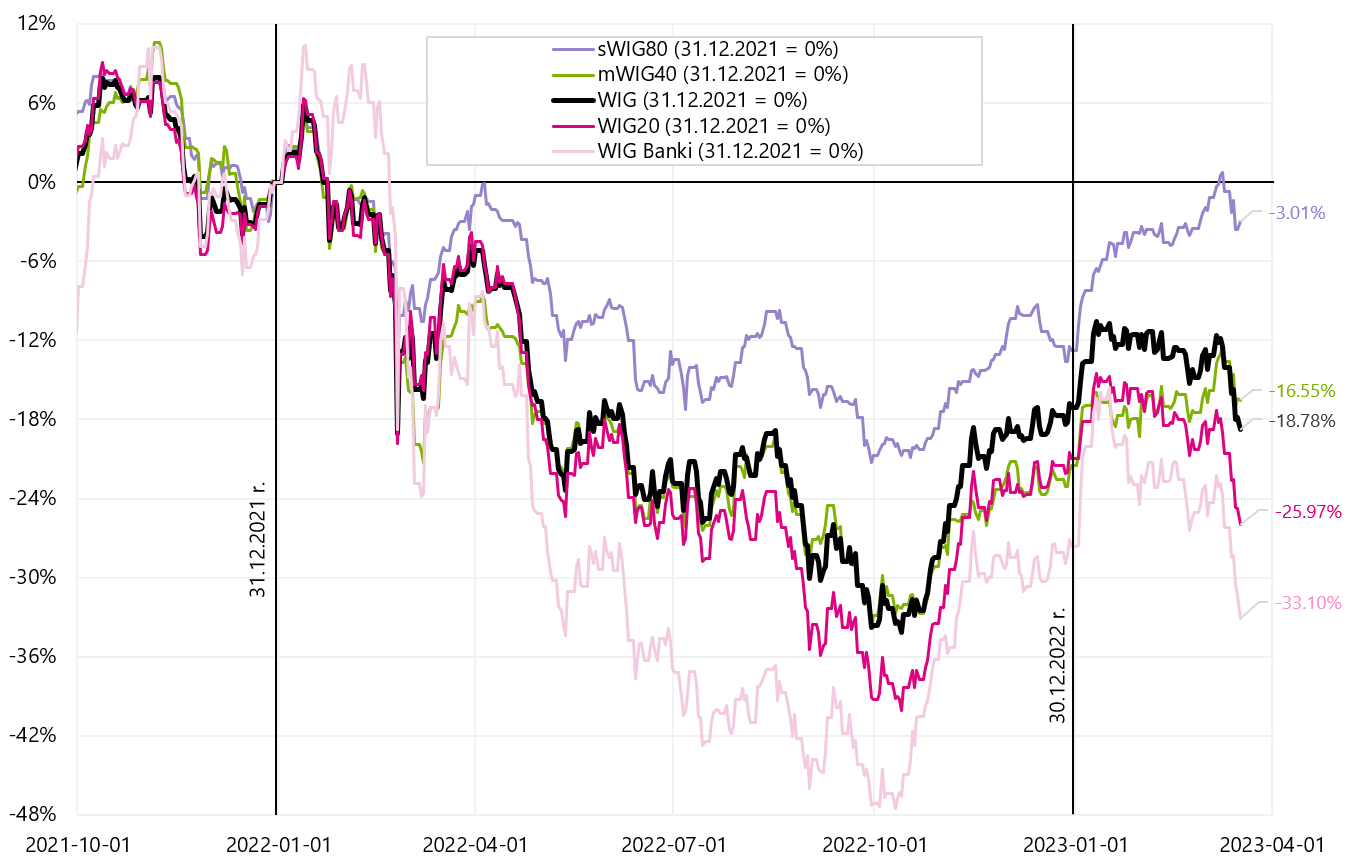
W. 4 Polish indices until December 17.03.2023, XNUMX. Source: own study, stooq.pl
While it has been difficult to make money on stocks lately, the exact opposite is true for the bond market. Until inflation was the main problem, both stocks and bonds behaved the same way (When stocks fell, so did bond prices). It was a period when the market was "not worried" about a possible recession. During a recession, as a rule, bonds go up and stocks go down. The chart below shows US Treasury yields plummeting. Yields on 2-year government bonds fell by 9 basis points in 122 days (1,22%).
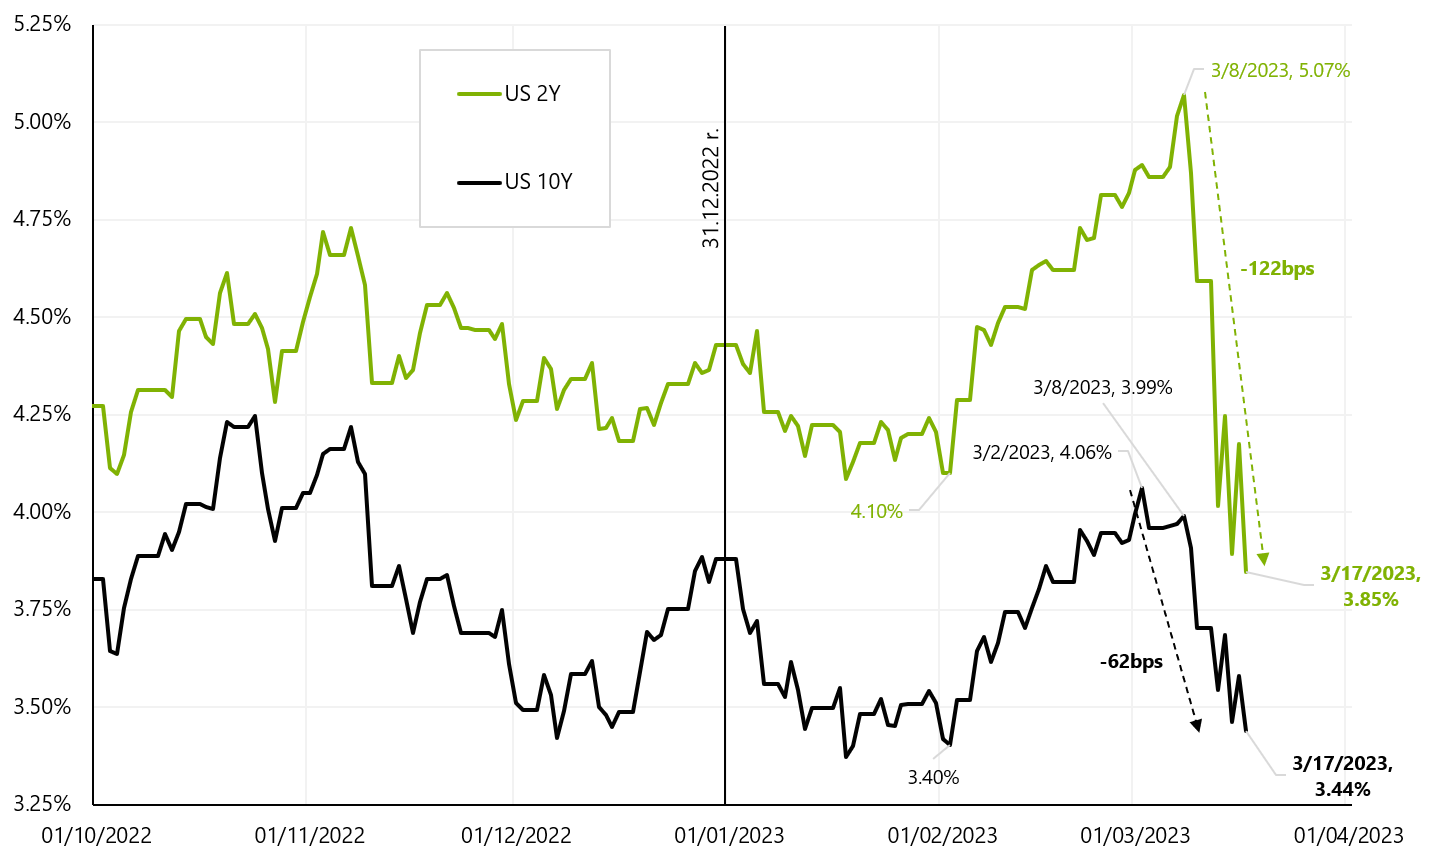
W. 5 US Treasury bond yields - recent declines. Source: own study, stooq.pl
The next chart shows changes in US and German government bond yields from a slightly longer perspective.
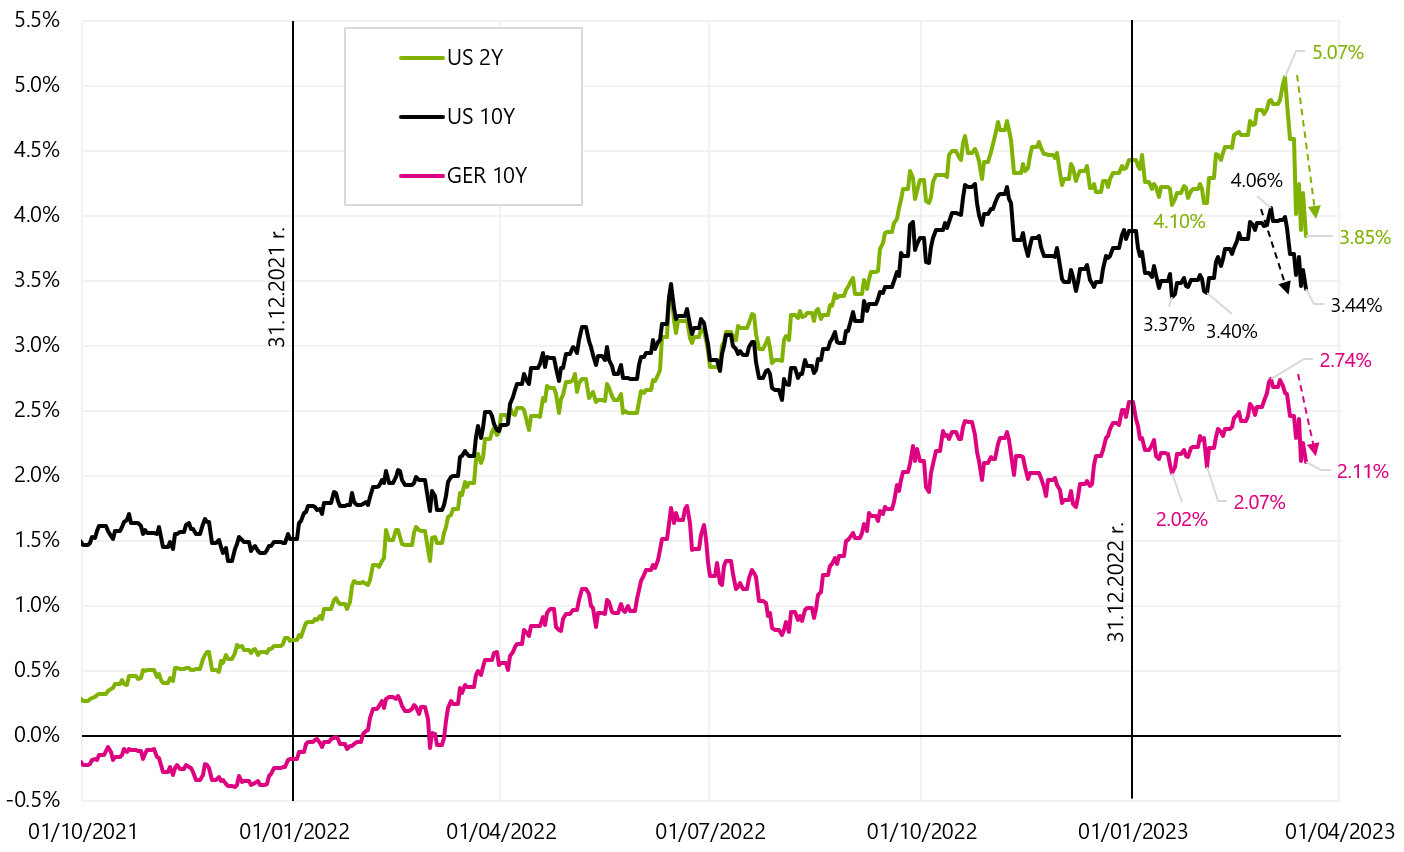
W. 6 Yields on American and German treasury bonds from 2021. Source: own study, stooq.pl
Such declines in yields, especially on 2-year US bonds, if they persist, mean significant reductions in interest rates ... and not for long! The current market valuation of the Fed's interest rate path is a 25 basis point rate hike on March 22 this year. (target rate at the level of 4,75% - 5,00%), followed by 4 reductions until the end of 2023 and the FED rate at the level of 3,75% - 4,00% after the FOMC meeting on December 13 this year. Is it possible? Historically, the change in 2-year bond yields almost always predicted the path of the Fed reference rate perfectly.
There are now a few objections. Firstly, the liquidity of the bond market is currently negligible (from a historical perspective), which, with very large short positions on US bonds, forces additional yield drops (both lack of liquidity and closing of short positions). Secondly, one would have to assume that it will be difficult to overcome the crisis of confidence in banks and that the authorities will not be able to prevent further bank runs. Rapidly falling bond yields also mean high profits for banks that invest a significant part of their assets in bonds. Of course, most banks (especially the larger ones) should hedge the interest rate risk and neither do rising yields generate losses for them, nor do falling yields mean large profits. Also possible runs on such banks would mean more a crisis of confidence than concerns about the losses incurred by these banks on treasury bonds.
Either way, at least investors have been making a fortune lately from declining Treasury yields (provided they're long). Details are presented in the table below.
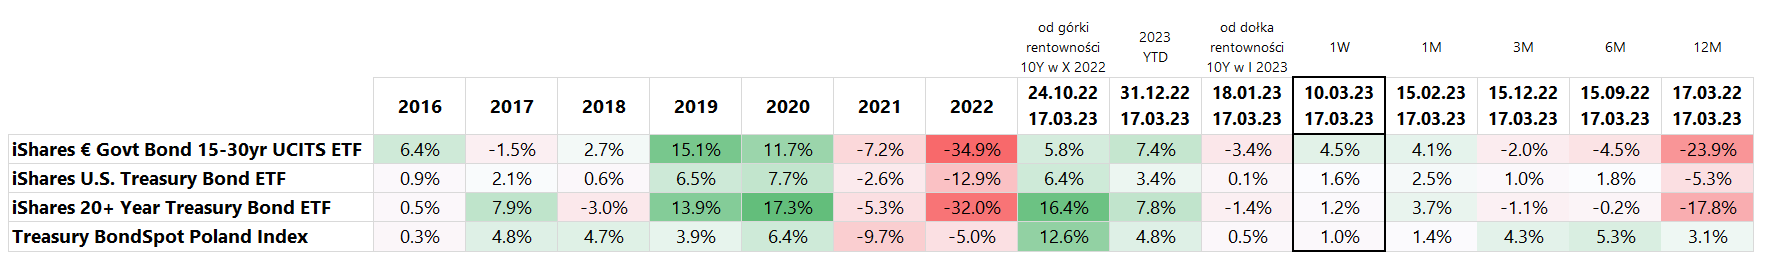
In the past week, he brought the biggest profits iShares Euro Govt Bond 15-30yr ETF (+4,5%). Since the beginning of the year iShares 20+ Year Treasury Bond ETF up +7,8% a iShares Euro Govt Bond 15-30yr ETF +7,4%.
Polish government bond index increased by 4,8% since the beginning of the year – but it should be remembered that the duration of the Polish index is only about 4 years, while in the case of iShares 20+ Year Treasury Bond ETF it is 17,6 years, and in the case of iShares Euro Govt Bond 15-30yr ETF it is as much as 21,5 years. The longer the duration of the portfolio, the higher the interest rate risk (such a portfolio is more sensitive to interest rate changes, i.e. changes in bond yields). The chart below shows the yields on Polish, US and European treasury bonds since the beginning of 2018.
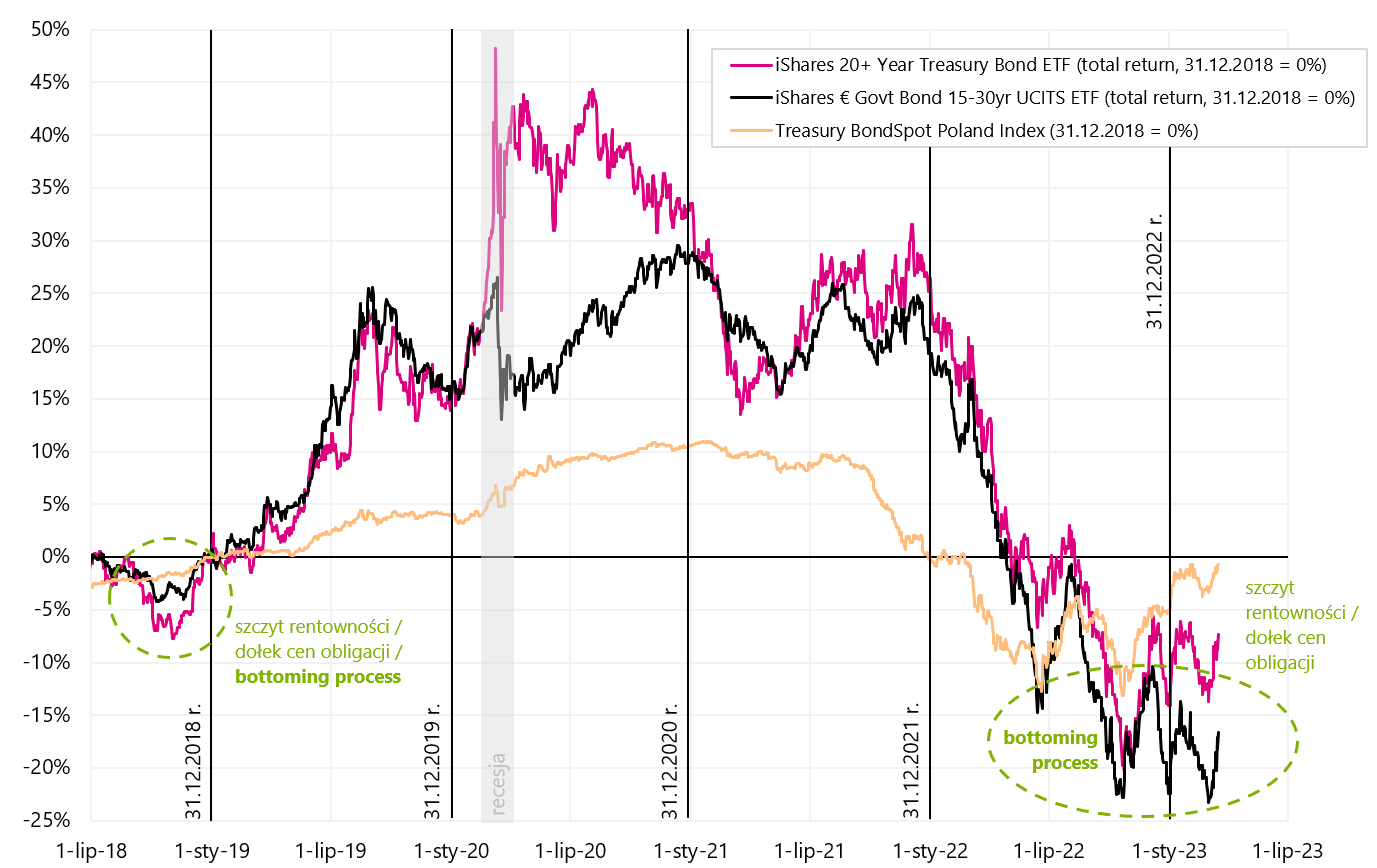
W. 7 American, European and Polish treasury bonds until March 17.03.2023, 2018 (from the beginning of XNUMX). Source: own study, ishares.com, stooq.pl
Is the drop in oil prices discounting the coming global slowdown?
The WTI oil price peaked in March and June 2022 (2 and 6 months after the S&P500 peak). We then had a dip until December 2022 to a side channel in the $72-$80 range which has held up until now. The price of crude oil has broken sharply down from the aforementioned channel in the past week, falling as low as USD 66 per barrel (intraday and USD 66,7 at closing).
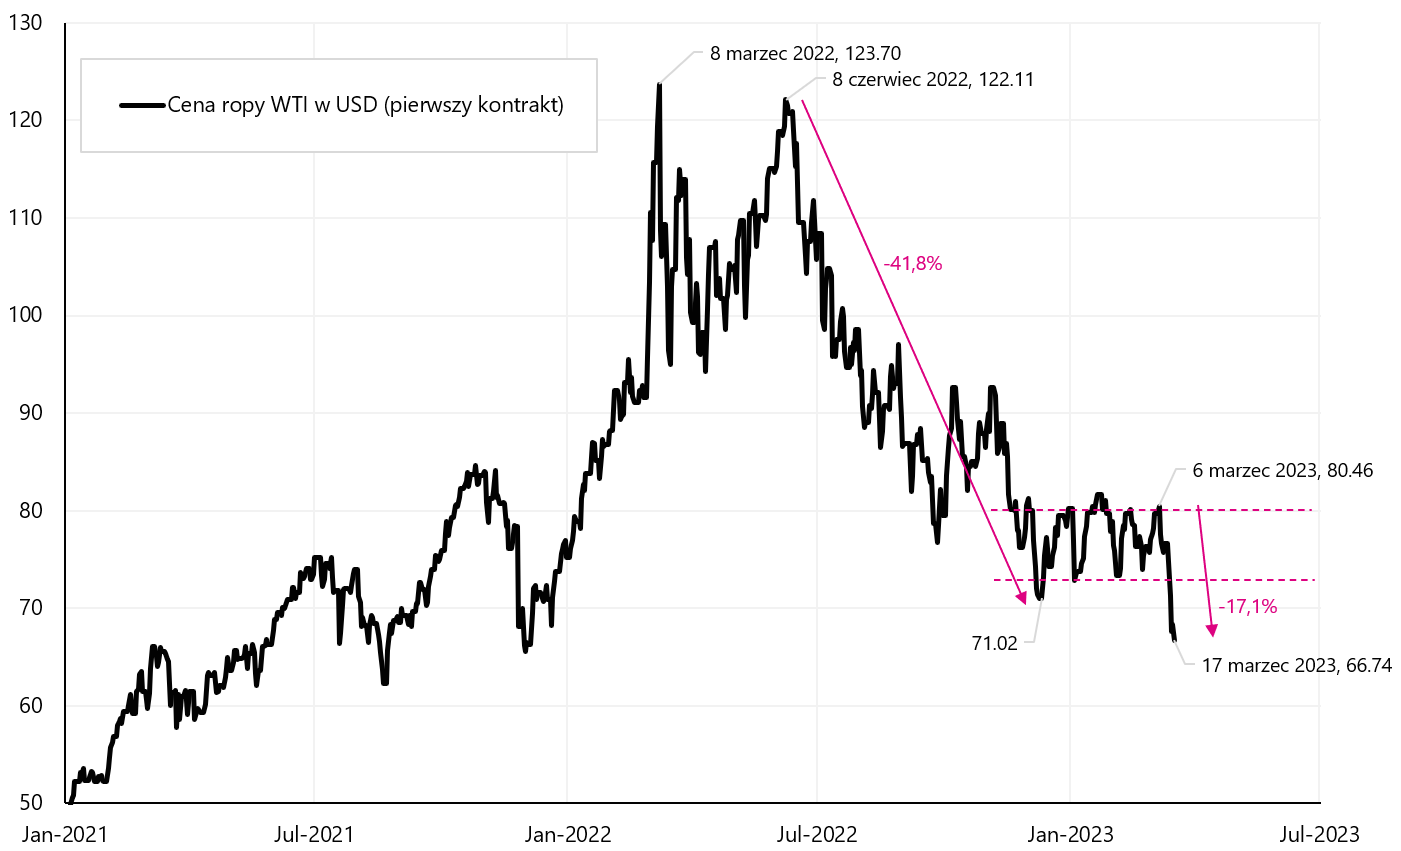
W. 8 WTI oil price until March 17.03.2023, XNUMX (first contract). Source: own study, stooq.pl
Of course, the direct cause of the decline was the turmoil in the financial markets due to the collapse of several regional banks in the US, as well as the transfer of the crisis to Europe. But in the medium term, investors may be concerned about a further economic slowdown, and the crisis in the banking sector is one of the symptoms of the expansion cycle coming to an end due to ever higher interest rates.
In any recession, the demand for oil has the right to fall, which is automatically reflected in the quotations oil. For example, global demand for oil fell in 2020 (during the pandemic) by about 20 million barrels a day (about 20%), but for obvious reasons it was not a standard cycle (lockdowns are mainly responsible for such a large decrease). The years 2008-2009 and 2001-2002 are more appropriate. In 2008-2009, global demand fell by about 5 million barrels a day (down 5,6%), and during the recession in 2001-2002 by about 3 million barrels (down 3,4%). During a recession, the price of oil can easily fall by as much as 50% or more. Of course, such a decrease in demand will be reflected in a decrease in supply, whether in a natural form (gradual only production with the highest production cost, e.g. production from shale), but the largest adjustment of supply will take place through reducing production by OPEC+ countries.
If the declines from > USD 120 are included in the price correction related to the current completion of the cycle, further possible decreases could be limited to levels between USD 50 and USD 60 for WTI oil (more than 50% decrease from the top). Such a drop in oil prices would occur simultaneously with the completion of the global economic cycle, including in the US economy (which may probably happen between 2H 2023 and 1H 2024).
As always the main determinant of the oil price is the balance of supply and demand. What else could be important in this regard in the current cycle? Certainly, the demand from China (the famous opening of the local economy), the volume of oil supply from Russia (due to the sanctions), and the deferred demand related to the rebuilding of strategic stocks by the US government.
In the case of oil supply from Russia, it can be expected to decrease due to European Union sanctions, but so far this has not happened, although most analyzes indicate such a decrease. In other words, the Russians manage the sanctions skilfully bypassing them, but it must also be admitted that there is no shortage of buyers of Russian oil at lower prices. For example, India, which imported virtually no Russian oil before the war, now imports over 1,5 million barrels a day. The chart below shows the supply of Russian oil (and equivalents) along with the forecast until the end of 2024.
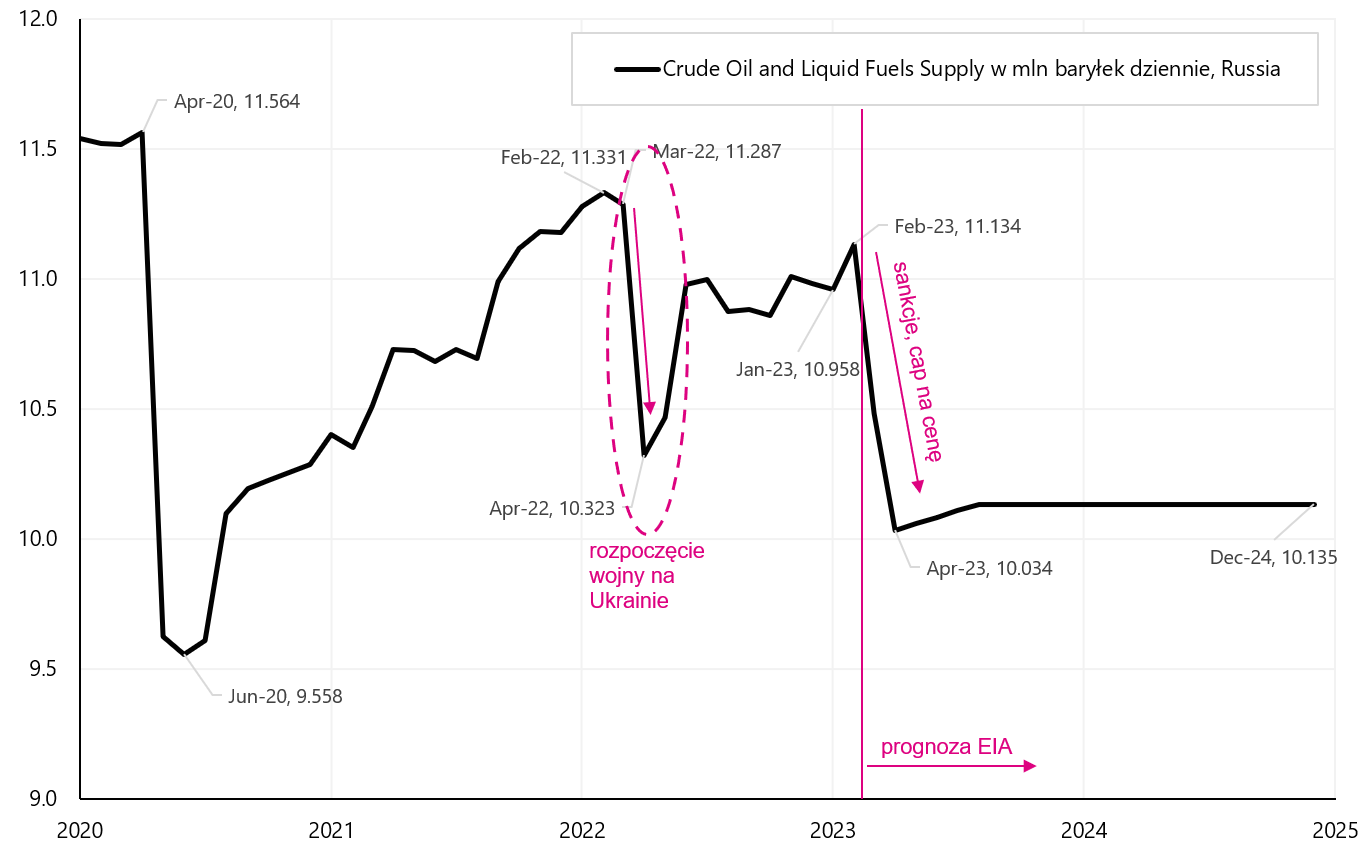
W. 9 Russia: supply of oil and equivalents in million barrels per day (EIA forecast). Source: own study, EIA (Energy Information Agency)
The chart shows a decrease in supply at the beginning of 2022 immediately after the outbreak of war, but the Russians managed to quickly rebuild exports. Currently, the EIA forecasts a significant drop (over 1 million barrels) in the supply of Russian oil due to the next sanctions, but whether this will happen and to what extent we will probably have to wait until the second quarter. Nevertheless, the lack of a decrease in the supply of Russian oil is a factor pushing global prices down (higher supply than previously assumed by the market).
In the case of the opening of the Chinese economy, we should see more demand from this country, as well as from countries in Asia in general. This effect should be more visible in H2 2023. The chart below shows the consumption (demand) for crude oil and equivalents in China, including the EIA forecast until the end of 2024 (based on monthly data).

W. 10 China: demand for oil and equivalents in million barrels per day (including the EIA forecast). Source: own study, EIA (Energy Information Agency)
Of course, as the Chinese economy grows, so does the demand for oil. In addition, monthly changes are also seasonal, which is why the growing demand due to the opening of the economy is better seen on the next chart, which shows the volume of demand in subsequent calendar years. And indeed, higher demand (compared to previous years) is clearly visible in the forecast from the second quarter of this year. For example, in July demand is expected to be about 1 million barrels more than in 2022.
All in all, the opening of the Chinese economy will increase oil demand in general from Q1 this year, although this increase should not exceed XNUMX million barrels per day compared to last year. So the demand from China is expected to increase more or less as much as the export of Russian oil is expected to fall. If the Russians manage to circumvent the sanctions, the lack of a drop in Russian oil supply would compensate for the increase in demand from China.

W. 11 China: seasonality of oil demand (and equivalents) in million barrels per day (including the EIA forecast). Source: own study, EIA (Energy Information Agency)
Another factor that may mitigate the decline in oil prices to some extent is the deferred demand associated with the inevitable rebuilding of US strategic stocks. In order to counteract oil price increases, the US administration launched a sale of strategic reserves starting in September 2021 (the sale ended in January 2023). The chart below shows the level of oil inventories in the US (including SPR). From July 2020 to December 2022, inventories fell by 540 million barrels.
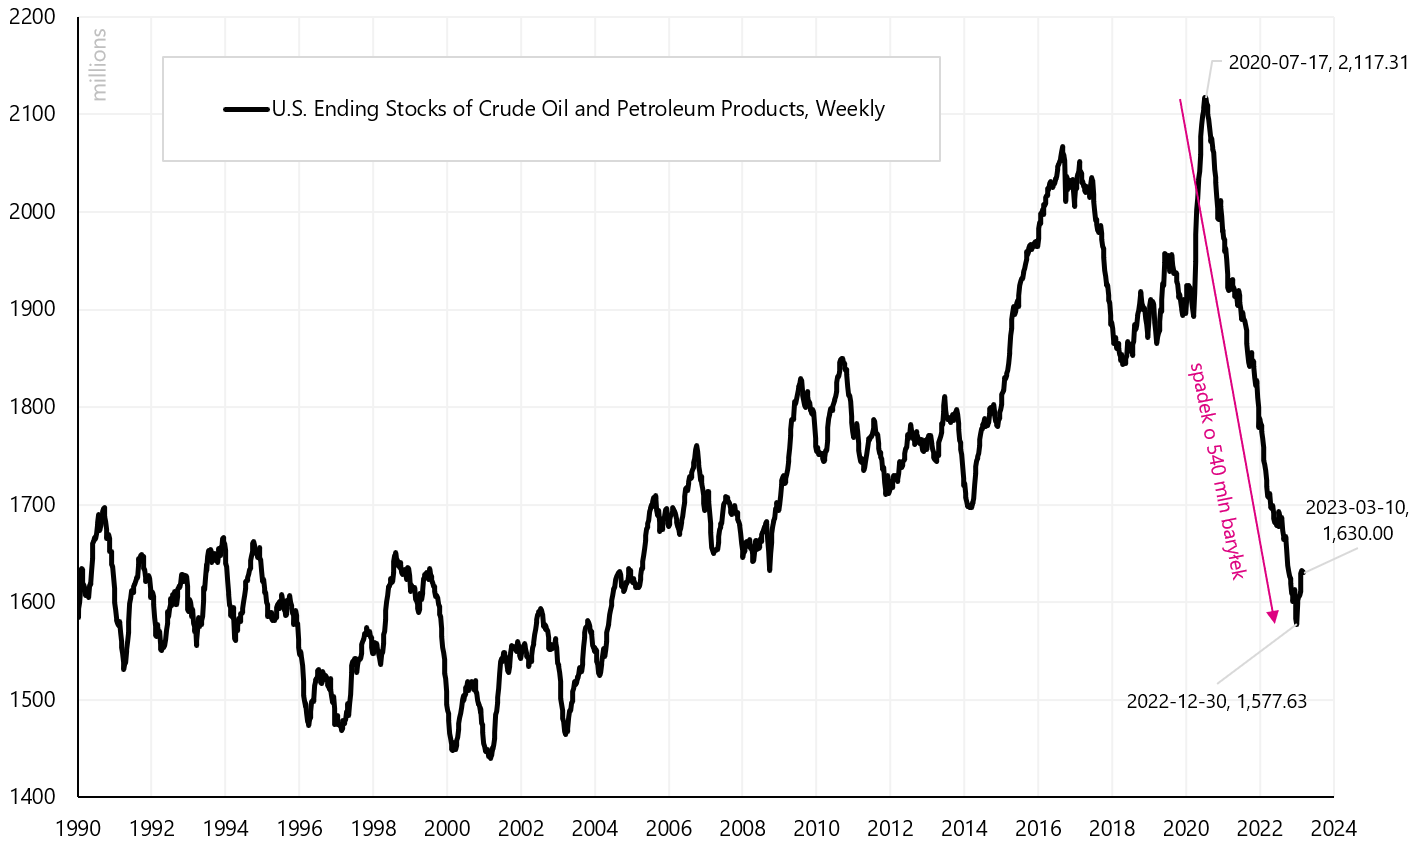
W. 12 US: oil and equivalent stocks in million barrels (including SPR, strategic reserves). Source: own study, EIA (Energy Information Agency)
But if we look at strategic stocks and other (i.e. private) stocks, we see that the decline in US stocks since the beginning of 2020 is practically solely responsible for the decline in strategic stocks. We show this in the next graph.
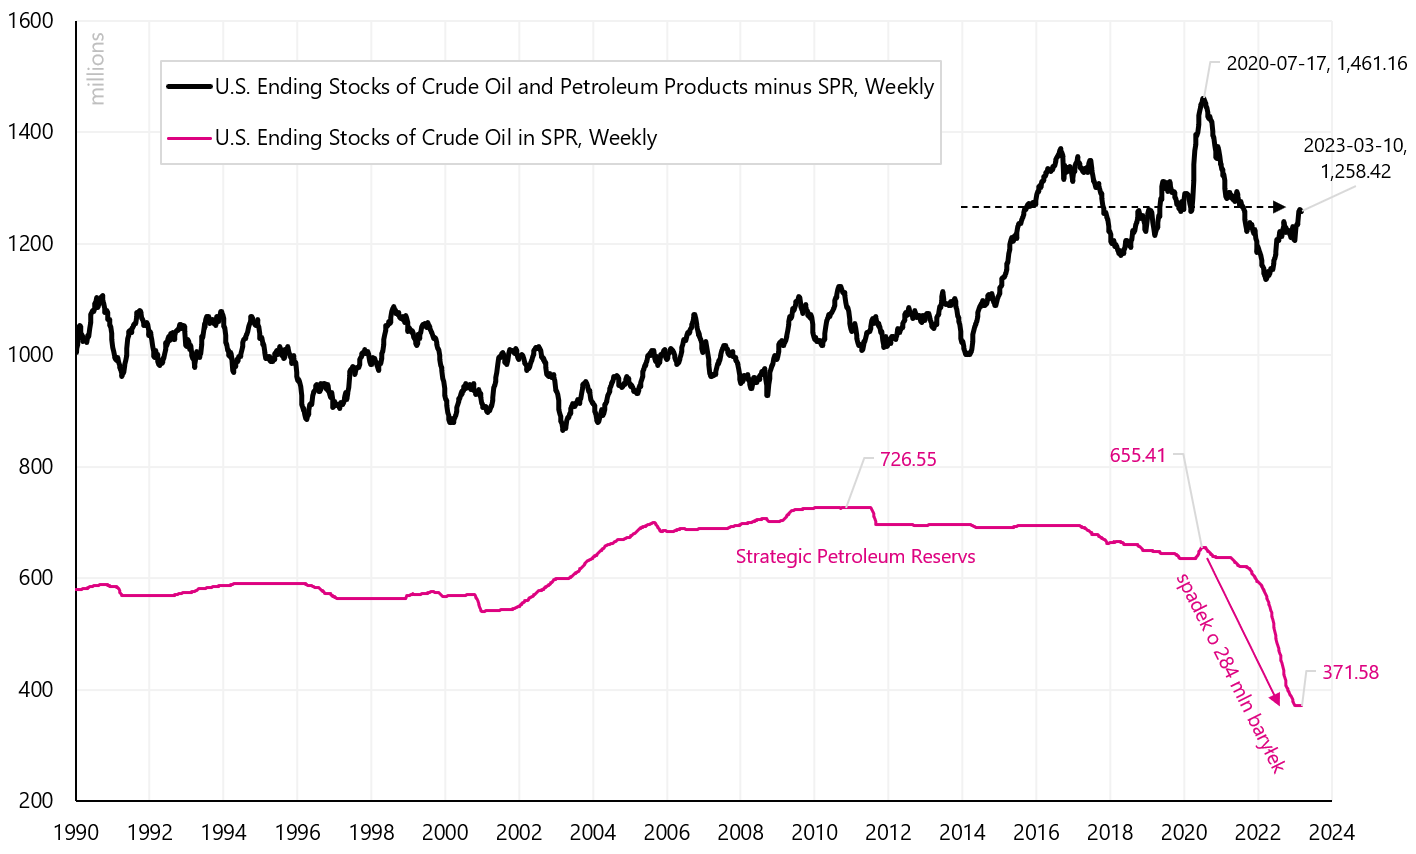
W. 13 USA: oil stocks broken down into strategic and other. Source: own study, EIA (Energy Information Agency)
Non-strategic inventories, after an increase since the beginning of this year, are practically at the same level as at the beginning of 2020. The next chart shows the weekly change in oil and other petrochemical stocks (including strategic stocks). Since the end of the sale of strategic stocks (first week of this year), other stocks have started to grow significantly.
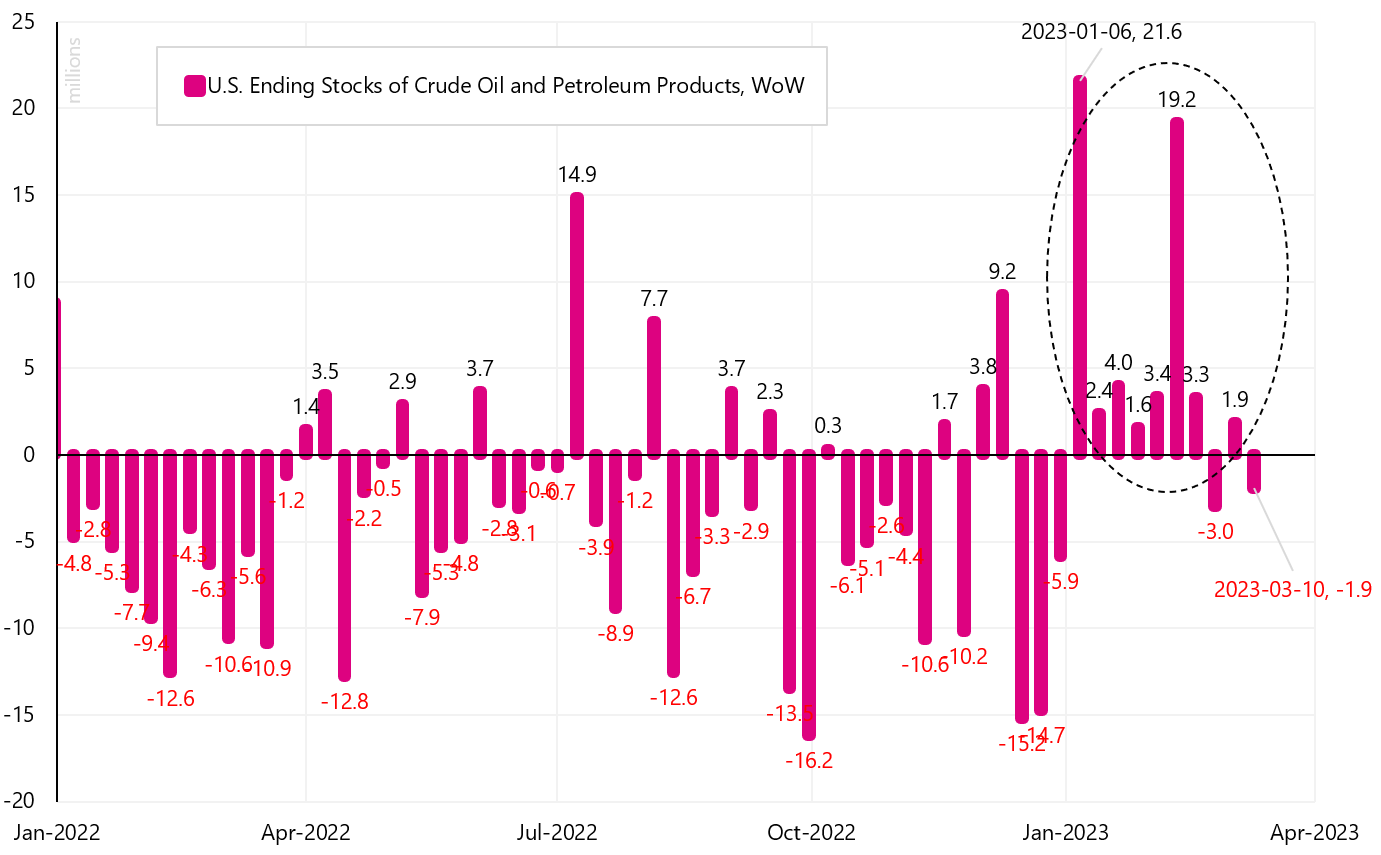
W. 14 Weekly change in US oil and petroleum product inventories in million barrels. Source: own study, EIA (Energy Information Agency)
The current level of total US inventories remains well below its 5-year average, including last year's level. The seasonality of the stock level is presented in the next chart.
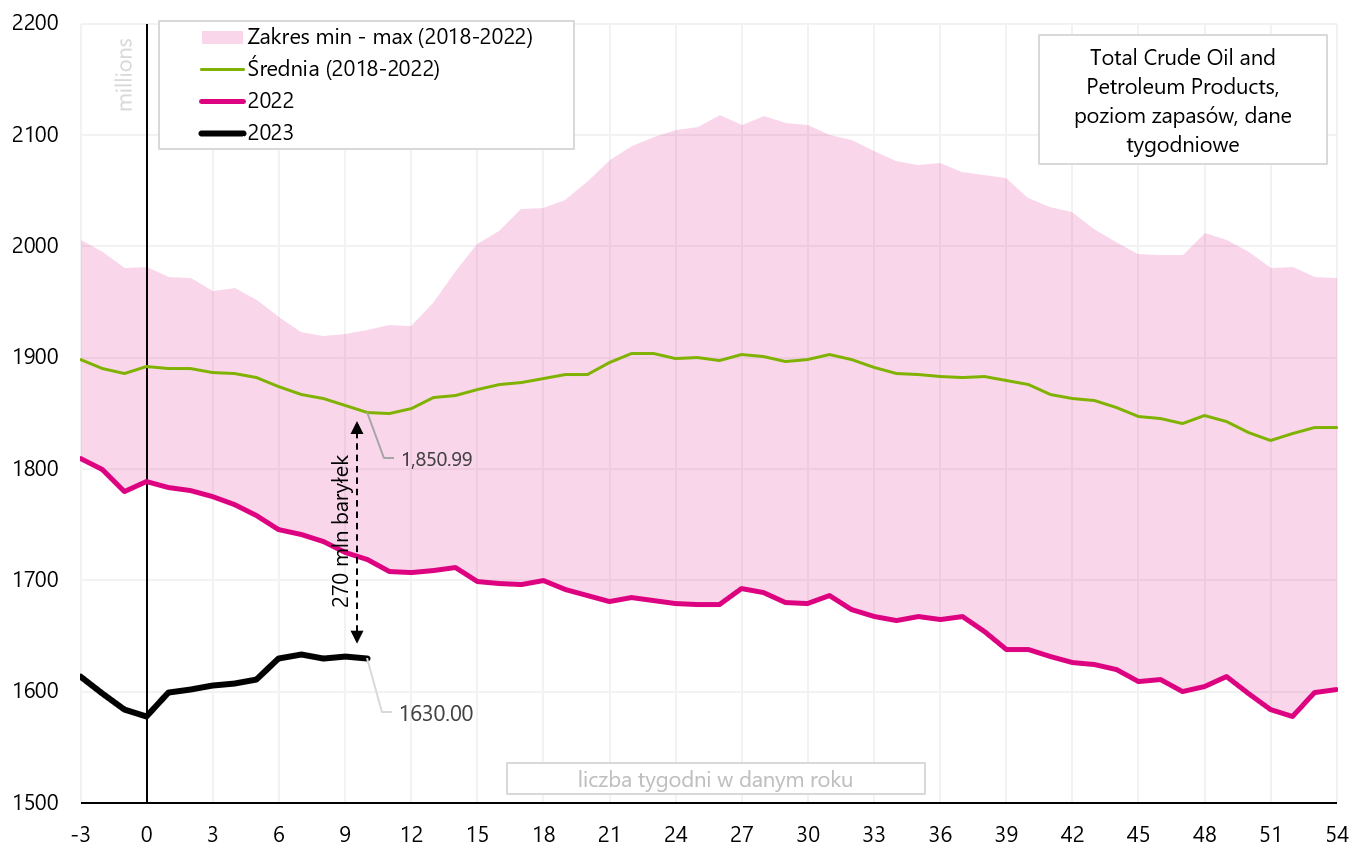
W. 15 USA: seasonality of total stocks of crude oil and petroleum products in million barrels per day. Source: own study, EIA (Energy Information Agency)
The low level of inventories means higher demand for oil in the coming months (if only the American administration decides to rebuild the level of strategic inventories). In order for the strategic stocks to return to their historical maximum (over 720 million barrels), this means a demand of 1 million barrels a day throughout the year (around 360 mon barrels of oil would be available for purchase).
To sum up, if the global economy, including the US, were to enter recession later in 2023, then the global decline in demand may easily outweigh the additional demand from China, or even the possible rebuilding of strategic oil stocks in the US. At the same time, the supply of oil from Russia remains at a high level (sanctions are not effective, at least for today). In the main scenario, the drop in WTI oil prices could reach between USD 50 and USD 60 (at the bottom of a possible recession, and the drop in the price of oil from the top of the cycle would be over 50%).
But the next expansion cycle (i.e. more like 2024 and beyond) may bring significant increases in commodity prices, because there will be insufficient supply (with strongly growing demand) due to the underinvestment of the entire industry. Then the price of oil could even rise to new historic highs (above USD 150).
Summation
The past week was generally not a good one, despite the US S&P 500 gaining 1,4%. The markets are still concerned about the situation in the banking sector. We had high volatility in bond prices and further declines in banks and financial companies. Polish stocks have suffered one of the largest declines in recent times. During the week, the WIG20 fell as much as 6,7%.
It is possible that now investors' attention will shift to next week's FOMC meeting (on 21-22 March this year). Markets expect the last hike of 25 basis points in this cycle, followed by a cut (up to 100 basis points until the FOMC meeting on December 13). J. Powell's press conference, which will be held immediately after the FOMC meeting, will certainly be interesting. Especially that from March 11 this year. Fed members were not allowed to speak publicly because of the so-called "blackout period", which normally occurs before each meeting.
About the Author
 Jaroslaw Jamka - Experienced fund management expert, professionally associated with the capital market for over 25 years. He holds a PhD in economics, a license of an investment advisor and a securities broker. He personally managed equity, bond, mutli-asset and global macro cross-asset funds. For many years, he managed the largest Polish pension fund with assets over PLN 30 billion. As an investment director, he managed the work of many management teams. He gained experience as: Member of the Management Board of ING PTE, Vice-President and President of the Management Board of ING TUnŻ, Vice-President of the Management Board of Money Makers SA, Vice-President of the Management Board of Ipopema TFI, Vice-President of the Management Board of Quercus TFI, Member of the Management Board of Skarbiec TFI, as well as Member of Supervisory Boards of ING PTE and AXA PTE. For 12 years he has specialized in managing global macro cross-asset classes.
Disclaimer
This document is only informative material for use by the recipient. It should not be understood as an advisory material or as a basis for making investment decisions. Nor should it be understood as an investment recommendation. All opinions and forecasts presented in this study are only the expression of the author's opinion on the date of publication and are subject to change without notice. The author is not responsible for any investment decisions made on the basis of this study. Historical investment results do not guarantee that similar results will be achieved in the future.


