


MSCI - "Netflix" of the investment industry and the king of the indices market [Guide]

MSCI is a leading solution provider to the global investment community. The company is a combination of a provider of indexes, analytical services and a data aggregator. MSCI collects data for indices as well as creates and quotes them. It also offers a wide range of analytical services that help manage the risk and liquidity of financial institutions. The main service is the provision of stock indices, bonds, hedge funds, multi-asset products. MSCI services are used by over 7 customers in over 500 countries. Both asset holders (e.g. pension funds) and asset managers (both passive and active) benefit from MSCI's offer. The last group are brokers or trade organizers (e.g. exchanges).
The company employs approximately 3200 people who work in 20 countries. About 200 employees deal with research, while 1500 employees deal with the development of technological tools and the analysis of large data sets. The company also reports that approximately 700 employees provide customer service.
Basic information about the index providers industry
Indices are an essential product for the entire asset management industry. They increase market transparency for both end customers (providing capital) and managers. Additionally, indices make it easier and easier to compare the fund's performance with a comparable group of assets.
The entire index industry can be divided into data providers, index providers (index administrators), and index product developers (e.g. ETF). MSCI is both a data provider and an index builder. In turn, the recipients of MSCI services are product developers, e.g. BlackRockthat makes up ETFs, or index funds that also follow MSCI indices.
READ: Vanguard - one of the "big three" of the ETF market
Asset managers need to follow the needs of their clients. For this reason, they are looking for more and more detailed benchmarks. An example is the growing popularity of investing according to ESG standards. For this reason, MSCI's offer includes indices grouping socially responsible companies (eg MSCI ACWI ESG Leaders). At the same time, MSCI introduced ratings (from AAA to CCC) reporting compliance ESG standards by companies.
The main players in the index market are: S&P Dow Jones Indices, FTSE Russell, and MSCI. According to data collected by Burton-Taylor International Consulting, in 2018 the revenues of the big three were:
- FTSE Russell - $ 842,3 million
- S&P DJI - $ 837 million,
- MSCI - $ 835,5 million.
Considering that the entire market was around $ 2018 billion in 3,5, the "big three" had approximately 72% market share.
In addition to the main three, there are many other competitors, such as Bloomberg, Nasdaq, STOXX, Alerian, Intercontinental Exchange, Solactive, Morningstar, CRSP and SIX.
CEO, salaries and main shareholders

Henry A. Fernandez
Henry A Fernandez (Chairman and CEO) - he has been working in the company since 1996. He has been the CEO since 1998. Since 2007, he has also been the President of the Management Board. Prior to MSCI, Mr. Fernandez worked at Morgan Stanley (1983-1991). Due to receiving part of the remuneration in shares, the company's CEO owns 2,43% of MSCI shares.
A characteristic feature of the company's remuneration policy is a low base salary and large bonuses, which depend on the achievement of short- and long-term goals of the company. Share awards are the largest component of remuneration.
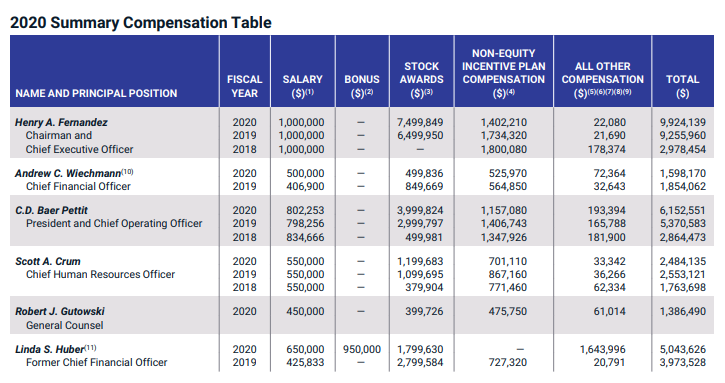
Source: ir.msci.com
According to the charts below, the implementation of the company's long-term plan has the greatest impact on the level of remuneration of senior management. At the same time, a characteristic feature is that the fixed remuneration ranges from 10% -15% of the total remuneration.
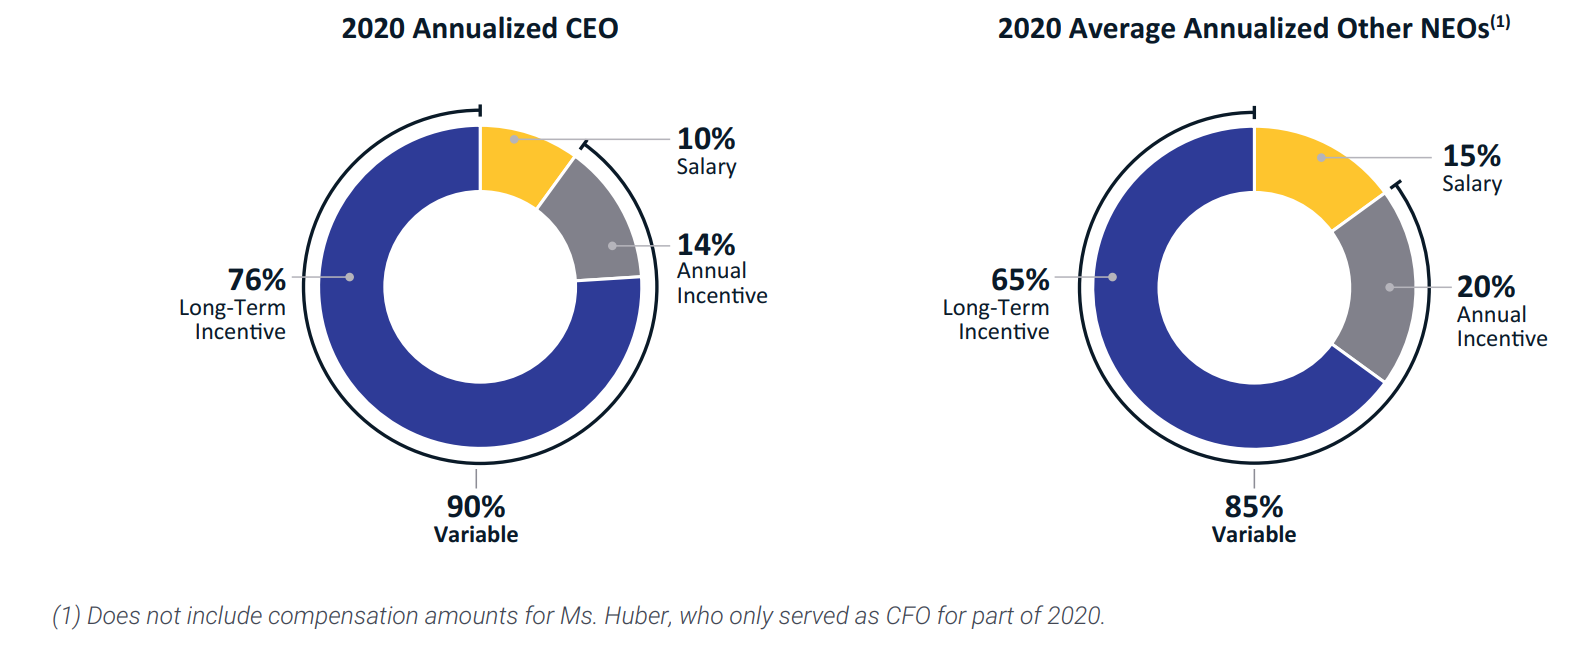
Source: ir.msci.com
The company has a very fragmented shareholding structure. The largest shareholders are the two leading passive asset management companies. As of March 2, 2021, BlackRock holds 7,75% of the company's shares. In turn, the Vanguard Group, through its funds, owns 10,43% of the company's shares. Senior management (together with the CEO) held 2,93% of the company's shares.
Customer structure Msci
The company's biggest customer is Blackrock, which is one of the leaders in the passive asset management market. In 2019, Blackrock was responsible for 11,5% of MSCI's revenues. A year later, the company was responsible for 11% of revenues.
BlackRock mainly uses the offer of indices (including as a benchmark to its ETFs). In this segment, BlackRock is responsible for 18,9% of revenues. A year later, BlackRock's share in this segment dropped to 18%. In the case of the analytical segment, none of the clients exceeds 10% of revenues.
Operational data
MSCI's business model is based on the provision of services that typically require subscriptions. For this reason, the basic indicators informing about the good condition of the business are: increasing run rate, increase in subscription and increasing retention level.
run rate
The run rate is calculated on the basis of the annualized value of recurring revenues from license agreements for the next 12 months. It is assumed that expiring contracts will be extended for another period. For revenues generated on the basis of the size of assets or the volume of futures contracts and options, the ratio is calculated on the basis of the value of assets on the last trading day at the end of the quarter and the quarterly volume of trading in derivatives. There are no one-off charges included in this indicator. The annualized contract values are excluded from the "run installment", in which the client has unambiguously informed about the plans to terminate the cooperation (termination or non-extension of the contract).
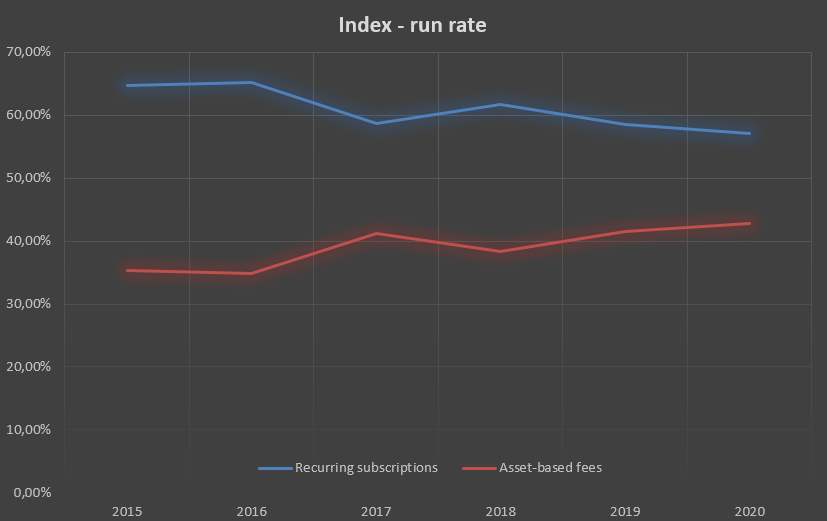
Index - asset-based fee
The run rate calculated for asset-based fees increased by 17,2% to $ 464,1 million over the year. In nominal terms, the increase in projected fees was approximately $ 68,0 million.
The reason for the improvement in the run rate in passive solutions was the increase in assets under management (AUM) in ETFs referring to MSCI indices and in other passive solutions. AUM increased by 18,1% to $ 1 billion. Both net inflows (+ $ 103,6 billion) and asset value growth (+ $ 75,6 billion) were responsible for AUM growth. Another factor was the increase in the fee for derivatives based on MSCI indices.
It is worth mentioning that the product mix slightly changed, which lowered the average value of fees to 2,67 basis points from 2,82 in the previous year.
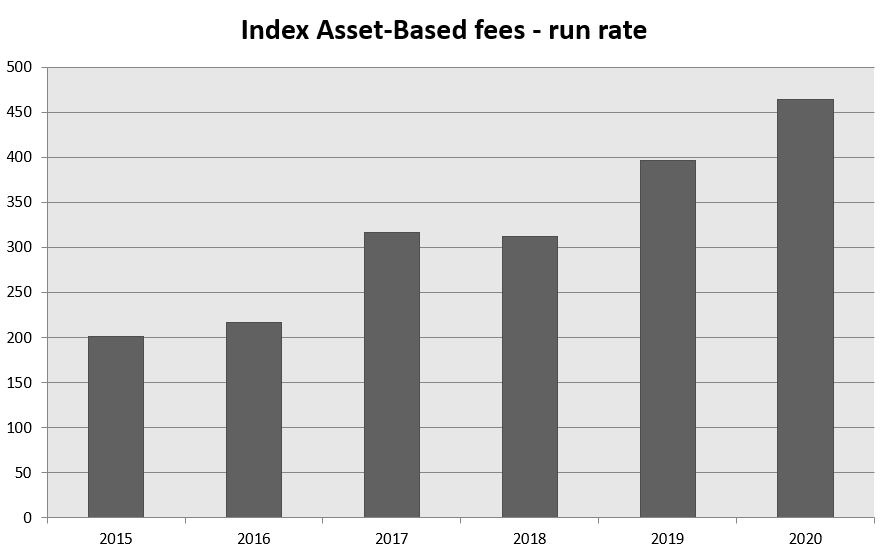
Source: own study based on annual reports
Index - recurring subscription
Estimated subscriptions for the indices segment increased by 10,6% to $ 618,4 million over the year. In nominal terms, the increase was approximately $ 59,1 million. The reason for the increase in the run rate is the improvement in sales results in specialized, individualized, ESG and factor index products.
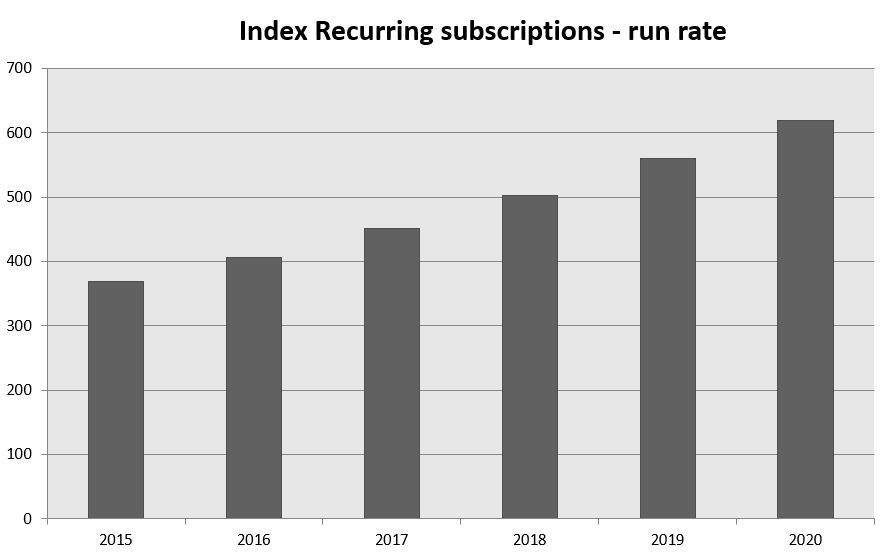
Source: own study based on annual reports
Subscription-based fees continue to dominate the index segment. However, over the last 5 years there has been a slight increase in the share of asset-based fees. This has its advantages, as the fee automatically increases when the AUM value increases. For regular subscriptions, pricing changes are required, which may have a negative impact on customer retention. However, it should be remembered that both revenue models are under pressure from consumers to reduce prices.
Source: own study based on annual reports
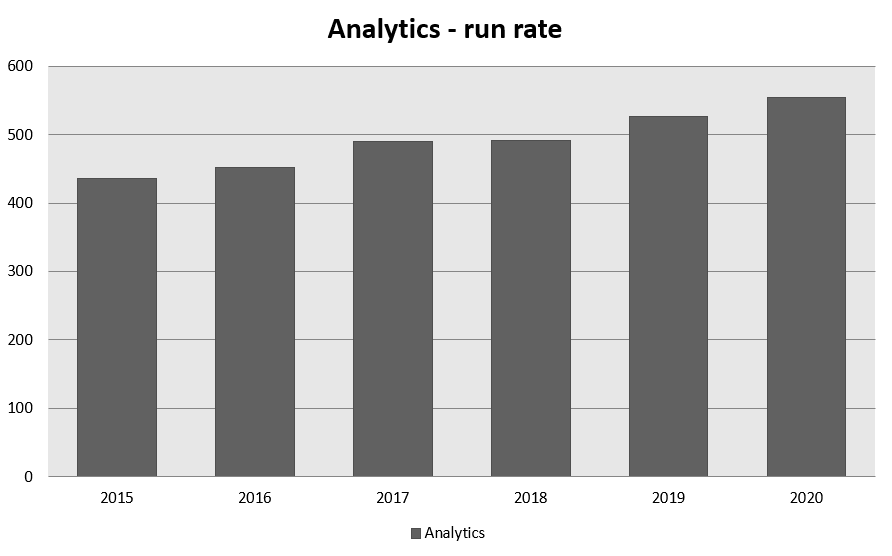
Analitycs
Revenue from this segment depends only on the value of the subscription. Over the year, the run rate increased by 5,4% to $ 555,1 million. In nominal terms, the increase was $ 28,3 million. The reason was the growth of analytical products based on MAC (Multi-Asset Class) and equity analytics.
Source: own study based on annual reports
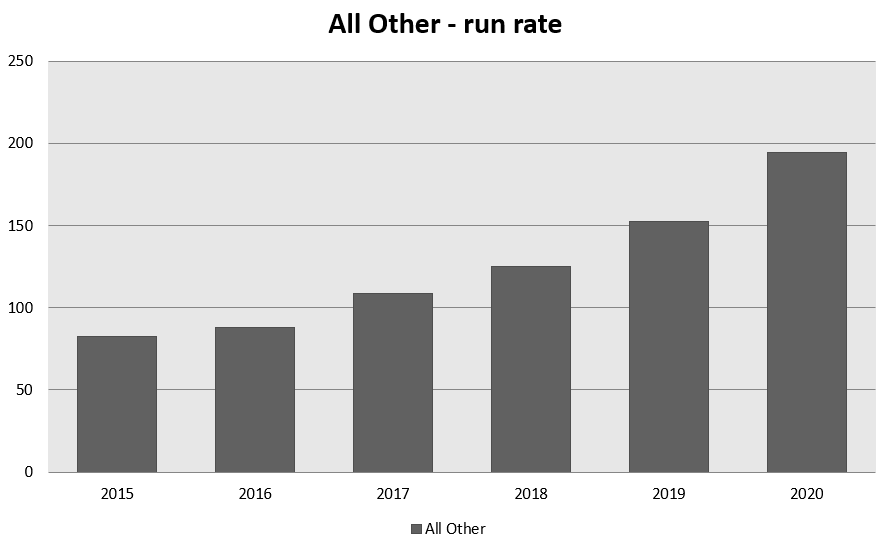
All others
The run rate of other products (ESG and real estate market) improved by 28,0% y / y to $ 194,8 million. This means a nominal increase of $ 42,6 million. The ESG market had the greatest impact, as its run rate increased by $ 36,9 million (ie by 36,4% y / y) to the level of $ 138,3 million. The reason for the improvement in the index is the good reception of products such as the ESG Rating, ESG Scanner and climate related products. The real estate segment increased its run rate by $ 5,7 million (11,2% y / y) to $ 56,5 million. The reason for the increase were products related to access to market information.
Source: own study based on annual reports
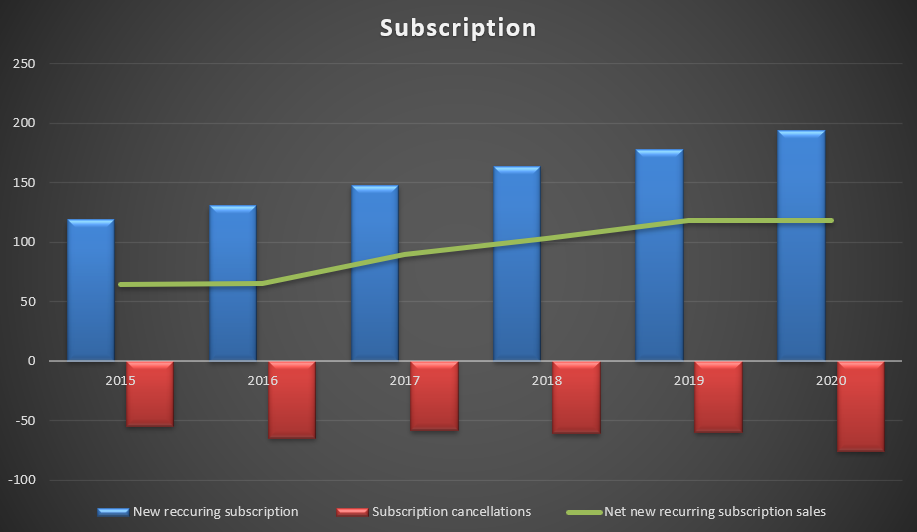
Subscription Sales
Selling subscriptions plays an important role in the company's business model. First, sales must cover terminated contracts within a year, and second, new subscriptions should increase the run rate for next year for MSCI to grow.
Source: own study based on annual reports
The constant level of terminated contracts, combined with the increasing value of contracts, causes the retention rate to increase, which is a good prognosis for the future.
retention rate
Retention rate is a key metric in determining the quality of the MSCI business model. Cancellations from contracts result in a reduction run rate for the next year, which worsens the growth rate of revenues. Monitoring of this indicator allows you to observe whether there are problems on the market caused by, for example, greater competition or customers' departure from external data sources. Retention is calculated as the amount of subscriptions maintained at the run rate (subscriptions at the beginning of the year minus the resignation value) divided by the value of the run rate subscriptions at the beginning of the year. As a rule, the lowest retention rate is in the fourth quarter, because this period is the period of most contract renewals. In 2020, the fourth quarter was responsible for approximately 30,4% of cancellations in total.
| Msci | 2015 | 2016 | 2017 | 2018 | 2019 | 2020 |
| retention rate | 93,4% | 92,7% | 93,8% | 94,1% | 94,7% | 93,9% |
| Index | 95,2% | 95,3% | 95,8% | 95,4% | 95,7% | 95,1% |
| Analytics | 93,0% | 91,0% | 92,5% | 93,0% | 93,6% | 92,4% |
| All others | 88,6% | 90,0% | 91,2% | 94,1% | 94,8% | 94,5% |
Source: own study based on annual reports
The company has a strong position in the industry and the ability to convince its customers to continue the services provided by MSCI. A retention of over 90% shows that there are no concerns about competitors' actions so far. It is worth noting that the company maintains the highest level of retention in the most profitable segment.
Fundamental analysis
revenues
The company's revenues come from three sources. The first is subscriptions paid by customers, the second there are asset based fees. The third is revenues classified as "unique".
- Subscriptions are paid on the basis of contracts signed with the asset managers, therefore they are known throughout the duration of the contact.
- Asset based fees are charged on the AUM (Assets Under Management) of the Passive Funds. ETFs and funds pay a fee if they want to benchmark against certain MSCI indices.
- Other revenues include services without revolving contracts. Examples include providing historical data and specialized customer services.
These three sources of revenue are grouped into three segments:
- Indices,
- Analytics,
- Others.
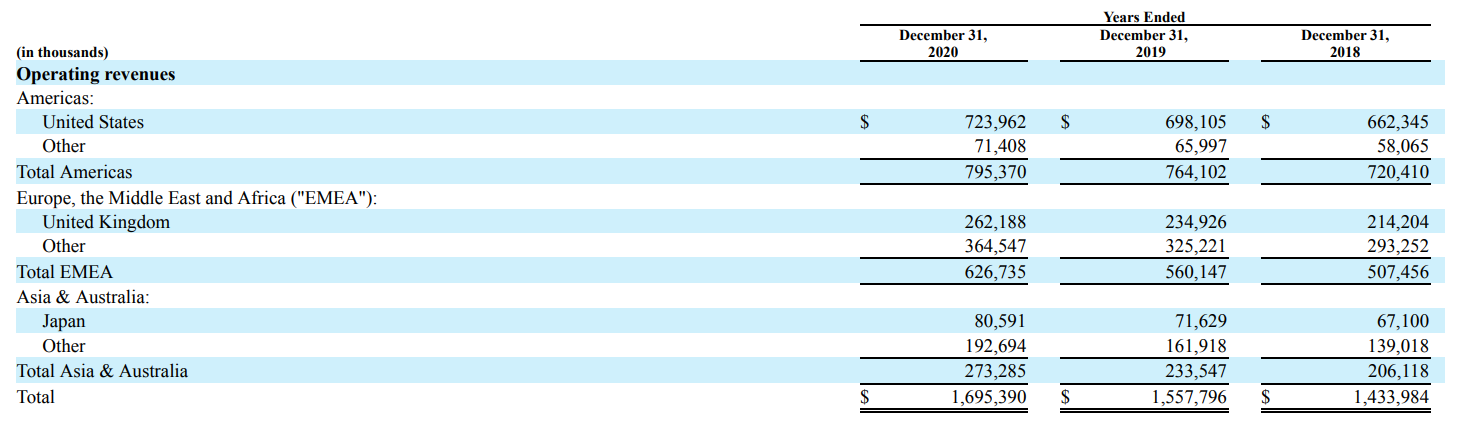
Source: 2020 annual report
The company's revenues are geographically diversified. In the United States, MSCI generated 42,70% of total sales. The second important market is the United Kingdom, which accounted for 15,5% of revenues. MSCI has very little market presence in Asia and Australia.
Indices
The index segment groups the revenue generated by index users. These are both creators of products that are to reflect a given index (e.g. ETFs, futures, options), as well as institutions that compare their results to specific indices. At the end of each day, MSCI calculates the value of 246 indices and over 000 quotes on an ongoing basis. The indexes include, among others:
- MSCI Global Equity Indices - These are indices that measure the rates of return achieved in specific markets, segments and industries. The indices cover over 80 domestic markets.
- Factor indices - this category groups indices based, for example, on volatility, momentum.
- ESG and climate indices - indices supporting investments in socially and environmentally responsible.
- On-demand indices - these are indices calculated based on specific customer expectations (e.g. hedging currency risk, foreclosure of companies, etc.).
- Thematic indices - these are indices intended to reflect specific, social, demographic, industry and environmental investment strategies.
- Private Real Assets indices - these are indices that are intended to support transparency and transparency of strategies on the real estate market.
Each year, MSCI expands its service offering. In 2019, megatrend indices were introduced. An example is the MSCI ACWI IMI Digital Economy Index grouping investments in companies from the digital economy (e.g. digital payments) and MSCI ACWI IMI Disruptive Technologies, grouping companies dealing with, inter alia, 3D printing, Internet of Things, fintech, cybersecurity or cloud technology. In 2020, an index was introduced that supports the "decarbonisation of the economy" - MSCI Climate Paris Alignd Indexes.
The revenues of this segment also include license fees for the use of GICS (Global Industry Classification Standard), which was established as a Joint Venture between MSCI and S&P Financial Services. GICS helps to allocate companies to specific industries.
Segment performance:
Revenue from this segment comes from three sources.
- The first is subscriptions, which account for approximately 60% of the segment's revenue. The products are indexes (standard, factor, specialist). The recipients are mutual funds, hedge funds, pension funds, etc.
- Another is the asset-based fees. They account for approximately 39,3% of the total revenues of the Indices segment. There are two sources of payment here. The first is the revenue obtained from ETFs and other passive solutions that are linked to indexes created by MSCI. Fees are typically charged 2-3 basis points on the value of assets under management (AUM). Another stream of revenues are transaction fees for trading on the MSCI index derivatives market.
- The least significant are non-recurring revenues which account for 0,7% of the segment's revenues. Consultation revenues, provision of historical data, etc. are included here.
In 2020, the revenues of the Indices segment increased by 10,4% y / y to $ 1 million. In nominal terms, sales increased $ 016,5 million. Subscriptions, whose revenues increased by $ 95,6 million, i.e. 49,4% y / y, had a leading role in the increase in sales. Asset-based fees increased by 9,3% or approximately $ 10,5 million over the year.
The index segment has the highest EBITDA profitability (adjusted). The margin rate achieved in this segment is over 75%, which is significantly above the margin achieved in the entire company (approx. 57%).

Source: own study based on annual reports
Analytics
The company's offer relates to risk management, liquidity analysis and counterparty risk measurement. The service meets, among others, the needs of customers in the field of regulatory reporting. The segment includes models supporting: factor analysis (e.g. Barr models, MAC models), stress tests, as well as liquidity risk analysis.
Clients have access to analytical tools through the API, external applications and via the MSCI platform.
The analytical offer includes, among others:
- RiskMetrics RiskManager - one of the leaders in providing VaR (Value at Risk) simulations and stress tests. Thanks to this solution, clients can calculate and monitor the risk of liquidity, sensitivity and use what-if analysis on a daily basis.
- BarraOne - MAC models using the Barr methodology. It allows clients to understand the factors that influence the risk of their investment.
- Barra Portfolio Manager - an analytical platform that helps you manage investment processes more efficiently.
- WealthBench and CreditManager - a web platform used by banks, financial advisors, brokers and trusts to help wealth managers assess the risk of a potfela. Credit Manager is a tool used to measure credit risk concentration.
Segment performance:
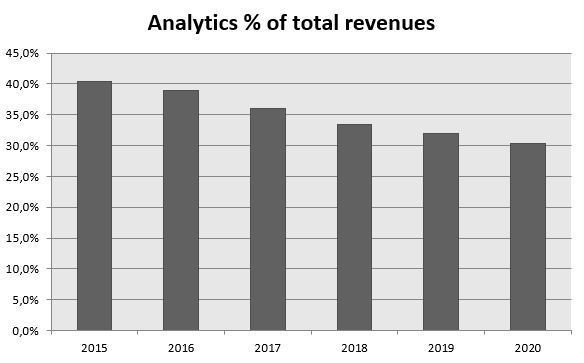
Revenues of this segment account for approximately 30,3% of total sales generated by MSCI. This segment is characterized by a very low growth rate. Last year, revenues increased by 3,4% or $ 16,9 million. Subscription revenues increased by just 4,2% or $ 20 million. The increase was mainly due to good sales of MAC (Multi-Asset Class) products. Due to the low growth rate, the segment has lost its importance in the revenue mix over the last 5 years.
Source: own study based on annual reports
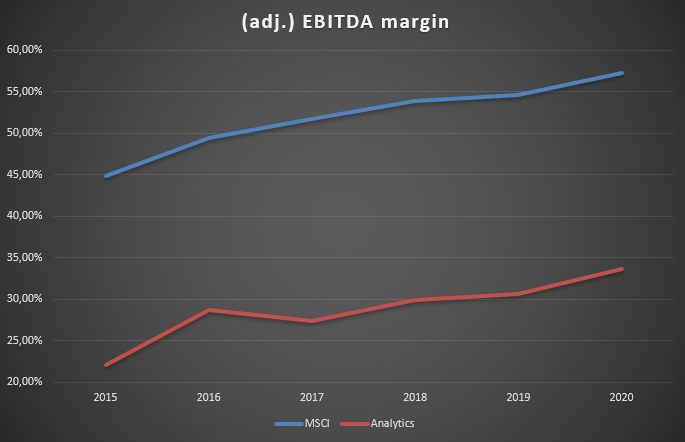
The EBITDA margin of this segment is significantly lower than that of the entire company and more than twice lower than in the "Indices" segment. Despite this, in the last 6 years there has been an improvement in the cleaned EBITDA margin, which has already exceeded 33%.
Source: own study based on annual reports
Other
In this segment, revenues are generated from two areas. One is ESG and the other is the real estate market.
MSCI analyzes approximately 8500 companies to help institutional investors better understand how ESG affects the long-term risk and performance of investment portfolios. MSCI ESG Research subscribers include asset managers, consultants, advisers and faculty. This segment includes, among others MSCI ESG Ratings solution that measures opportunities and threats resulting from ESG standards, which are often not visible in conventional company analysis. Companies are rated worst (CCC) to best (AAA). Another solution is a scanner that allows investors to better manage the time needed to search for companies with specific ESG parameters.
The real estate segment includes research, reporting, market data and benchmarks offered for real estate funds, managers and private investors. The MSCI offer includes, among others:
- MSCI Enterprise Analytics - an interactive application that offers the assessment and analysis of factors influencing the potfela results. It also allows you to review the concentration of your real estate portfolio.
- MSCI Global Intel - it is a leading database offering knowledge about local, regional and global markets. It informs you about the results and risk factors present in the individual markets. This tool also includes indexes that aggregate data from individual markets.
- Global MSCI Real Estate Analytics Portal - offers analytical filters to help evaluate the performance of real estate managers' portfolios.
Segment performance:
The segment's revenues increased by 18% y / y, reaching $ 139,9 million. In nominal terms, sales increased approximately $ 21,4 million. The main driver of growth were ESG products, which increased by approximately $ 19,3 million (+ 27% y / y) to the level of $ 90,7 million. Good sales of ESG Ratings and ESG Screening products helped. The real estate market grew by $ 2,1 million, or 4,4%. This group of products generates approximately $ 49,2 million in revenues.
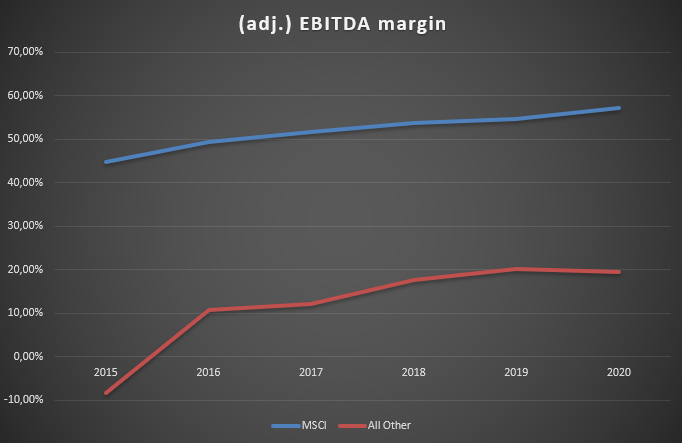
Product development goes hand in hand with improved segment profitability. The EBITDA margin improved between 2015 and 2019 by over 28 percentage points. As the market matures, further improvement in margins can be expected.
Source: own study based on annual reports
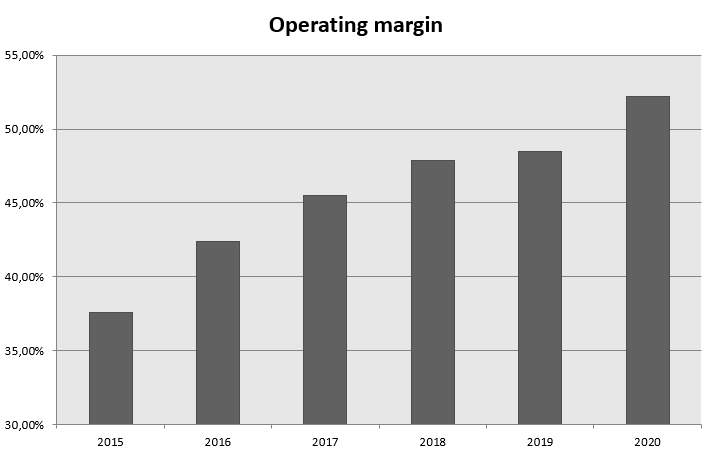
Operating margin Msci
Cost control and the positive effect of operating leverage have resulted in a significant improvement in the operating margin over the last 6 years. The much slower growth rate of costs than revenues helped. Below is a summary of changes in revenues and costs in 2015-2020:
| $ million | 2015 | 2020 | % CARG |
| revenues | 1 075 | 1 695 | + 9,54 % |
| Tax-deductible cost | 268 | 292 | + 1,73 % |
| Sales and marketing | 162 | 216 | + 5,93 % |
| Research and development | 77 | 101 | + 5,50 % |
| Administration | 86 | 115 | + 5,91 % |
Source: own study based on annual reports
Source: own study based on annual reports
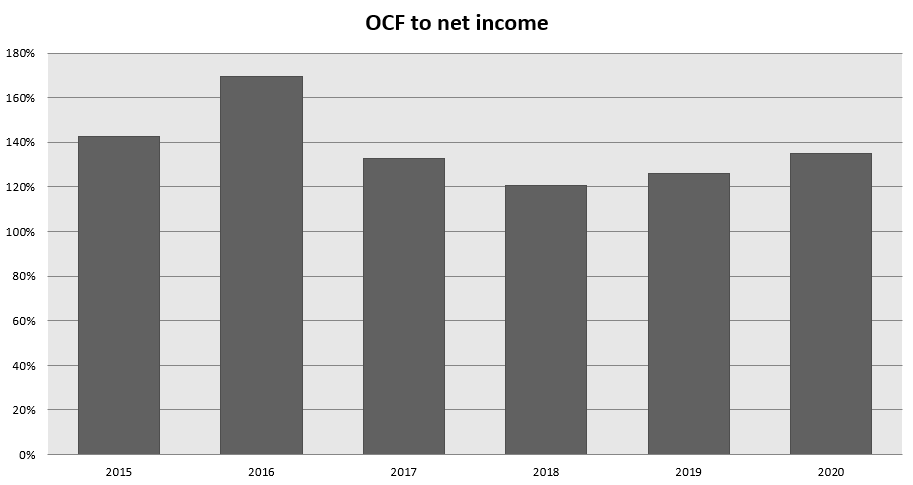
Analysis of operational flows
The company's business model makes it natural to generate very large operational flows. In 2015-2020, cash flows from operating activities were significantly higher than the reported net profit.
Source: own study based on annual reports
In addition to the net profit, the main component of cash flows is depreciation and the costs paid with shares. Both expenses are reflected in the accounting expenses, but are not non-cash expenses.
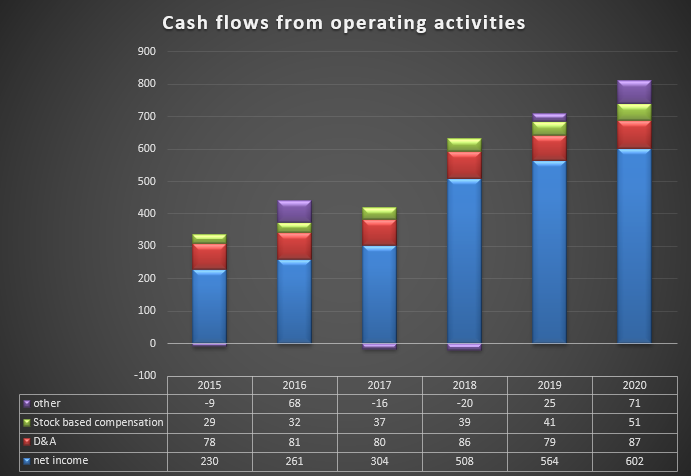
Source: own study based on annual reports
Deferred revenue (customer has already paid for the service in advance, but has not finished using it) is included in the "other" group, which amounted to + $ 98 million in 2020. Another important item was the increase in receivables (revenues have been reported but not yet collected). This reduced operating cash flow by $ 58 million.
It is worth noting that the company has no significant capital expenditure (CAPEX). Their average level over the last 6 years was $ 31 million. Additionally, software development costs that are capitalized on the balance sheet must be included. Average expenses on this account were approximately $ 2015 million in 2020-18. The levels of these expenses are significantly lower than the depreciation of $ 2020 million in 87.
It is therefore not surprising that in the last 5 years Free Cash Flow (FCF) has been significantly higher than the net profit. It should also be noted that the company does not need to make significant acquisitions and capital expenditures to increase the scale of its operations.
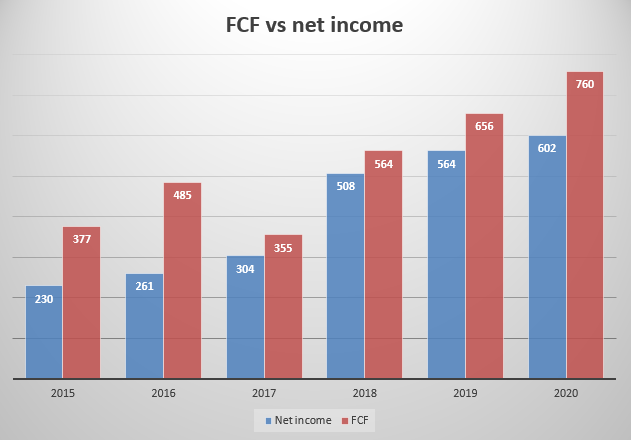
Source: own study based on annual reports
Due to the generous sharing of profits with investors, the company has negative equity. The expenses for the purchase of shares and the payment of dividends significantly exceed the level of generated free cash flows.
In recent years, the company has decided to return a great deal of capital to its shareholders. It is worth paying attention to the years: 2015,2016,2018, 2020, 265 and 560, when the amounts paid to shareholders were PLN XNUMX - XNUMX million higher than the cash generated by the company. Such a pace of share buyback is unsustainable in the long term.

Source: own study based on annual reports
MSCI balance sheet analysis
Structure of assets
The main item in current assets is cash and its equivalents. At the end of 2020, it was around $ 1,3 billion. This is a decrease of approximately $ 205 million. The drop in cash was largely due to a large share buyback ($ 779 million) and dividend payment ($ 246 million), which exceeded the level of free cash flow generated. The aforementioned expenses were partially compensated by the issuance of new debt. Another important item in assets are receivables, which at the end of the year amounted to $ 559 million. Please note that customers pay for their subscriptions on an annual or quarterly basis. For this reason, the level of receivables is quite high. The receivables turnover is about 120 days, which is confirmed by the payment model used by the company. In fixed assets, the only standout item is Goodwill, which remains at $ 1,5 billion.
Structure of liabilities
In addition to interest liabilities, a significant item in liabilities is deferred income, which amounts to approximately $ 676 million. These are funds received from customers in advance for services provided by MSCI. Settlement of these revenues will follow the subscription period.
The generosity of the management board in sharing profits with shareholders has led to a significant drop in equity. In 2015, equity was around $ 900 million. It is currently negative (-$ 443 million). However, it should be remembered that the greatest risk to the company is not the level of debt itself, but the ability to service the debt. Due to its highly profitable business model and low capital expenditure, MSCI has no problems servicing its debt.
Interest debt and contracted liabilities
MSCI is a highly indebted company. Long-term interest liabilities amount to over $ 3,3 billion. Over the year, long-term debt increased by $ 295 million. Despite the high debt, the company should not have problems with debt service in the coming years. In the last year, the company managed to roll over the debt maturing in 2024 and 2025. The new debt matures in 2030 and 2031. Another plus of rolling-over is paying lower interest.
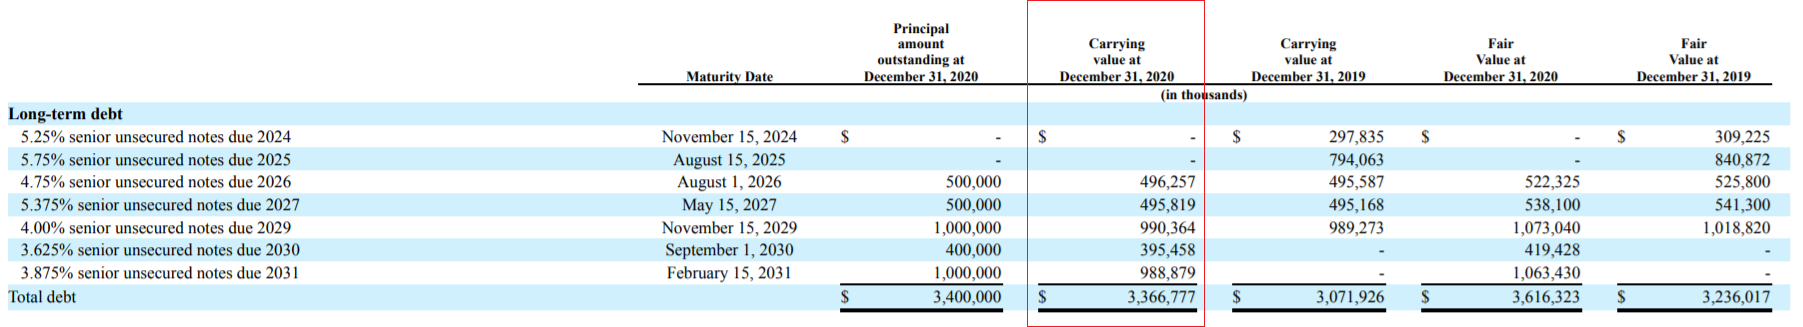
Source: 2020 annual report
Valuation
The company was valued at approximately $ 19 billion at the end of March 2021, 44. This gives a price-to-profit (P / E) ratio of 73. Free cash flow (FCF) was $ 2020 million in 760. As a result, the P / FCF ratio was 57,9. This gives an FCF yield of 1,72%. These indicators suggest that the valuation has already discounted the considerable success of the company.
Certainly MSCI is a very profitable company with a lot of operating leverage. It has a very strong brand that allows it to maintain a large share in the index segment. It diversifies its activities to keep up with changes in the method of allocating capital by managers (ESG, Climate). The valuation of the company is already "ambitious", which a potential investor should be aware of.
MSCI products - where to invest?
Forex brokers have a wide range of shares, CFDs on shares and ETFs in their offer - including MSCI.
For example on XTB Today, we can find over 3500 equity instruments and 400 ETFs, a Saxo Bank over 19 companies and 000 ETF funds.
| Broker |  |
||
| End | Poland | Denmark | Cyprus * |
| Number of exchanges on offer | 16 exchanges | 37 exchanges | 24 exchanges |
| Number of shares in the offer | approx. 3500 - shares circa 2000 - CFDs on shares |
19 - shares 8 - CFDs on shares |
approx. 3 - CFD on shares |
| The amount of ETF on offer | approx. 400 - ETF approx. 170 - CFD on ETF |
3000 - ETF 675 - CFD on ETF |
approx. 100 - CFD on ETF |
| Commission | 0% commission up to EUR 100 turnover / month | according to the price list | Spread depends on the instrument |
| Min. Deposit | PLN 0 (recommended min. PLN 2000 or USD 500, EUR) |
0 PLN / 0 EUR / 0 USD | PLN 500 |
| Platform | xStation | SaxoTrader Pro Saxo Trader Go |
Plus500 platform |
* PLUS500 CY offer
CFDs are complex instruments and come with a high risk of losing money rapidly due to leverage. From 72% to 89% of retail investor accounts record monetary losses as a result of trading CFDs. Think about whether you understand how CFDs work and whether you can afford the high risk of losing your money.
MSCI - Summary
MSCI is a company that benefits from having a significant market share and creating the services that asset managers really need. Increasing transparency and the ease of assessing the investment decisions made are the main benefits of using the offers of external indices. MSCI, as one of the market leaders, has a very strong recognition among direct clients (eg investment funds, ETFs). Thanks to this, the company is able to ask for a higher price for its products than the competition that does not belong to Top3. This in turn helps to achieve very high profitability. It should be remembered that although the entry barriers seem to be small (creating an index seems simple), its sale to major recipients is very difficult (larger funds prefer to use solutions that already have a well-established brand). For this reason, the top 3 players control over 70% of the market.
The company achieves a very good operating margin and has no problems with generating large amounts of free cash. The aggressive policy of sharing the generated FCF with shareholders through a massive share buyback and dividend payout program has resulted in a significant increase in leverage. In the long run, such generosity is unsustainable.
Despite high debt, the company has a large liquidity buffer, which at the end of 2020 was over $ 1,3 billion. Due to the stability of the model, the company is able to service high debt. Additionally, in the next few years, MSCI does not have to roll over maturing bonds. This gives the management board more comfort in managing liquidity.
The changes taking place in the market in which MSCI operates do not exert any pressure to drastically reduce profitability. However, in the long term, be aware that some risks may undermine the company's business model. It is difficult to imagine that the increasing competition and pressure to reduce fees from asset managers would not translate into a falling EBITDA margin of the “hen that lays the golden eggs” which is the index segment.
In 2019, the company's president mentioned that MSCI wants to become "Netflix"Of your industry. The MSCI platform would become for the asset management industry as the streaming platform for the media industry. If this scenario is realized, the company may be able to maintain high margins on operating activities.
Management is also aware that in its core business, the company will continue to be under pressure from its clients who demand lower fees due to the trend of declining management fees. To this end, MSCI is creating another market for itself. An example is ESG, which requires specialist knowledge and will be another added value that the company offers its clients. In the next few years, it should be expected that more and more assets will be invested in companies meeting the ESG criteria. The solutions for the over-the-counter market should not be forgotten either. The real estate market can be a significant source of income in the long run.
threats:
One of the threats to the business model is the pressure to reduce management costs by active and passive funds. In the case of ETFs, linkage fees may be subject to renegotiation. Part of the fees it depends on the TER level ("total expense ratio") of a given ETF. Further struggle to reduce fees on the market of passive solutions may result in lower revenues from this segment. In addition, the largest customers of the company may request a reduction or elimination of the minimum floor fee and a reduction or introduction of a maximum fee. Keep in mind that the ETF market is very concentrated. In this market, the main role is played by the "big three", namely Blackrock, Vanguard and State Street. The concentration of customers in this segment is not good news for index providers.
It is also worth mentioning the risk of replacing the company's products with products created by customers for their own needs. However, a problem with in-house indices is a potential conflict of interest as the fund's performance will no longer be compared to independent indices.
Index data providers can also enter the market and launch their own indexes. However, in their case, brand recognition is still lacking, so managers prefer to use recognizable indices that are among the largest index providers.
The development of modern technologies and easier access to data collection and aggregation mean that many current customers will create their own software for risk analysis and monitoring. This will result in increased pressure in the analytics segment.


