


Positive week for risky assets. Treasury bonds - how do they behave?

The second week of the new year is behind us, in which the markets were focused on the most important event, i.e. the release of December inflation in the US.
As inflation perfectly matched market expectations, we did not have a particularly significant reaction immediately after the release of the data (individual asset classes reacted differently). Investors have already valued a lot. Nevertheless, even before the release of inflation data, analysts outdid each other in increasingly positive forecasts of falling inflation and a "certain" positive reaction of the market. For example JP Morgan estimatedthat with a probability of 85% the S&P500 will increase after the publication of December inflation from 1,5% to 3,5%. In fact, it only increased by 0,34%.
Inflation, inflation, inflation…
No doubt US inflation remains in a downward trend. Nevertheless, the main question is whether it will be able to return to the 2% target at this rate and whether we can expect service inflation to return to levels below 2,5% without a significant deterioration in the labor market?
Inflation fell -0,08% in December 2022 (contributions of the monthly change in percentage points are: Food +0,04; Energy -0,35; core inflation of commodities -0,07; core inflation of services 0,314).
The annual change in inflation amounted to 6,45% (7,11% in November). In the case of an annual change, it is best to look at the changing contribution in subsequent months. The chart below shows the contribution of the annual change in inflation in November and December 2022.
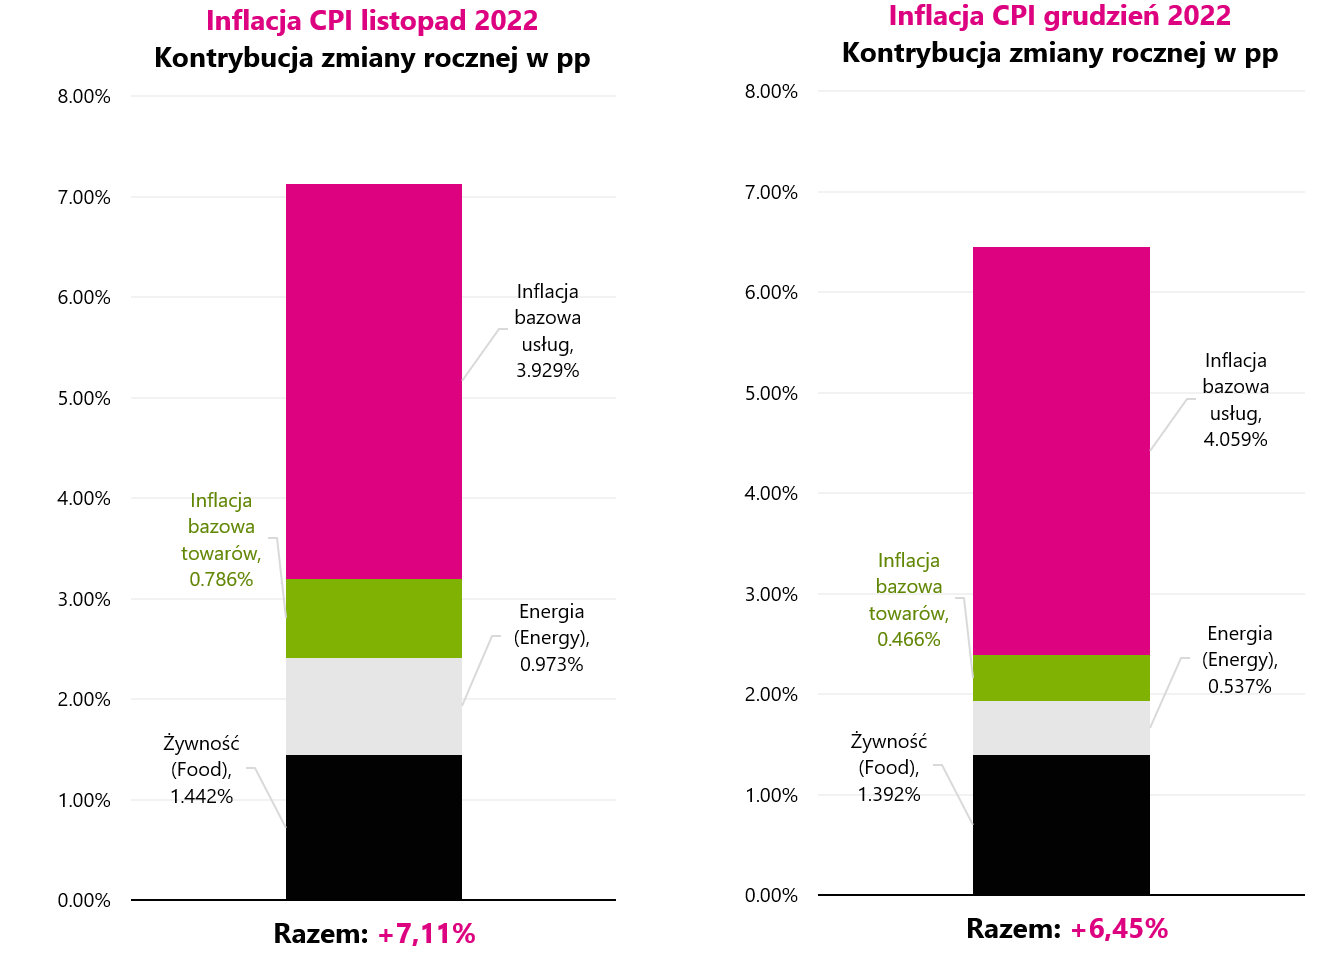
W. 1 Contribution of the annual change in inflation in the US, separately for November 2022 and December 2022. Source: own study, FRED
As shown in the chart above, only the contribution of services core inflation increased in December (from 3,929 pp to 4,059 pp). Contributions of other elements decreased. And that is the whole problem of today's inflation. Core service inflation is the stickiest and will be the hardest to beat. However, from the presentation of J. Powell on November 30, 2022, we also know that Powell divides core inflation into three parts, but according to him, only one will cause a problem in the medium term.
The first is core goods inflation (mainly prices related to home furnishing, household appliances, clothes, footwear, cars, goods related to education, recreation and healthcare). But that inflation is already declining and won't be a problem.
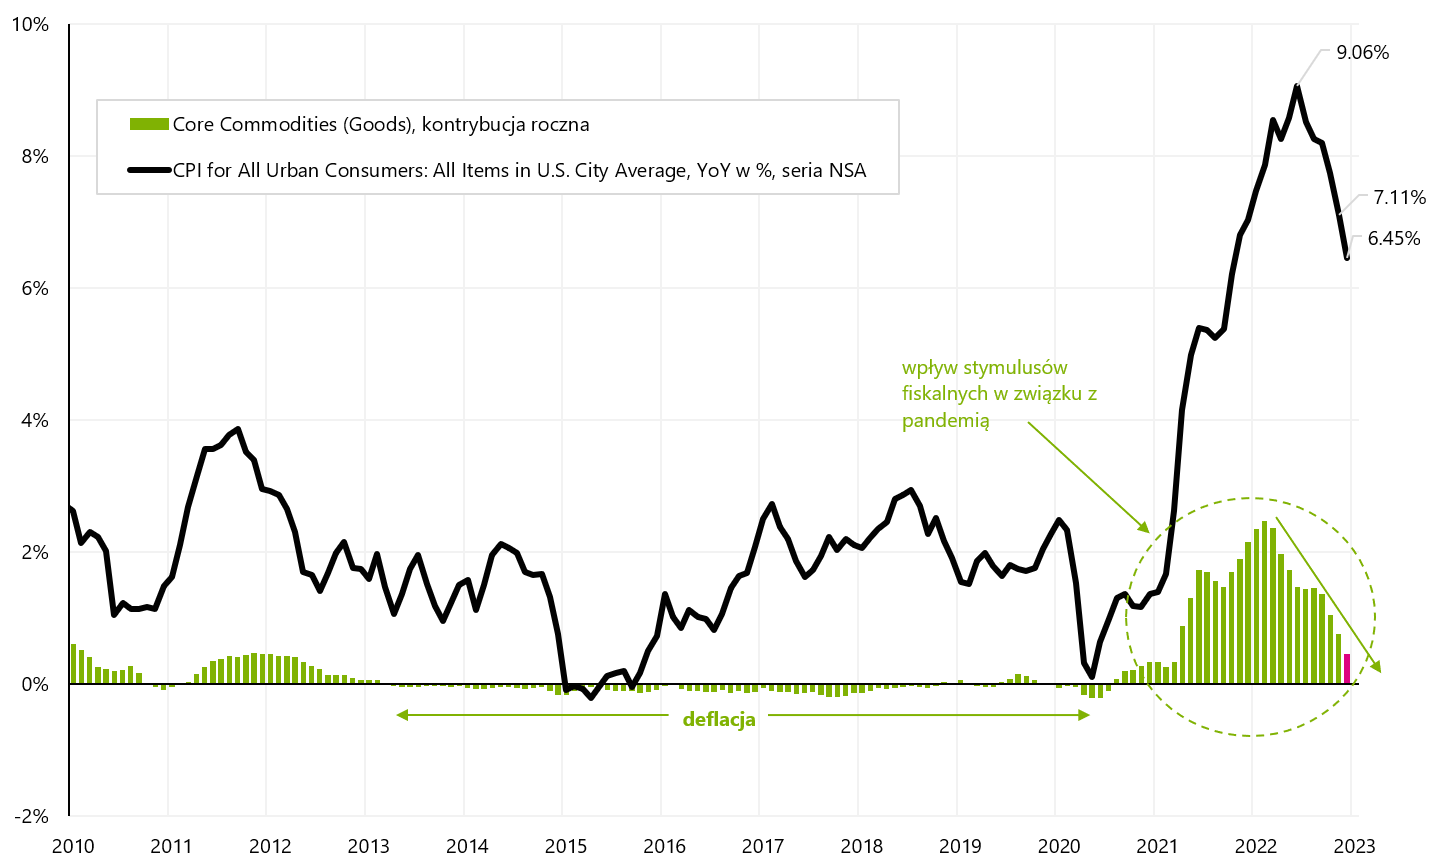
W. 2 core inflation of goods and its contribution to the annual change in inflation in the US. Source: own study, FRED
The second is the core inflation of housing services (the so-called "shelter", i.e. inflation related to the rental of apartments). It is still growing strongly, but this is mainly due to the way it is calculated and the significant time lag between this inflation and rental prices, which are already falling sharply (which means that in some time this inflation will also start to fall - it is widely known fact).
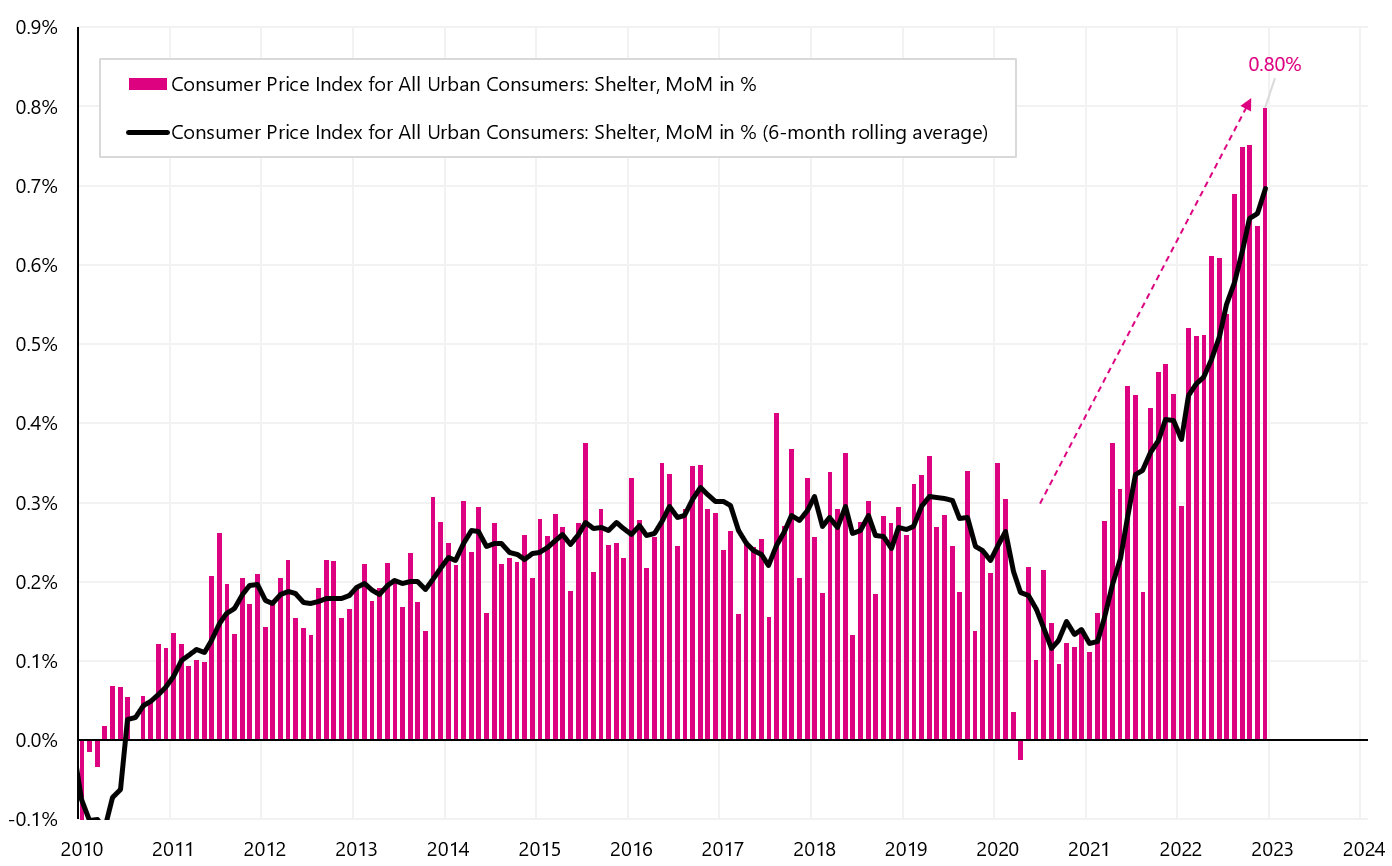
W.3 Monthly Change "Shelter" inflation in Usa. Source: own study, FRED
And remains the third part of core inflation, i.e. core inflation of services other than housing (mainly medical, transport, recreation, education, communication, telephone and internet services). Powell clearly stated that only defeating this inflation means success in the fight against inflation. The key to overcoming it is the labor market, because the highest cost of these services is wages (which should fall in order to lower the prices of these services and finally this part of inflation).
It is also worth noting that the FED's formal inflation target is PCE inflation (based on consumer personal spending), which is published about 2 weeks after CPI inflation - hence, investors focus mainly on analyzing CPI inflation. The main difference is that in PCE inflation, core inflation in services other than housing is over 50% of the basket, and in CPI inflation only around 25%. Nevertheless, these are still very similar series and in general the conclusions will be the same. Below we present the core inflation of services other than housing.
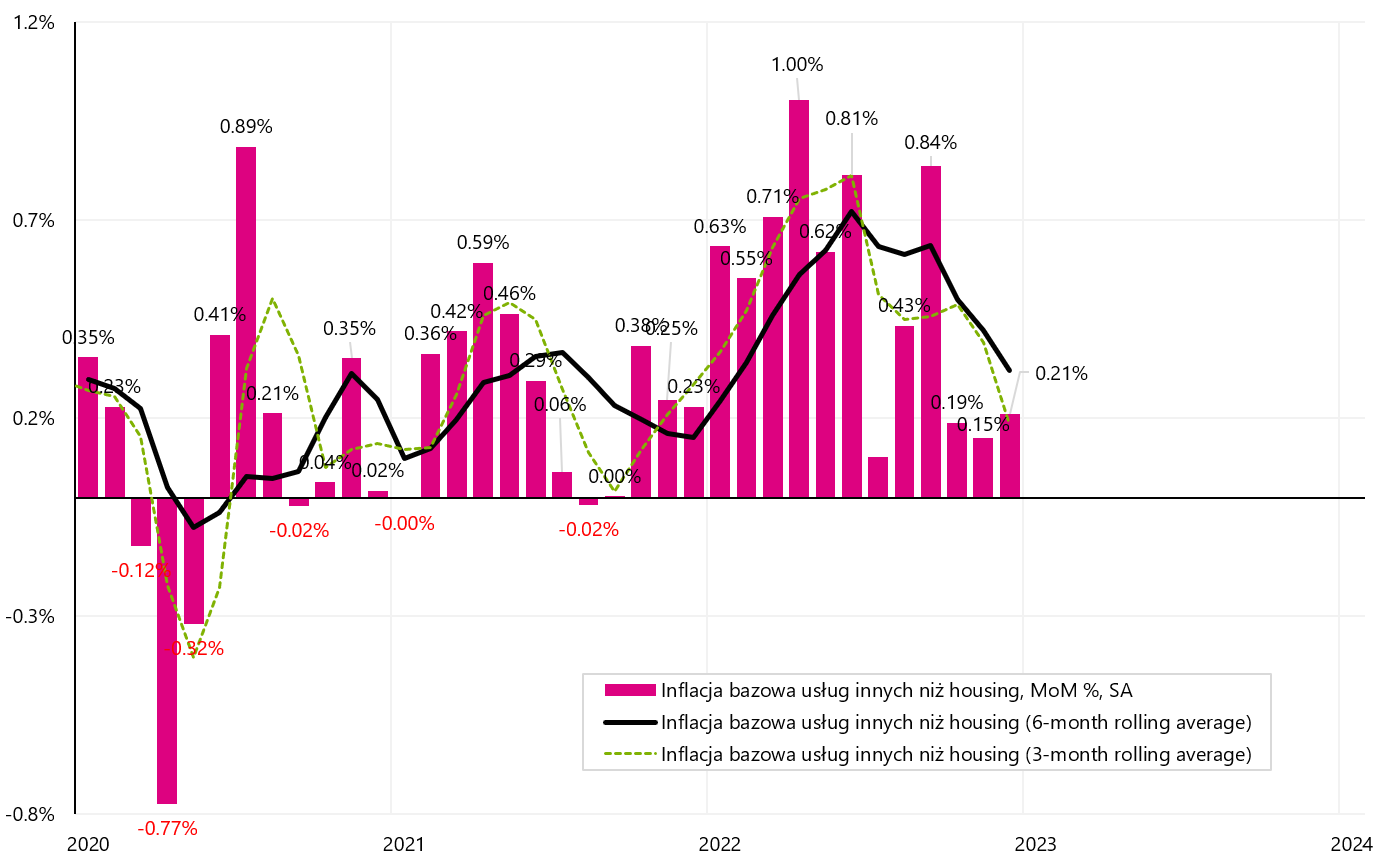
W.4 Monthly Change core inflation of services other than housing in Usa. Source: own study, FRED
As you can see in the chart, the last 3 months look encouraging, when the average monthly change was only 0,18%. Nevertheless, the series is quite volatile and it is difficult to say at this stage that the inflation problem is behind us. What will the Fed do? He will certainly wait for more data in the coming months. While the trend is downward, especially the last three months are going in the right direction, waiting for the next data "doesn't cost much" in the current situation of a strong labor market and quite strong economic growth in the fourth quarter of 2022.
The latest labor market data on unemployment benefits do not indicate an increase in unemployment. In the week ending January 7, first-time benefits fell from 206 to 205 thousand. – which indicates a further lack of pressure to increase unemployment. However, if we look at the latest forecast of the GDPNow Atlanta FED model, according to this model, GDP in Q4 2022 will increase by 4,1%, which is certainly far from a slowdown and recession - and gives the FED a lot of "comfort" in leaving rates " higher for longer.
Another positive week for risky assets
In the past week, Polish indices continued their growth, with the largest increase Wig20 (3,6%) and the least mWIG40because only 0,2%. Since the beginning of the year, the sWIG80 increased the most, by as much as 7,9%. However, since the lows of October 2022, the WIG20 index has increased by 41,6%. Details are presented in the table below (results are sorted by the last column, i.e. returns in the past week).
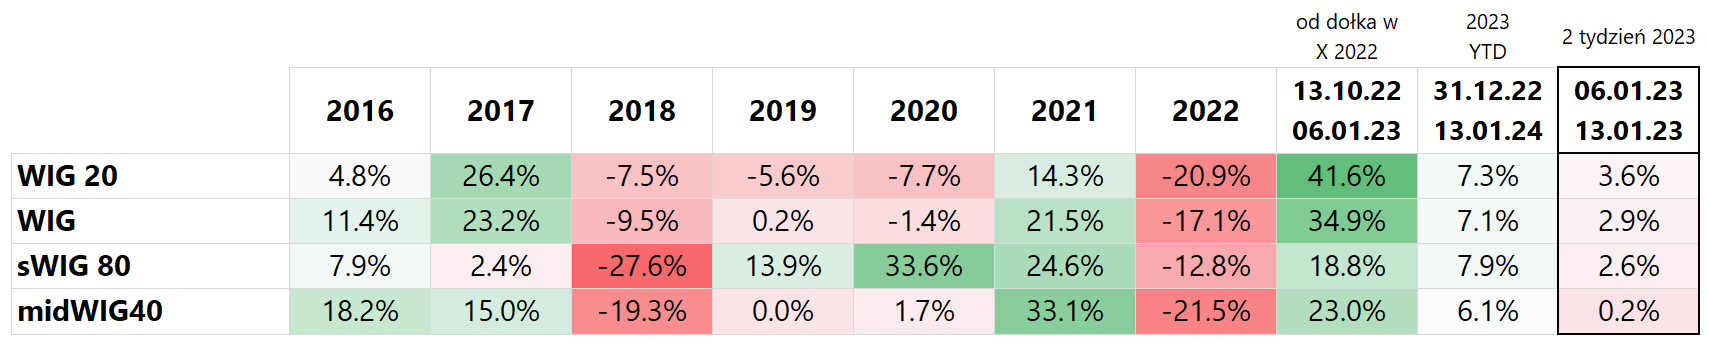
T1. Polish indices in 2016-2022 and early 2023
The chart below shows changes in Polish indices since the beginning of 2022.
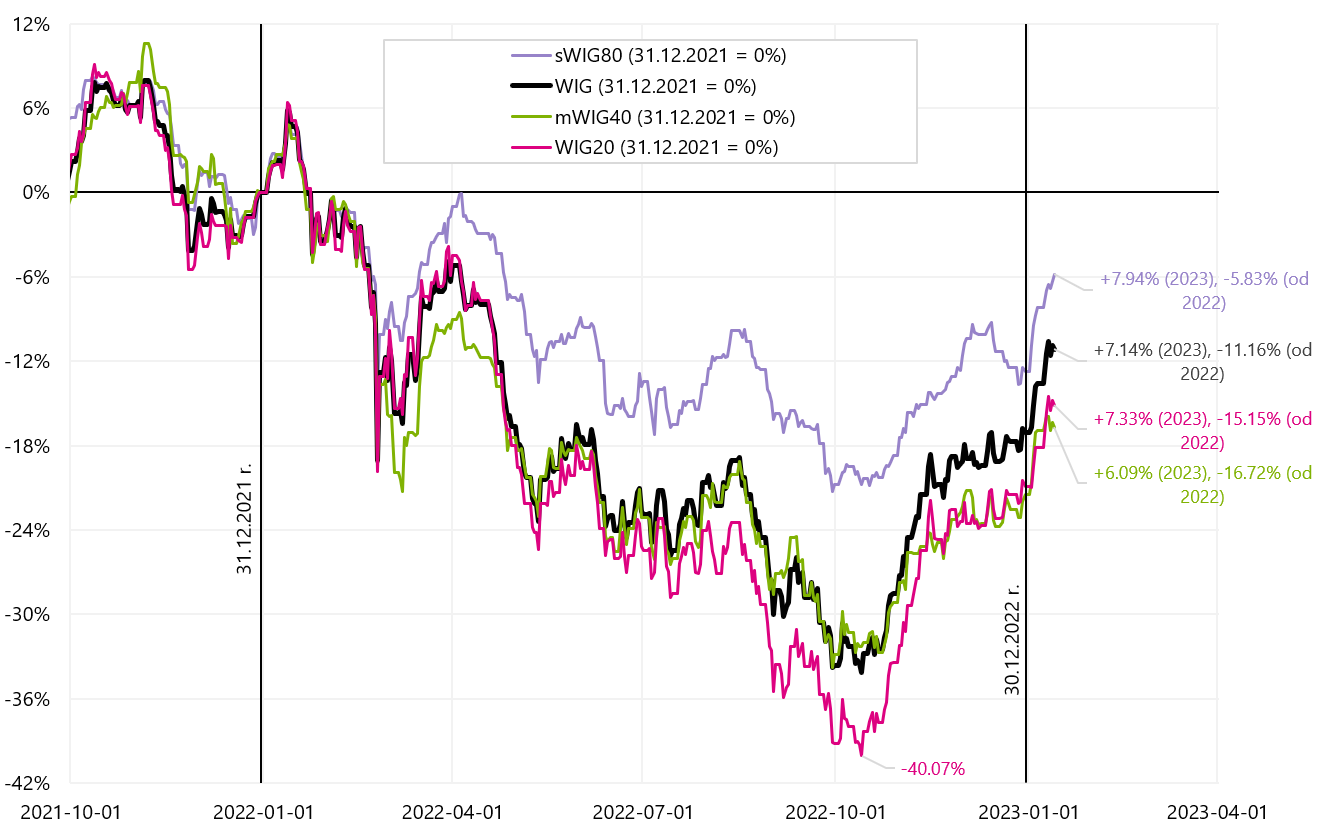
W. 5 Polish stock indices until December 13.01.2023, XNUMX. Source: own study, stooq.pl
If we compare WIG20 and S & P500 from the beginning of 2022 to January 13, 2023 - it's minimal, but still WIG20 has a slightly better result (we present it in the next chart). Of course, the WIG20 owes this to a strong rebound from the lows of October 2022.

W. 6 WIG20 vs S&P500 until December 13.01.2023, XNUMX. Source: own study, stooq.pl
The S&P500 gained 2,67% last week and is now 11,8% above the October 2022 low. At the same time, the S&P 500 broke up its 200-session average and this is the fourth attempt to break this average in the current bear market (previous cases did not last very long - as you can see in the next chart). There are 30 index points left to the local high of November 81 (+2,03%).
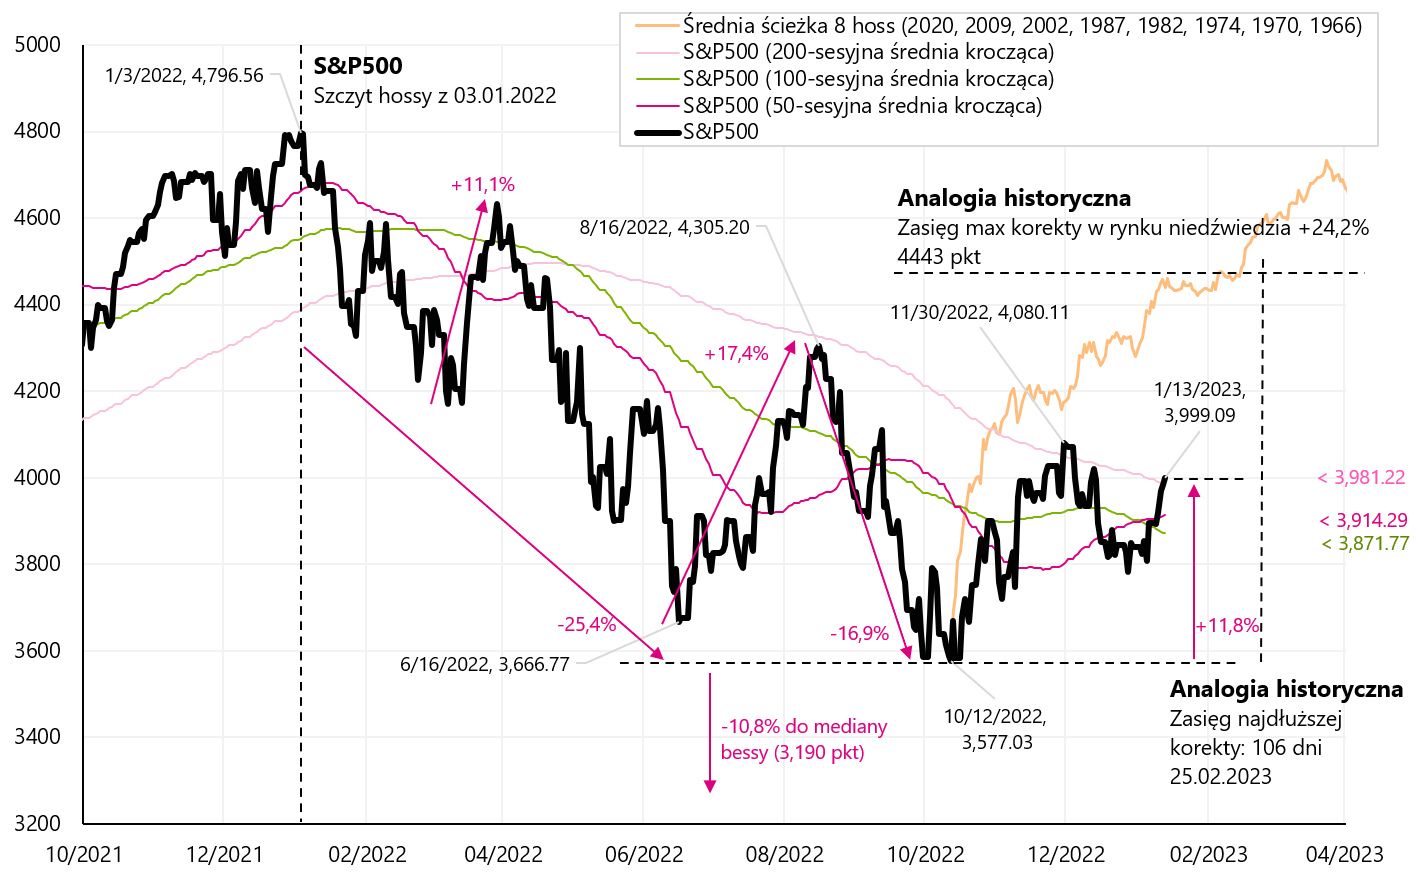
W. 7 S & P500 index until December 13.01.2023, XNUMX. Source: own study, stooq.pl
Good moods in the stock markets may strengthen investors' belief in a "soft landing" scenario, i.e. a mild recession, rapid interest rate cuts by the FED and the absence of another downward wave in the S&P500, which could lead to further lows in this cycle. The longer the markets bounce back (we had a low on October 12.10.2022, XNUMX) and the longer they "don't want to fall" - the investors' belief may even gain strength. Let's look at how long we've had upward corrections in previous bear markets.
In the next chart, we present 5 upward corrections during the bear market from 200-2002. All these 5 corrections were "hooked" on the chart on October 12.10.2022, 500 (i.e. on the day of the last low of the S&PXNUMX).

W. 8 S & P500 index until January 13.01.2023, 5 against the backdrop of 2000 upward corrections during the bear market in 2002-XNUMX. Source: own study, stooq.pl
But we can also check how the bear market ended in 2002 and how the new bull market of 2002-2007 began. As you can see in the next chart, the new bull market was born "in pain". At that time, hardly anyone believed that the bottom was over - the psyche of investors (after a 2,5-year slump, the S&P500 fell by almost 50%, and the Nasdaq by about 78%) was completely opposite to today's. From the macro side, one of the main topics at that time was the risk of a double-dip recession in 2003.
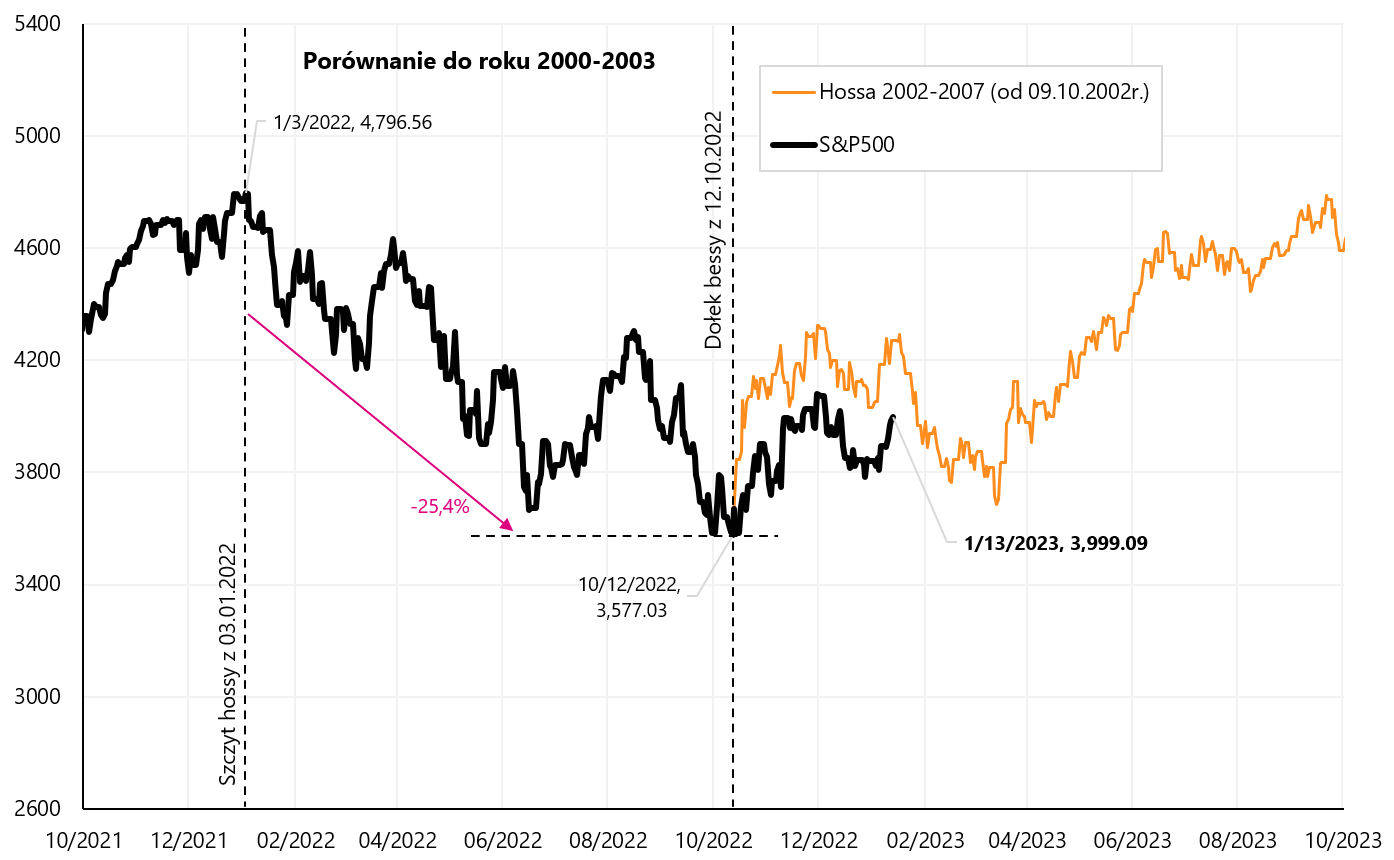
W. 9 S & P500 index until January 13.01.2023, 2002 against the background of the beginning of the new bull market in 2007-XNUMX. Source: own study, stooq.pl
Below is another chart showing the same comparison to the 2008-2009 bear market. In this case upward corrections were shorter and faster, the bear market itself lasted a year and a half, and the beginning of the new bull market was also more dynamic.
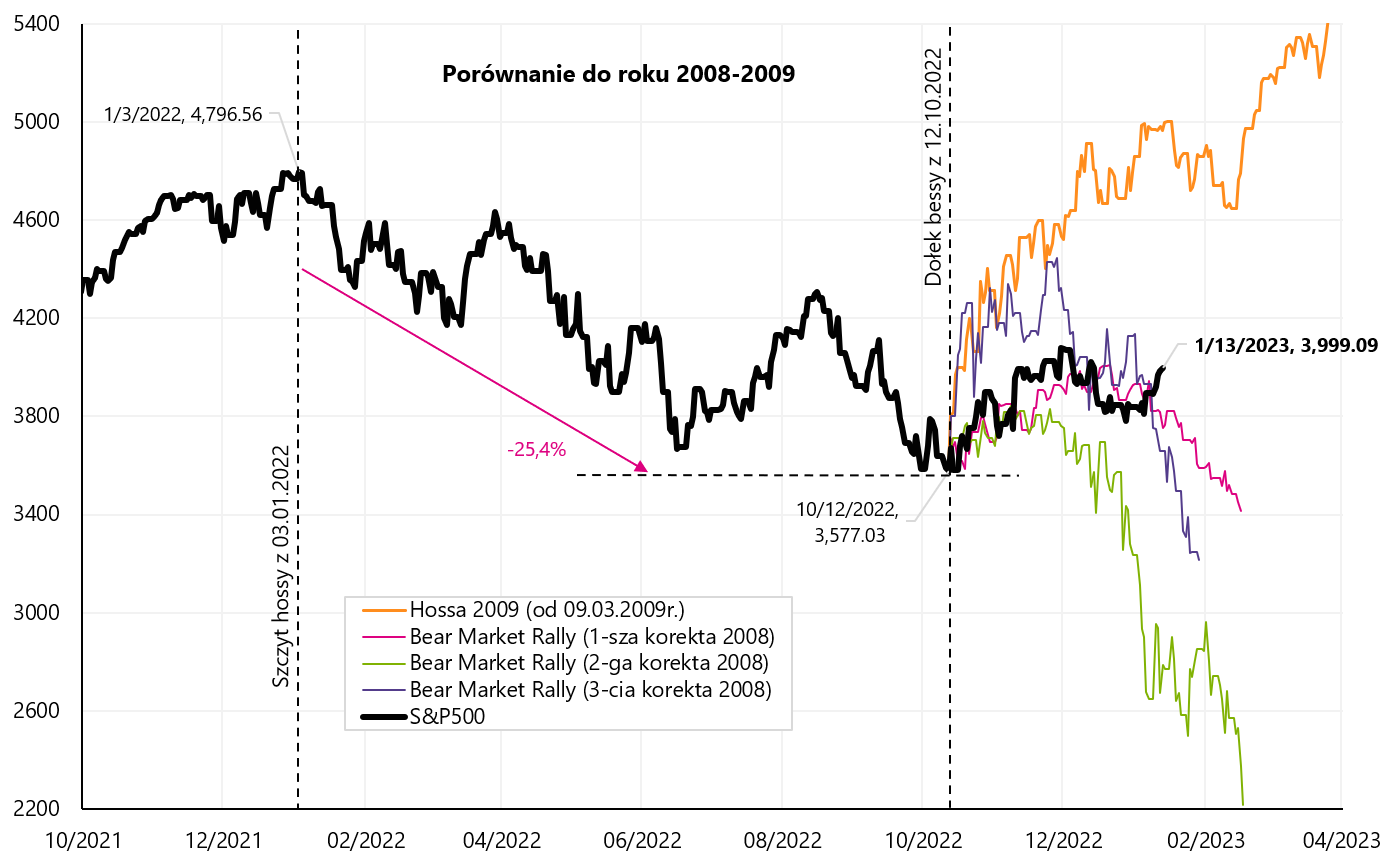
W. 10 S & P500 index until January 13.01.2023, 3 against the background of 2008 growth corrections during the bear market in 2009-2009, and against the background of the beginning of a new bull market in 2020-XNUMX. Source: own study, stooq.pl
Treasury bonds, how do they behave at this point in the cycle?
After two key data this year (December US employment report and December US inflation) we had quite strong declines in US yields treasury bonds. The chart below shows a comparison of the S&P500 with two ETFs representing the entire US Treasury Bond ETF sector and only the iShares 20+ Year Treasury Bond ETF sector.
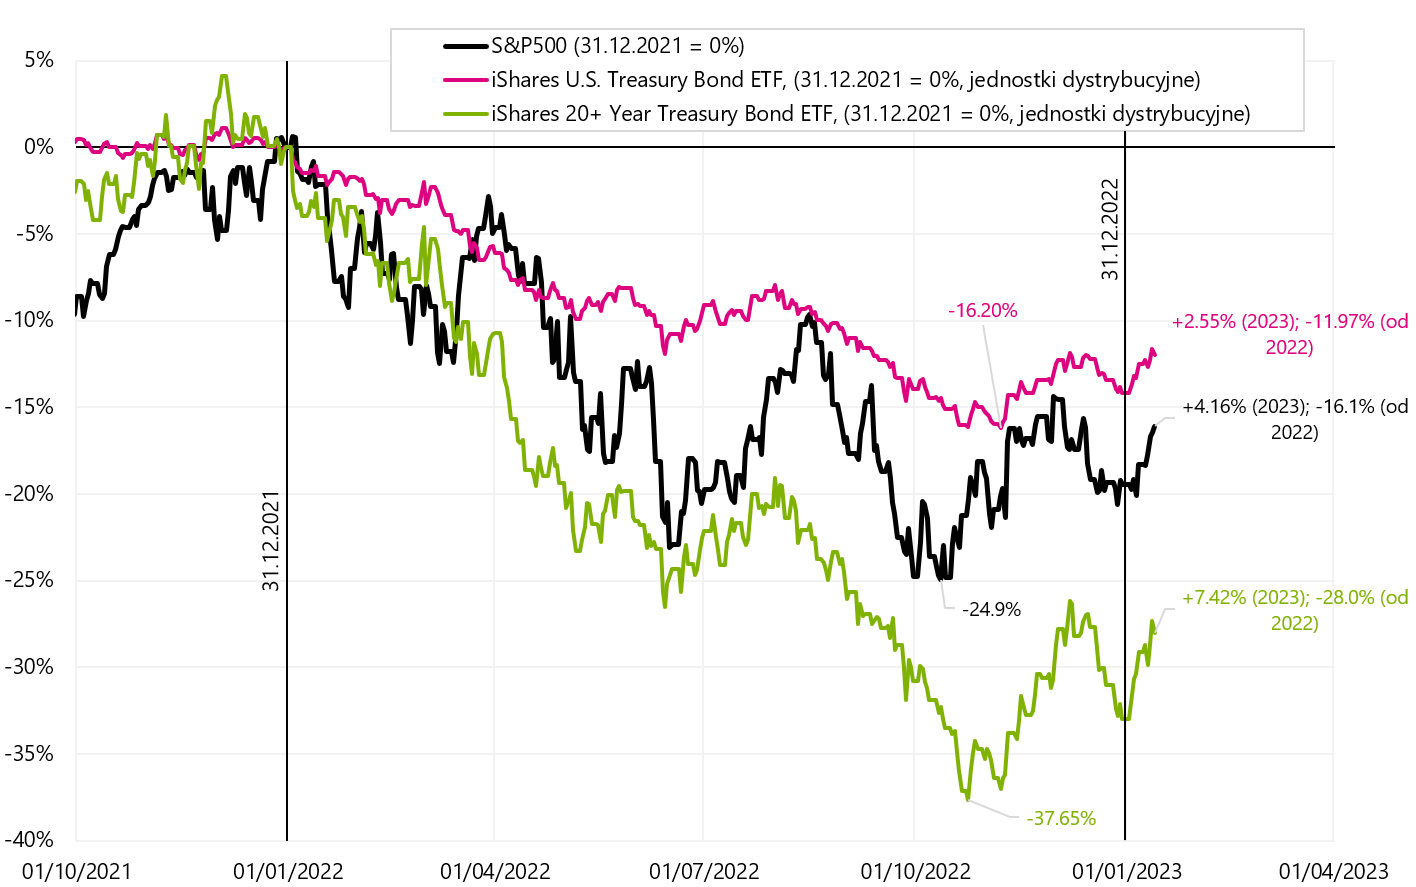
W. 11 S & P500 index and iShares US Treasury Bond ETF and iShares 20+ Year Treasury Bond ETF until January 13.01.2023, XNUMX. Source: own study, stooq.pl, ishares.com
Since the beginning of the year, the rate of return on 20-year treasury bonds is +7,42%. And in the case of the S&P500 index it is +4,16%. Bonds over 20 years to maturity can offer comparable or even higher rates of return at the end of the economic expansion cycle, and especially during a classic recession (when stocks fall for fear of weak corporate profits, and bonds rise in anticipation of Fed rate cuts).
The rates of return on bonds depend mainly on the size of the decline in their yields. The next chart compares bonds and equities during the end of the previous cycle and immediately after the economy entered recession in 2020.

W. 12 iShares Core S&P500 and iShares US Treasury Bond ETF and iShares 20+ Year Treasury Bond ETF in the years 2018 - 2020. Source: own study, stooq.pl, ishares.com
Risk Assets: Summary
In the past week, the most important for the markets was the release of inflation in the US, which turned out exactly as expected by the market. We have a disinflation trend on both headline and core inflation. We also see a weakening of core inflation in services other than housing, which is the most important for the Fed. In such a situation, the FED should wait for the next data, but the comments of FOMC members will also be interesting in terms of a possible change in their rhetoric towards dovish (ie towards a more lenient monetary policy).
On the other hand why would inflation in non-housing services fall significantly when the economy is still strong (we are going to Q4 2022 GDP of 4,1%, with an increase in consumer spending on services (PCE Services) of 3,62%)? Additionally, the labor market shows no particular signs of slowing down (see unemployment benefits) and unemployment is at its lowest in the cycle (3,5%). So in the conditions of high demand for services and full employment (which should mean pressure on wages), the prices of services will fall and will not rise? One could conclude that in such a situation services inflation could remain at a high level for longer. The solution will certainly be in the coming months, when we get to know the next data on wage growth, consumer spending on services and the core inflation of services other than housing.
In the second week of the new year we had a continuation of increases in risky assets. WIG20 has already increased by +7,3% this year. The S&P500 index +4,16% and the Nasdaq100 index +5,50%. Chinese stocks (iShares MSCI China ETF +13,3%) and European stocks (DAX +8,4%) also rebounded strongly this year.
In the near future, both the results of companies whose publication season has just started and the FED itself, which may still be hawkish (the next rate hike will take place on February 1), will be of great importance for the stock markets.
In the medium term, however, a lot will depend on whether the stock markets will remain in the current market regime (inflation is behind us, the FED rate hike is practically behind us, we are waiting for the first cuts in 2023, the recession will be mild) or At this point, the market regime will change to one in which the slowdown of the economy and declines in corporate profits will be the most important (and the problem of inflation will recede into the background).
About the Author
 Jaroslaw Jamka - Experienced fund management expert, professionally associated with the capital market for over 25 years. He holds a PhD in economics, a license of an investment advisor and a securities broker. He personally managed equity, bond, mutli-asset and global macro cross-asset funds. For many years, he managed the largest Polish pension fund with assets over PLN 30 billion. As an investment director, he managed the work of many management teams. He gained experience as: Member of the Management Board of ING PTE, Vice-President and President of the Management Board of ING TUnŻ, Vice-President of the Management Board of Money Makers SA, Vice-President of the Management Board of Ipopema TFI, Vice-President of the Management Board of Quercus TFI, Member of the Management Board of Skarbiec TFI, as well as Member of Supervisory Boards of ING PTE and AXA PTE. For 12 years he has specialized in managing global macro cross-asset classes.
Disclaimer
This document is only informative material for use by the recipient. It should not be understood as an advisory material or as a basis for making investment decisions. Nor should it be understood as an investment recommendation. All opinions and forecasts presented in this study are only the expression of the author's opinion on the date of publication and are subject to change without notice. The author is not responsible for any investment decisions made on the basis of this study. Historical investment results do not guarantee that similar results will be achieved in the future.


