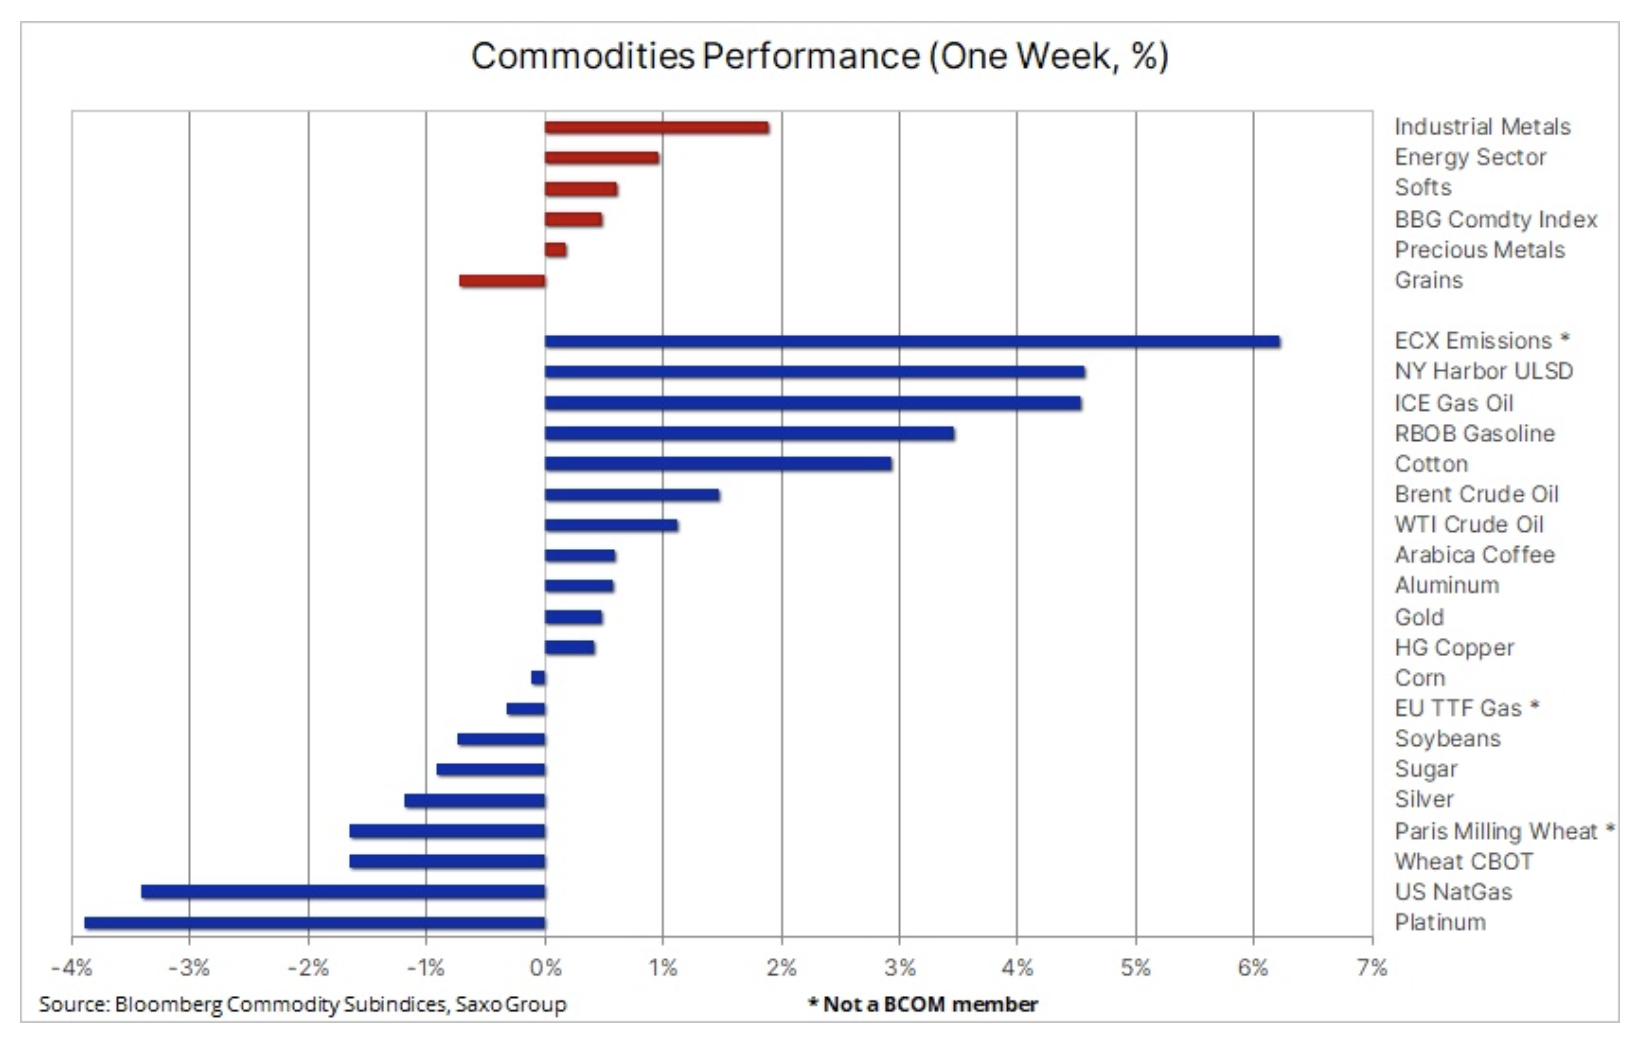
Fuel products join gold and copper and go up

The Bloomberg Commodities Index rose for the second week in a row as industrial metals, crude oil and fuel products continued to strengthen. The uptick in China's growth outlook was partly offset by strong losses in natural gas and wheat, as mild weather conditions and strong supply continue to keep both of these key commodities under pressure. At the same time, the situation in the precious metals sector was mixed - gold continued its growth supported by the yields of US bonds and the dollar, which were near the lows of the cycle. Silver and platinum struggled to follow gold, but both suffered losses, bringing silver back to almost unchanged levels on a monthly basis.
The overall positive risk outlook in commodity markets was supported by a 1,6% drop in the Bloomberg Dollar Index and a sharp 0,4% drop in US 0,25Y yields as US inflation continues to ease, contributing to further lowering the trajectory of interest rate increases towards the "final increase" by 5%. In addition, Russia's attempt to suppress a sovereign nation and the Western world's response to Putin's aggression remains a depressing and still unresolved situation that continues to translate into chaos in global supply chains for key raw materials, in particular in the energy sector, where the oil embargo already imposed on February XNUMX will be extended to include fuel products - which may have a greater impact on Russian supply than the existing measures.
The main driver of the strengthening in the commodity markets, however, was the prospect of reopening the Chinese economy, which boosted expectations for increased demand from the world's largest consumer of commodities. With activity in China unlikely to pick up in earnest before Chinese New Year, the prospect of a lull could be the impetus to stop the current rally - particularly in industrial metals markets where copper started the current year with an XNUMX% gain - until it picks up a new pace and strength at the end of the current quarter.
Oil is gaining momentum
Prices oil for the second week in a row, they recorded an increase, thus fully eliminating the weakness that appeared on the market in the first days of January. The continued optimism regarding demand in China and the increasing strengthening of the fuel products market contribute to the increase in prices. Both gasoline and diesel hit two-month highs ahead of the embargo on Russian fuel products on Feb. 5 and after the cold winter returned to the US in late December, which continues to negatively impact refinery operations.
Emerging reports that the number of Covid infections in China has already peaked has further increased optimism that demand will start to pick up in earnest after the Chinese New Year celebrations. Global demand expectations also increased after the release of data on unemployment claims in the United States, which confirmed that the supply in the labor market is still limited, thus reducing the risk of recession in the world's largest energy consumer economy. U.S. Oil Exports Spike and First Week Without Using Strategic Reserves (Strategic Petroleum Reserves, SPR), however, pushed inventories up by 8,4 million barrels as refinery demand growth was hampered by December's cold weather and shutdowns.
Monthly OPEC reports and the IEA on the oil market present a mixed picture, although both of them consider the recovery in China to be the main driver of the increase in global demand for oil this year. According to the IEA report, global demand for oil increased by 1,9 million barrels per day - to a record high of 101,7 million barrels per day - with China accounting for half of this increase after the lifting of Covid restrictions. Overall increase of 1,9 million barrels per day in non-countries OPEC, led by the United States, Canada and Brazil, will be partially offset by a decrease of 870 thousand. b/d in OPEC+ due to expected declines in Russia.
After bouncing off support at the 83,77-day moving average ($87), the weekly close above $81 for Brent crude could signal further strength this week. The same could be true for WTI oil at $XNUMX.
Gold continues to rise, silver struggles
While silver faced difficulties, gold continued to be resilient, and after a three-day decline during which it found support at $1, the metal rose to an eight-month high of $896, supported by US bond yields and the dollar near new cycle lows. Gold is likely to remain supported as long as these two key sources of inspiration for machine and momentum strategies remain low. This is despite the continuing lack of interest from investors in exchange-traded funds - the total position remains close to a two-year low and has not increased during the rally over the past two months.
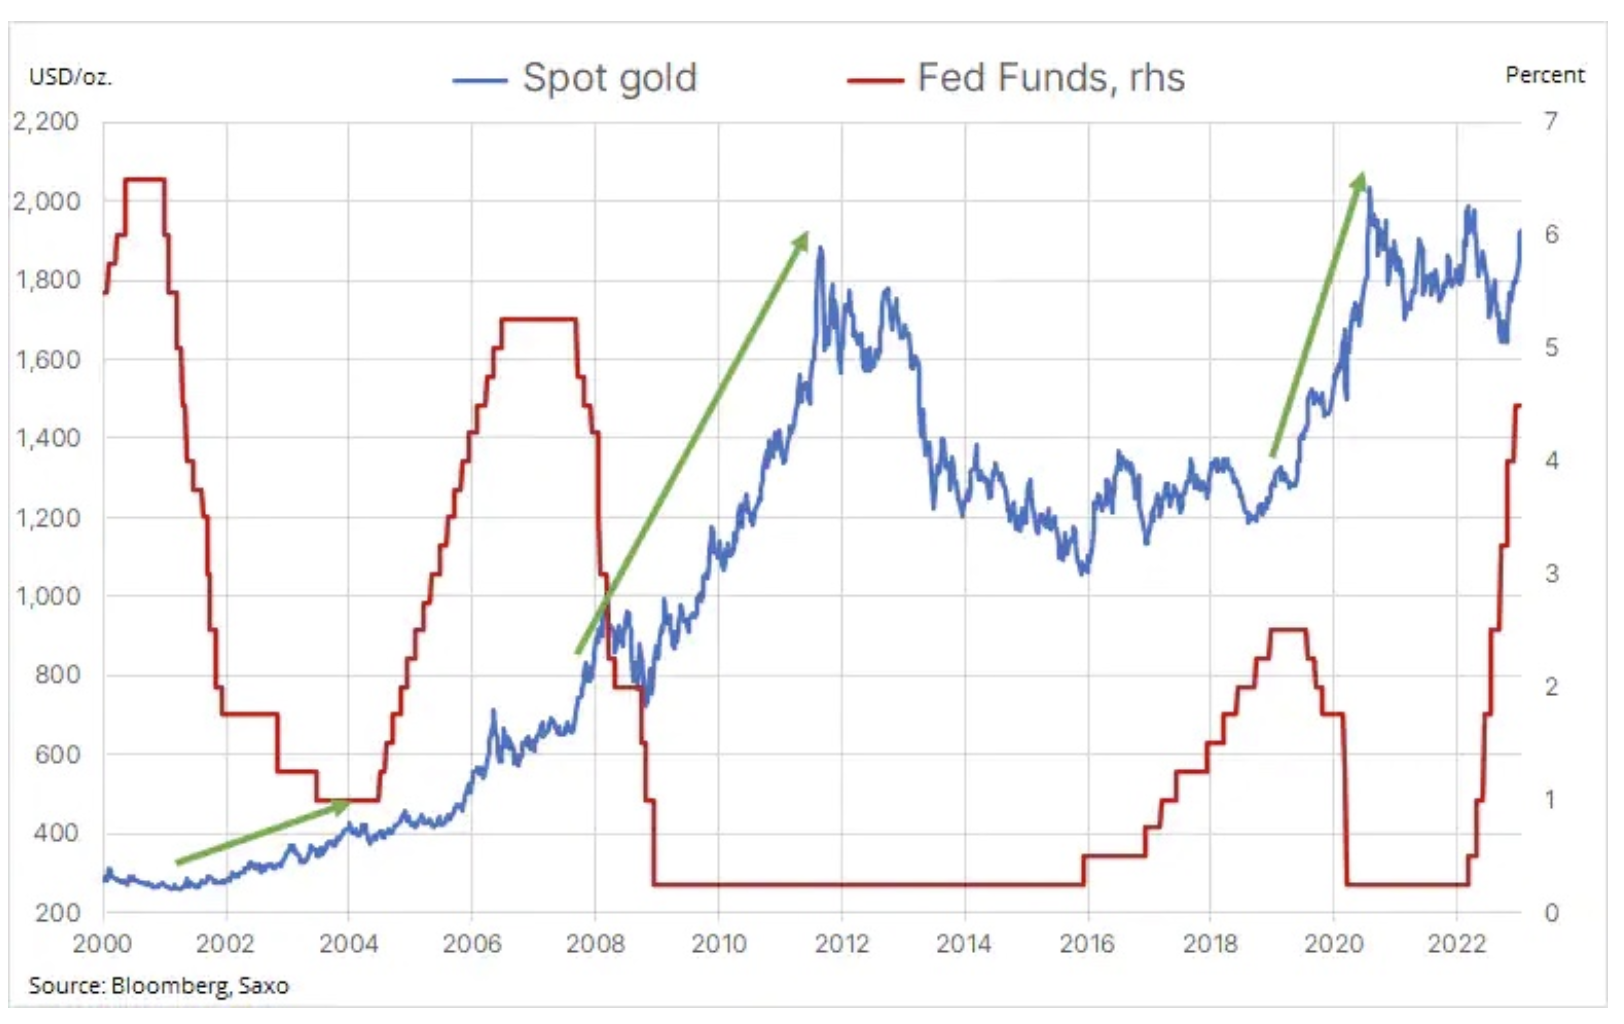
Last week I paid particular attention to the following chart showing the Fed funds rate and the price of gold. It shows gold's strong reaction in the months and quarters that followed the three previous highs of the US interest rate hike cycle over the last 20 years. At this point, the market is predicting one or two rate hikes in the US, followed by a stop at or below 5%.
If history were to repeat itself, gold would have significant upside potential, particularly given the prospect of last year's negative factors related to a stronger dollar and rising yields reversing, which could provide additional support. In addition, continued demand from central banks and the prospect of institutional investors eventually joining the ranks remain a strong push for gold. However, in the short term, the risk of falling again continues to increase, and a break below the current support of $1 could signal a deeper fall and test the 895-day moving average, currently at $1.
Copper
Copper posted an increase for the fifth week in a row, with optimism about demand picking up after the reopening of the Chinese economy is supported by supply concerns. The protests in Peru are threatening supplies from two mines that account for about 2% of the world's production of the metal. While apparent stocks on exchanges are low, demand is expected to pick up as China recovers and the energy transition continues. After a strong gain of 11%, there may be a pause in the coming weeks as China closes its factories and the population begins to celebrate the New Year and the arrival of the Year of the Rabbit - an animal associated in Asia with peace, prosperity and longevity.
How do I get exposure to raw materials?
There are several ways to gain exposure to commodities, the most common being Exchange Traded Funds (ETFs). exchange traded funds). Through them, investors can access and track the performance of a single commodity (e.g. gold), sector (e.g. cereals), or engage across the most important commodities broken down into three sectors: energy, metals and agricultural products.
The three major indices - S&P GSCI, Bloomberg Commodity and DBIQ Optimum Yield Diversified Commodity - have become industry benchmarks for commodity investors.
CHECK: How to invest in commodities? [Guide]
Commodity indices: Particular structures and strategies
Established in 1991, the S&P GSCI index is based primarily on weighted global production. It includes 24 physical commodities traded on active, liquid futures markets. The weighting of each commodity in this index is set by average production volume and is intended to reflect its relative importance in the global economy.
Due to this structure, the S&P GSCI index has a very strong exposure to the energy sector – 61,5% of this index is currently invested in energy commodities, from crude oil and fuel products to natural gas.
Established in 1998, the index Bloomberg Commodity (BCOM) took a more nuanced approach. This index also includes 24 physical commodities, all of which are traded in active futures markets. No single commodity may account for more than 15% of the index, no related group of commodities may account for more than 33% of the index, and no single commodity may account for less than 2% of the index, where liquidity permits.
The weight of each commodity is calculated according to rules designed to ensure that the relative weight of each individual base commodity reflects its global economic importance and market liquidity.
Finally, the DBIQ Optimum Yield Diversified Commodity Excess Return Index is a rules-based index of futures contracts on 14 of the world's most heavily traded and important physical commodities.
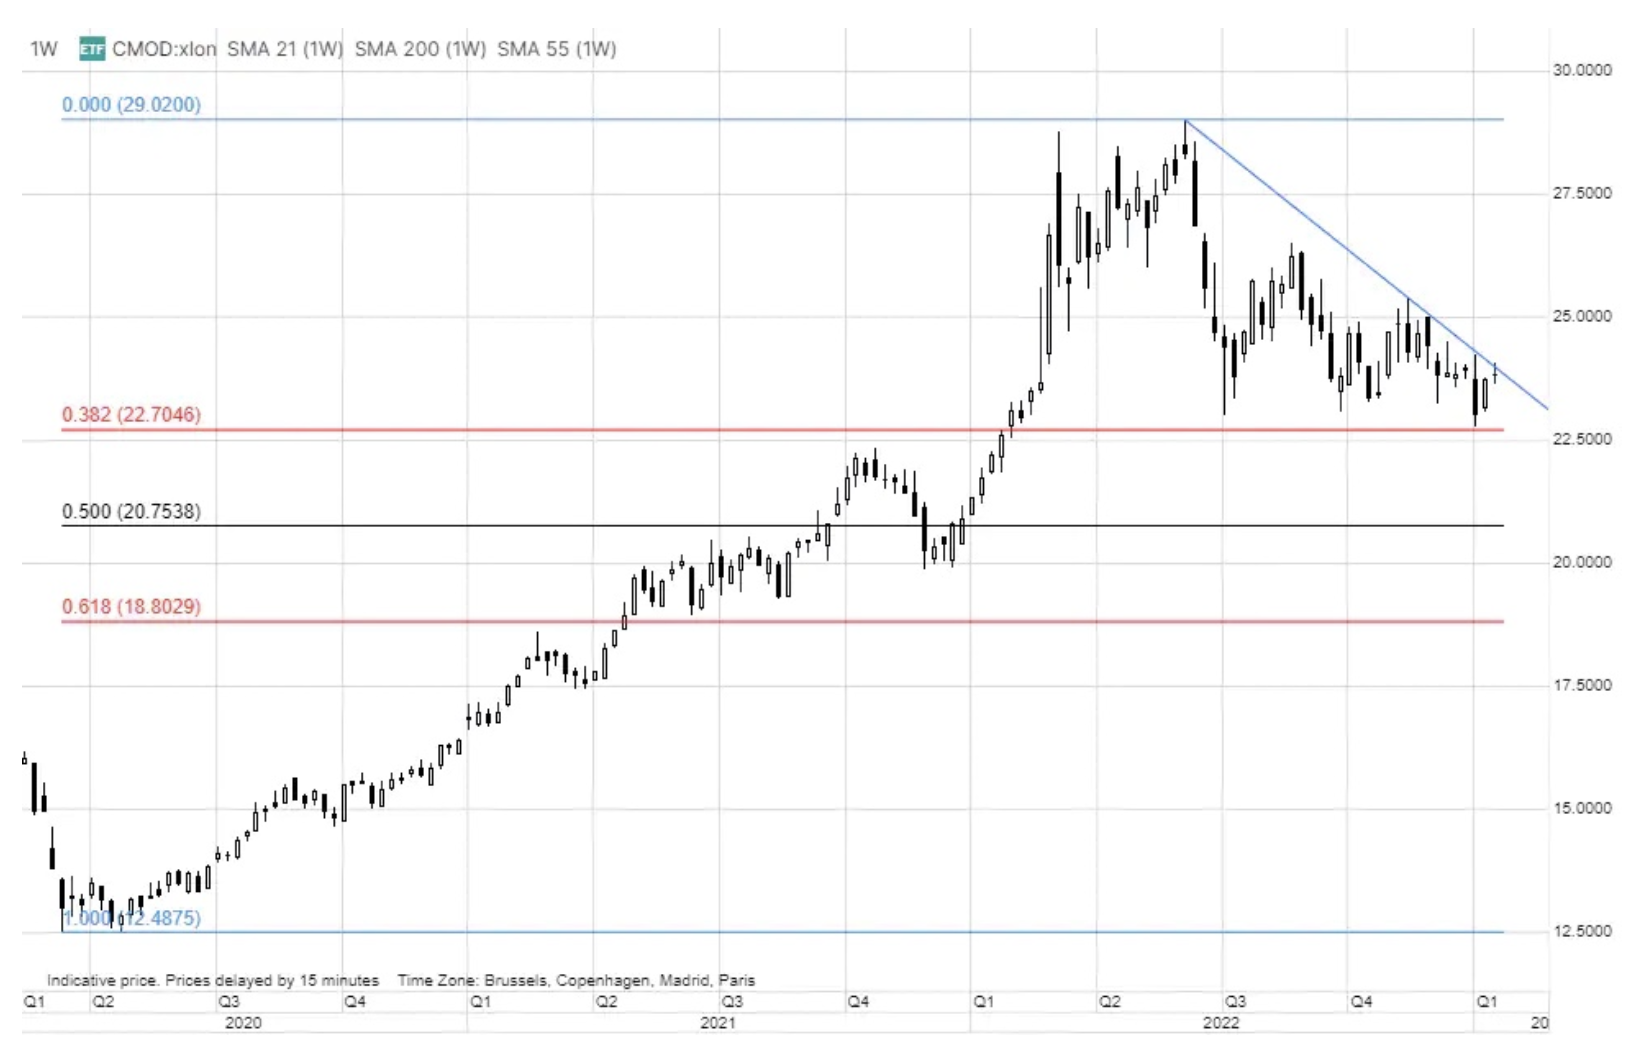
We tend to focus on the Bloomberg Commodity Index in our reporting due to its broad sector exposure. Precious metals, for example, account for just 4,1% of the S&P GSCI index compared to 19,4% for the BCOM. The example below shows the Invesco BCOM UCITS fund, and although the price is within the corrective descending triangle, the fact that it has so far only managed to make a 38,2% correction from the 2020-2022 rally indicates a weak correction within a strong uptrend.
About the Author
 Ole Hansen, head of department of commodity market strategy, Saxo Bank. Djoined a group Saxo Bank in 2008. Focuses on providing strategies and analyzes of global commodity markets identified by foundations, market sentiment and technical development. Hansen is the author of the weekly update of the situation on the goods market and also provides customers with opinions on trading goods under the #SaxoStrats brand. He regularly cooperates with both television and printed media, including CNBC, Bloomberg, Reuters, Wall Street Journal, Financial Times and Telegraph.